Artificial intelligence analyses corroborates the GUCA2A gene as a promising biomarker for the diagnosis of colon cancer
Published in Computational Sciences
Abstract
For this report, I aimed at determining the sex-specific genes, age-specific genes and race-specific genes. I obtained lists of differentially expressed genes for many comparisons, namely Tissue Type (Tumor vs. Normal), Tumor Descriptor (Primary vs. Normal, Premalignant vs. Normal, Metastatic vs. Normal), Sex (Male tumor vs. Male normal, Female tumor vs. Female normal), Age (60-69 years tumor vs. 60-69 years normal, 70-79 years tumor vs. 70-79 years normal, 80-89 years tumor vs. 80-89 years normal) and Race (white tumor vs. white normal ). Biomarker selection was also performed with variable importance analysis and decision trees with default parameters. Results show GUCA2A gene as a promising biomarker for the diagnosis of colon cancer.
Keywords : colon cancer, transcriptome, cohorts, differential expression, artificial intelligence, biomarker, GUCA2A gene
1. Introduction
In 2026, the American Cancer Society estimates approximately 158,850 new colorectal cancer (CRC) cases in the U.S., with a troubling rise in younger populations. Recent reports show analsyes for detecting genomic differences among sex-specific , age-specific and race-specific groups [2]. Understanding the sex-specificity, race-specificity and age-specificity of colon cancer can thus help avoiding the increase in the number of cases.
I revised transcriptome data of colon cancer from the GDC cancer portal, together with information about age, sex, race. Additionally, information about the tissue type (tumor versus normal) and tumor description (primary, premalignant, metastatic) were also used to study the data balance. In this brief report, I first organized the information about the number of cases per group. Second, I performed differential expression analysis and biomarker selection.
2. Methods
The cohort builder of GDC portal (https://portal.gdc.cancer.gov/) accessed on 28-04-2026 was used to obtain data from colon cancer cases (Cohort : Experimental Strategy=RNA-Seq, Data Format=tsv, Data Type=Gene Expression Quantification, Data Category=transcriptome profiling, Platform=illumina, Tissue or Organ of Origin=colon, nos). RNA-seq data only were downloaded. Among the 474 samples, 19 and 455 were from normal and tumor tissue types, respectively. A github account with data and scripts to reproduce the results was made available at: https://github.com/datasciencebioinformatics/BiomarkerIdentification_ColonCancer
3. Results
3.1 Informative variables
The percentage of samples with complete data was calculated and it was found that for the age variable (demographic.age_at_index) approximately 38.18% of the samples only contain the value for the variable. For all other variables, 100% completeness was noted (See Figure 1).
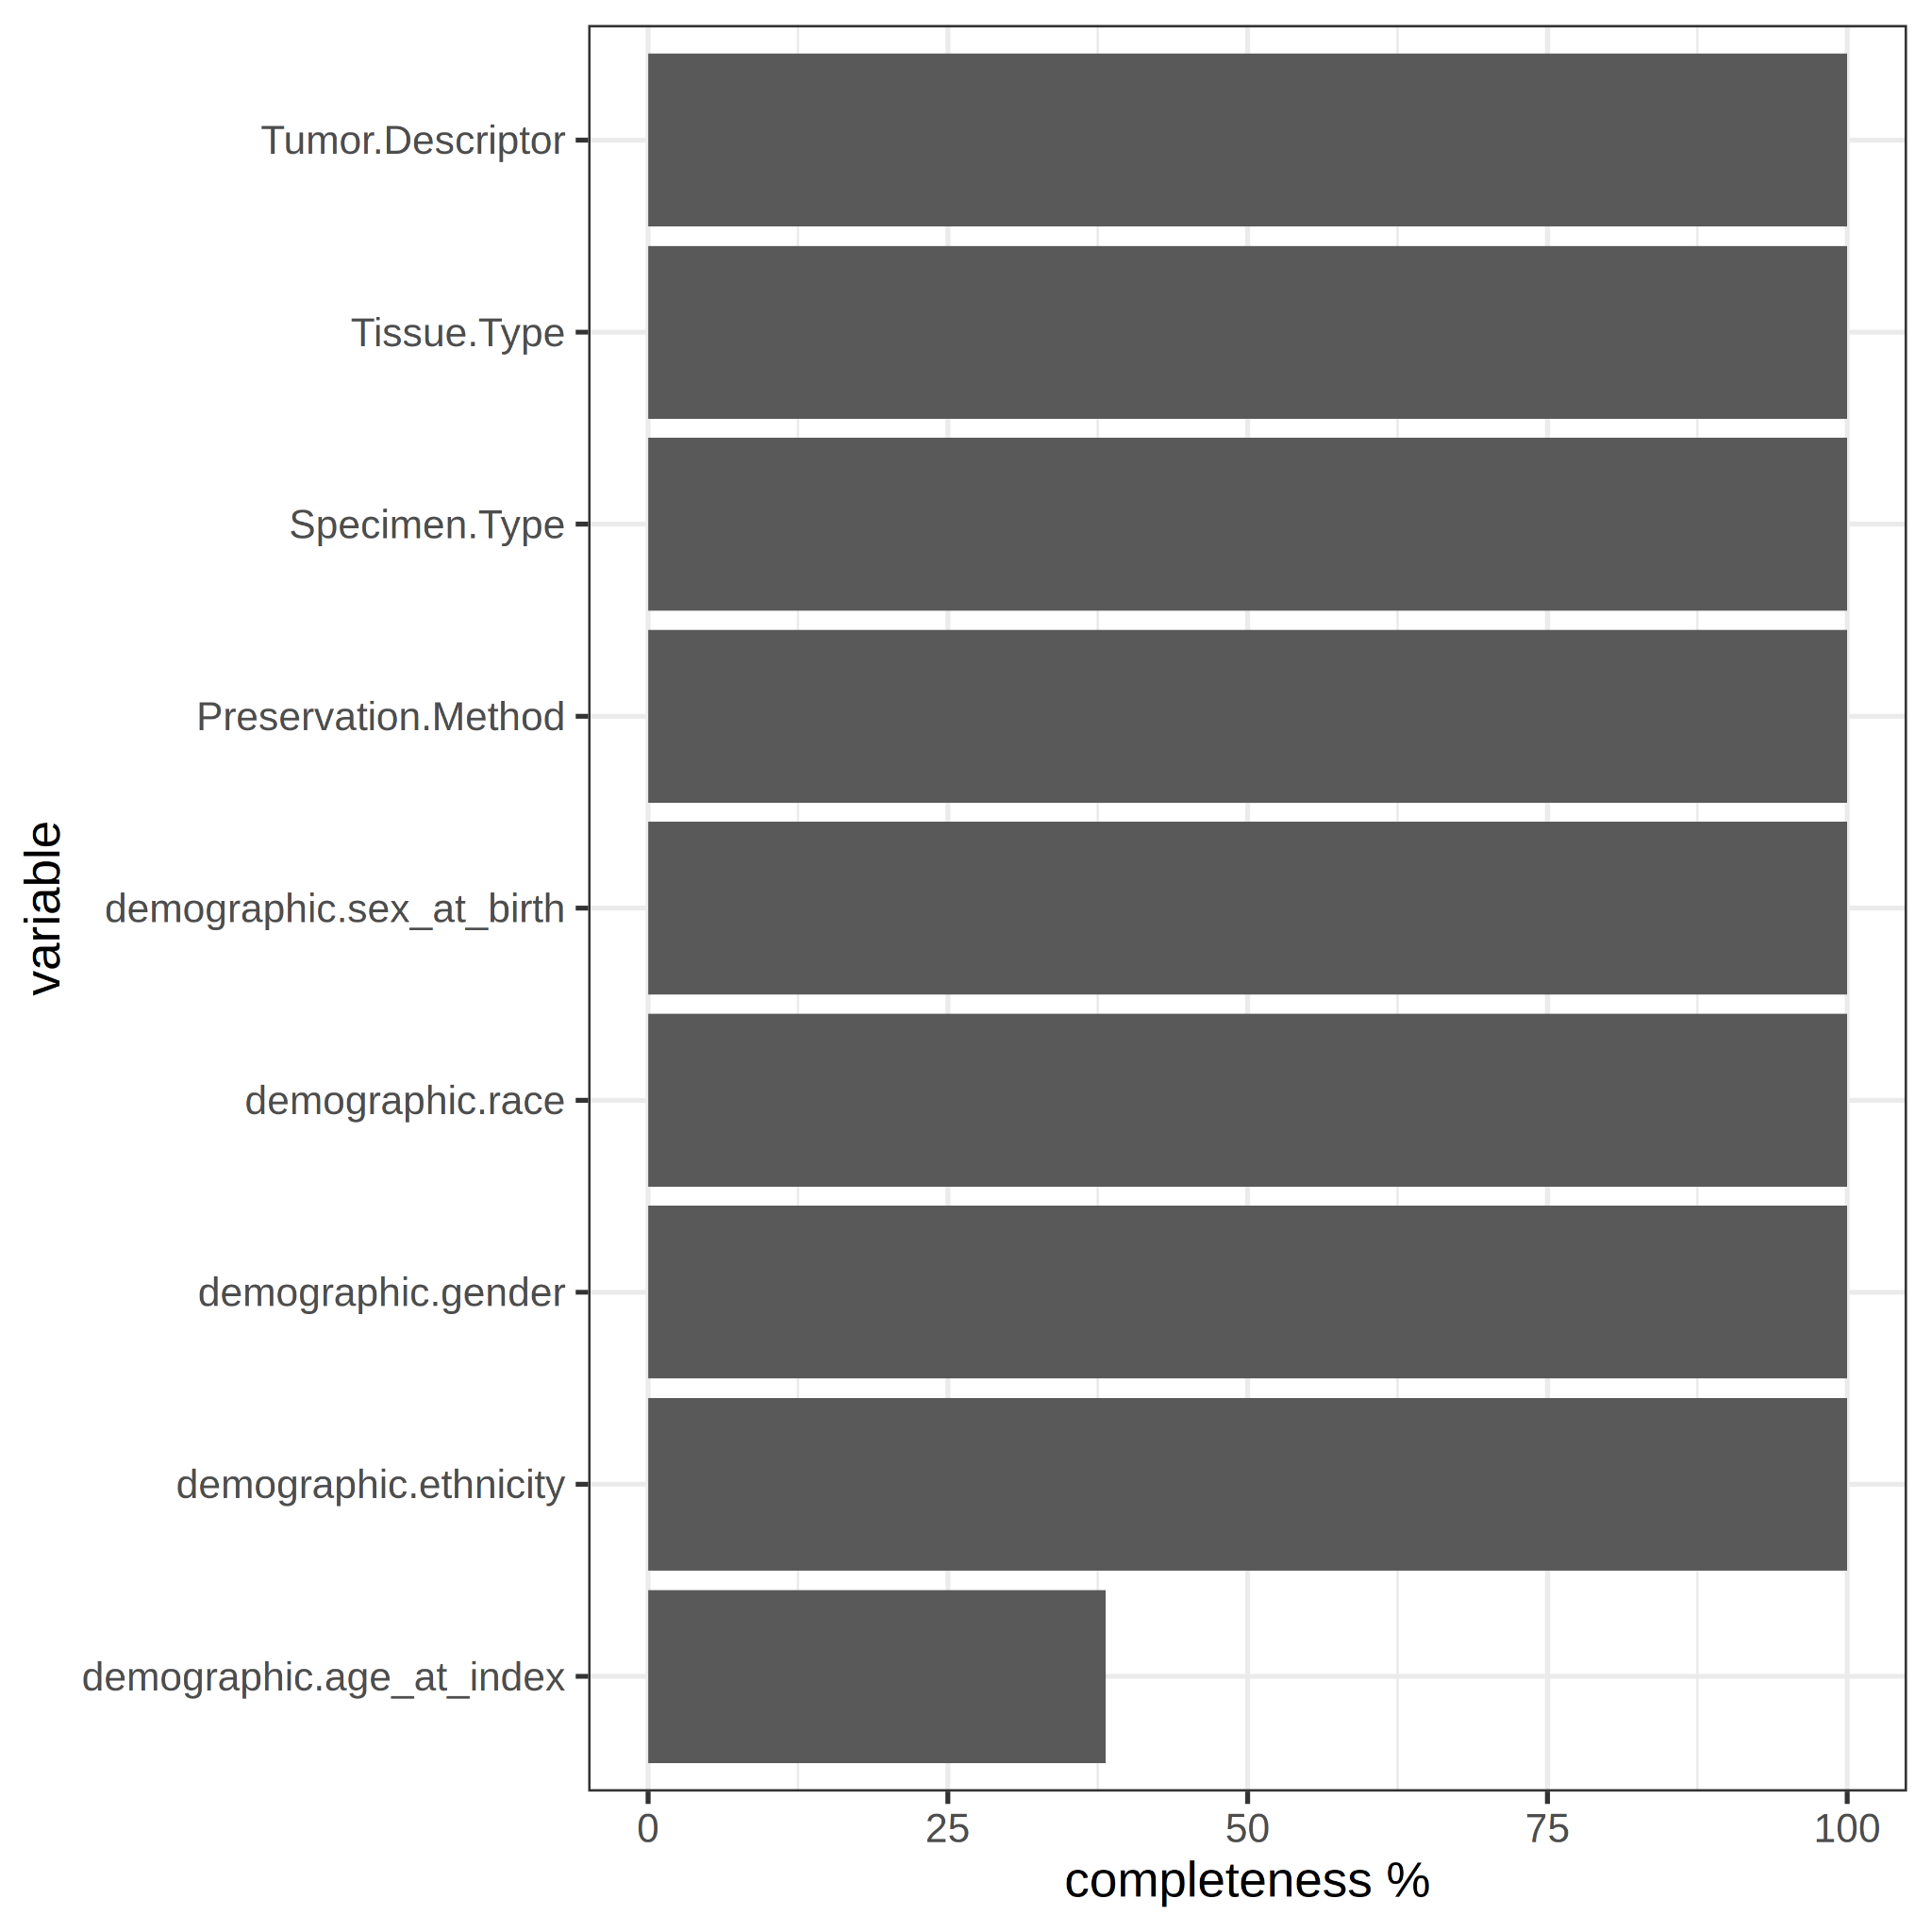
Figure 1. Variable completeness. Percentage of the samples that contains value for each variable.
3.2 Data balance
The data balance was analyzed in relation to the number of samples per sex-specific, race-specific, and age-specific group. First, it was observed that there are more tumor-type samples (n=455) than normal-type samples (n=19). Secondly, the count was performed by sex group, where the proportions appear to be maintained between male (Male-Tumor n = 244, Male-Normal n = 9) and female (Female-Tumor n = 211, Female-Normal n = 10). It can then be concluded that for both sexes the sample size is sufficient to perform sex-specific DE analysis (Figure 2).
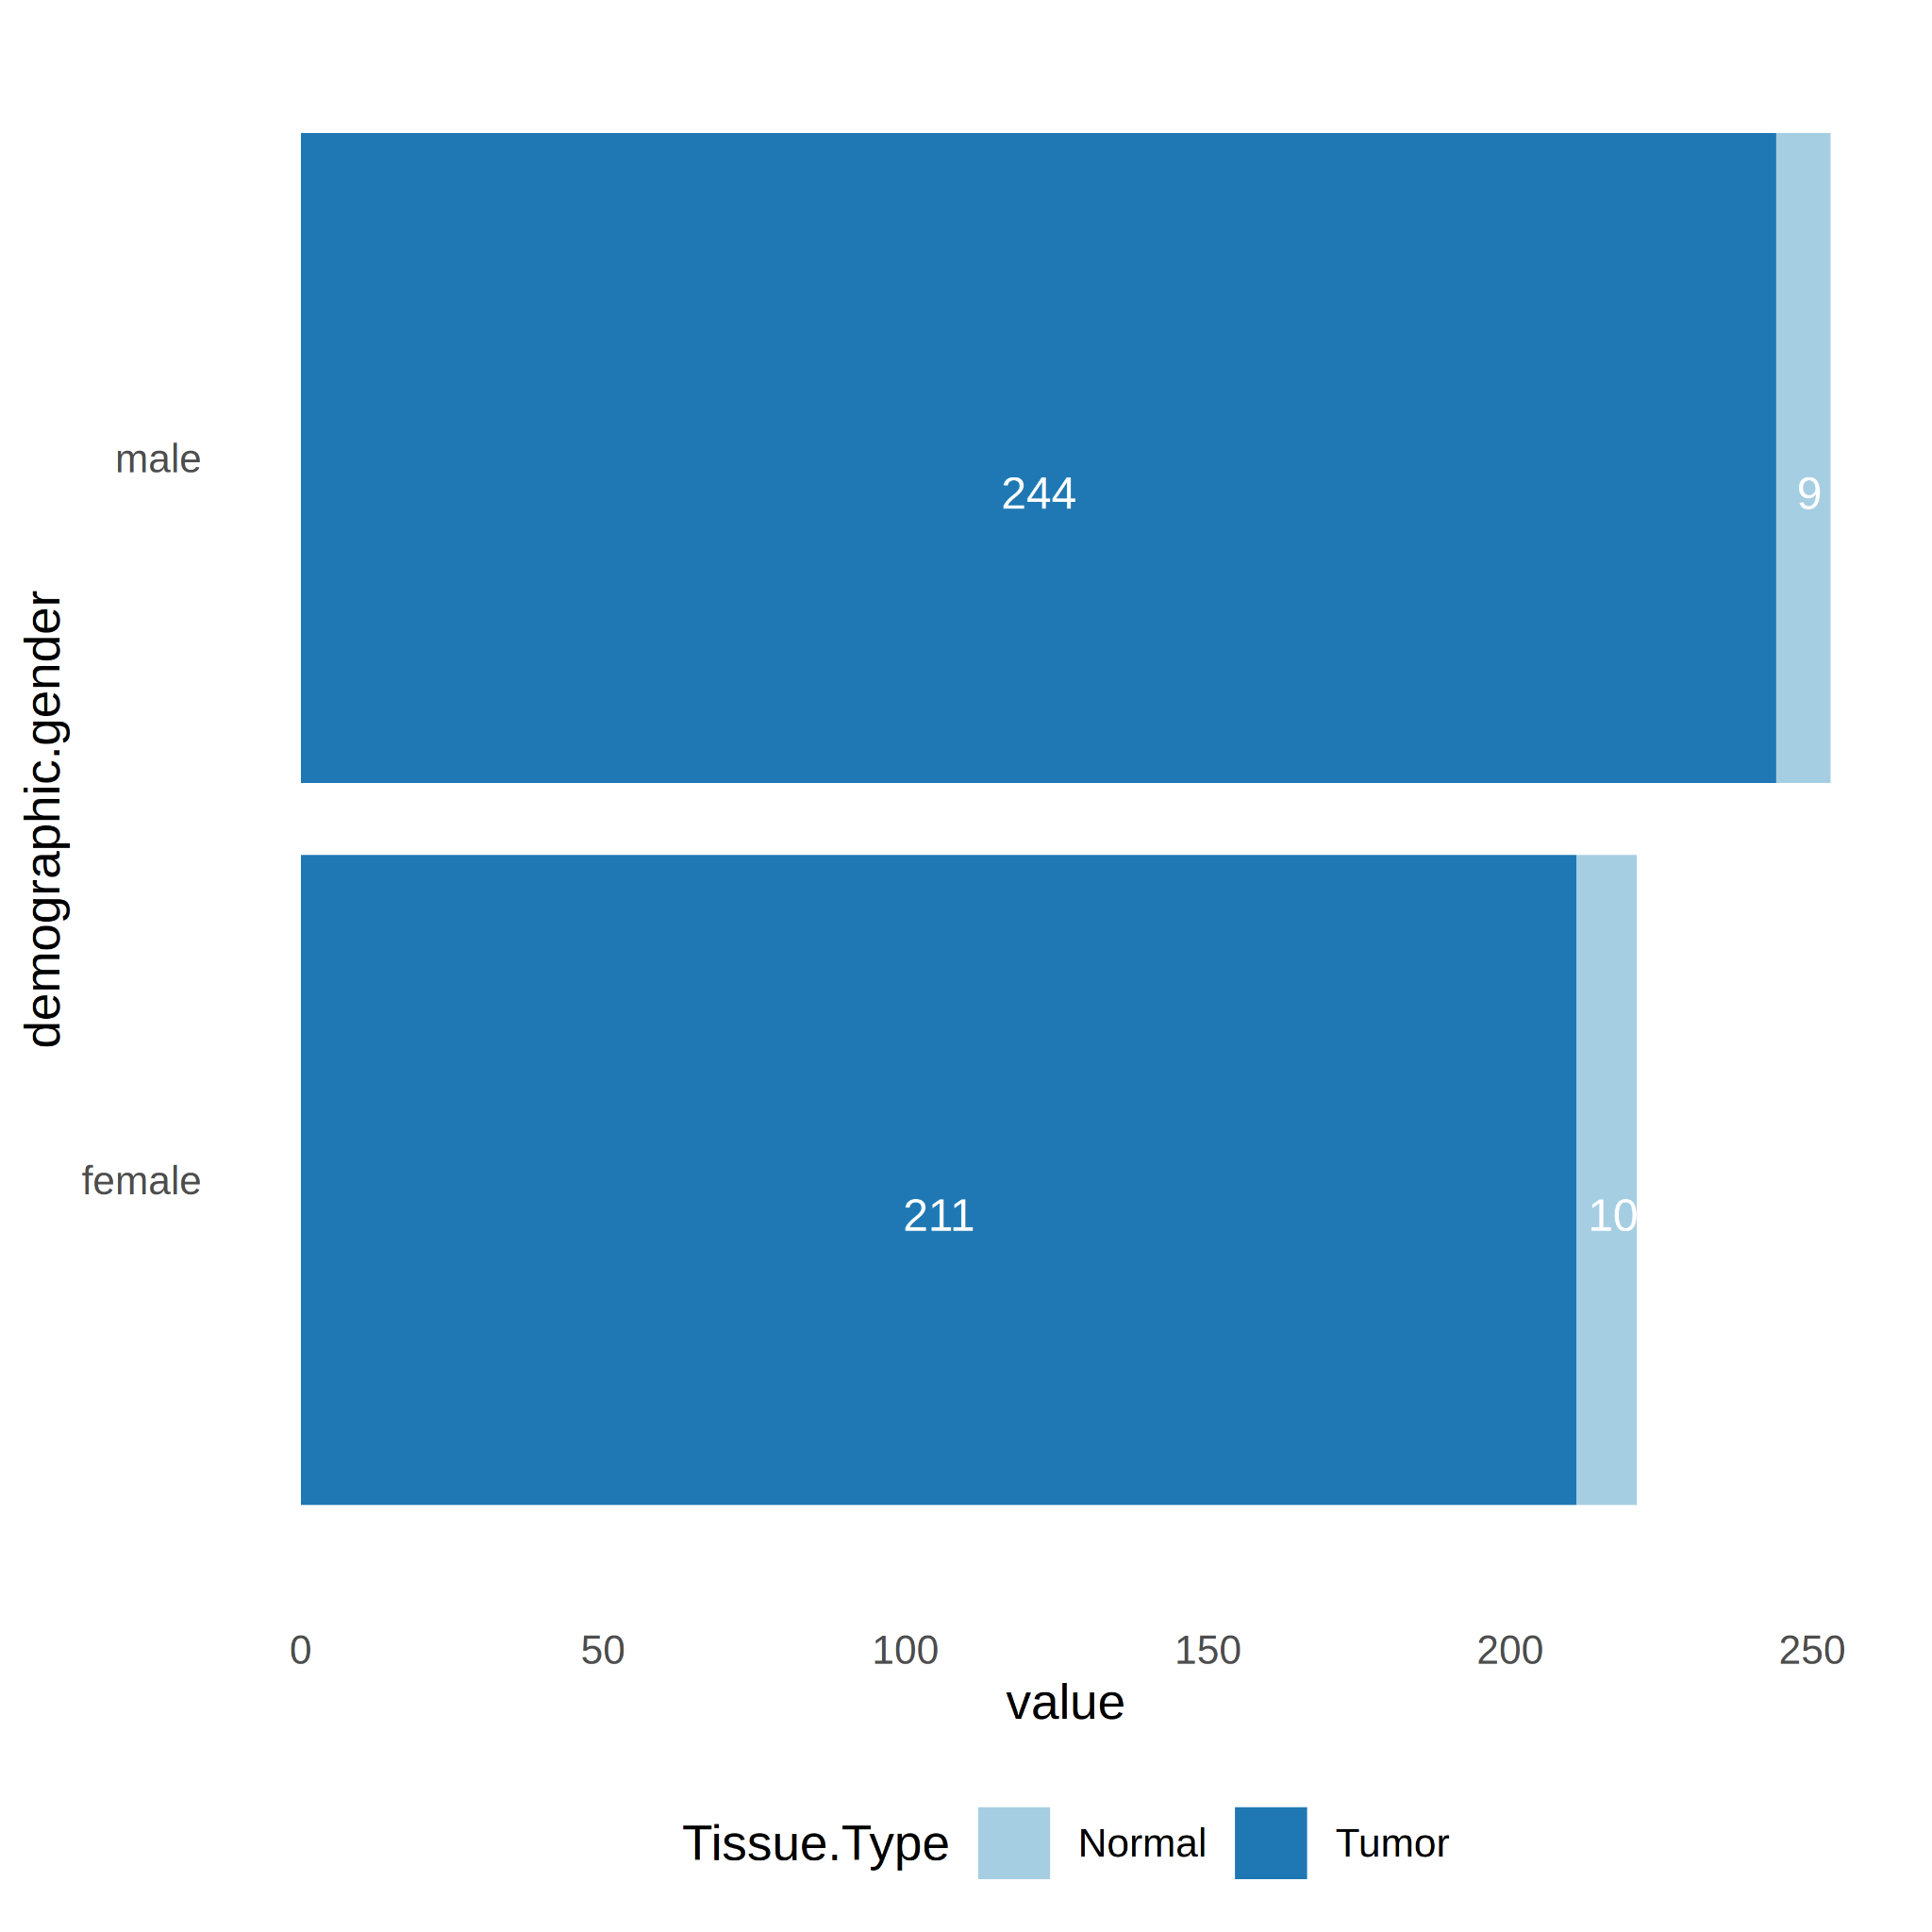
Figure 2. Number of samples per tissue type (Tumor vs. Normal) and gender (Male vs. Female).
Thirdly, sample counts by race show that only for the white race there is a minimum number of counts ≥ 3 in the normal tissue type group (n=7). Therefore, only for race “while” there is the possibility to perform race-specific DE analysis (Figure 3).
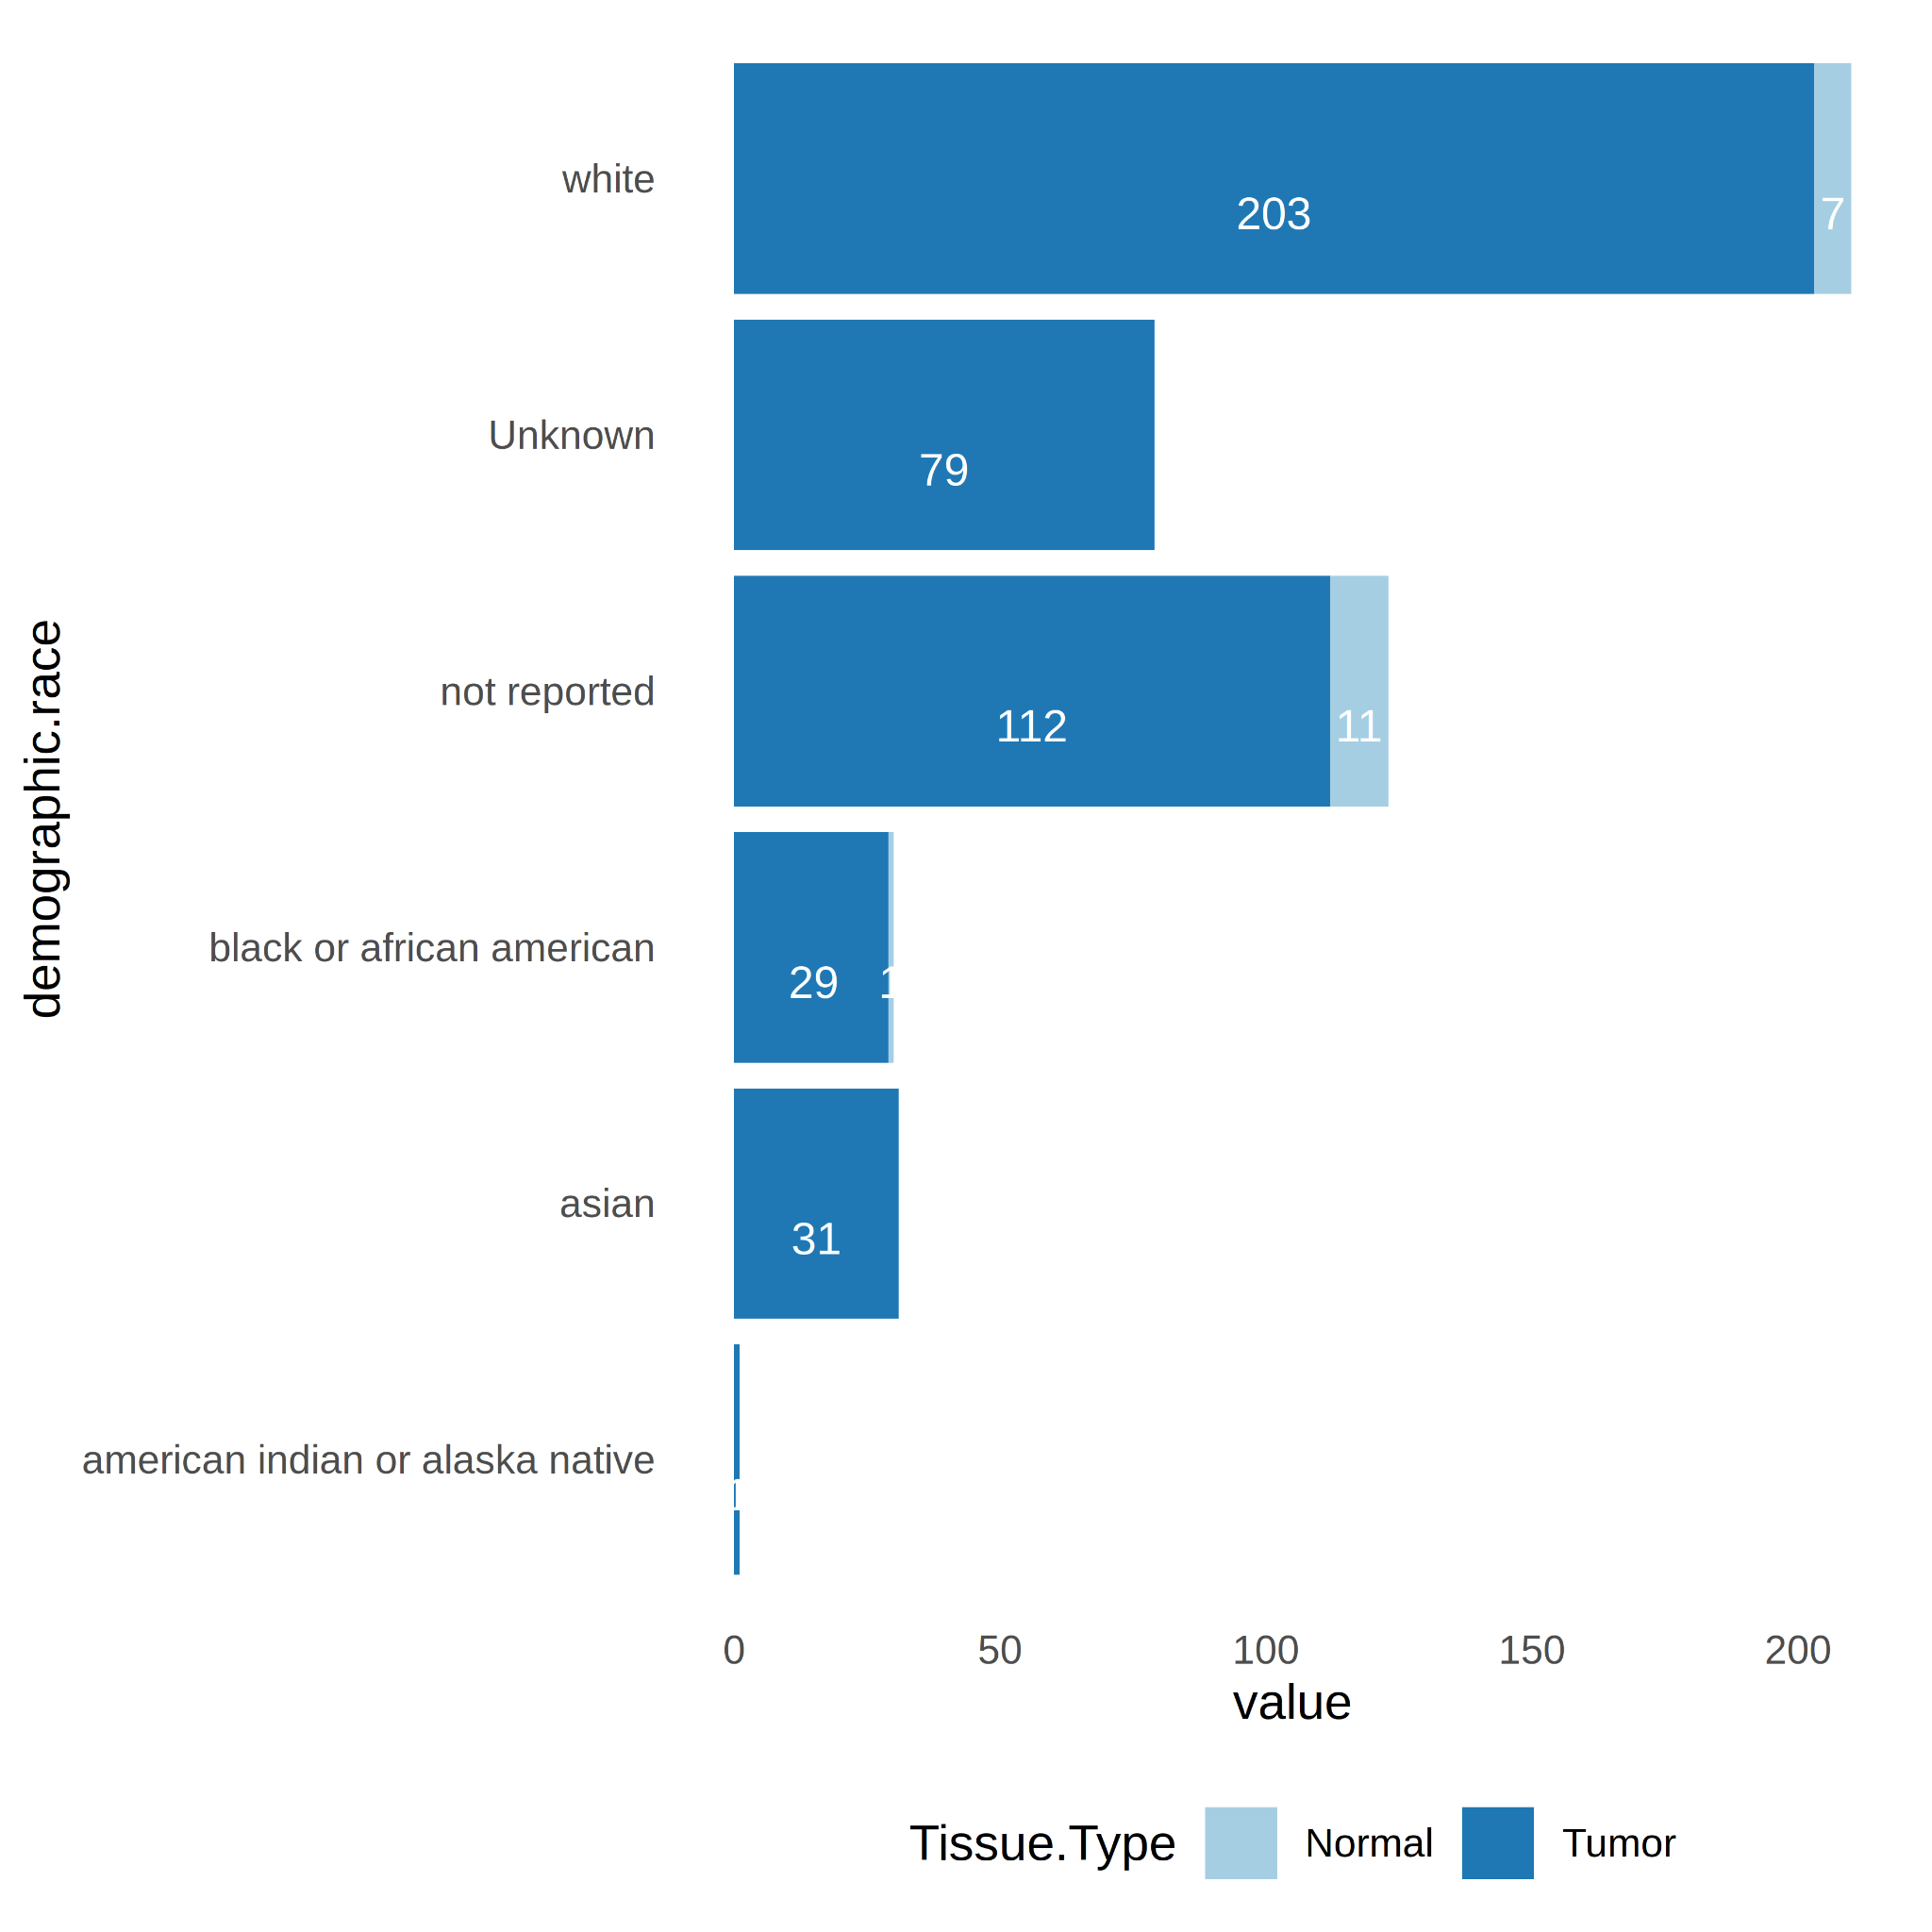
Figure 3. Number of samples per tissue type (Tumor vs. Normal) and race ("black or african american", "white", "asian", "not reported", "american indian or alaska native", "Unknown").
Fourthly, the counts of samples per age group was calculated. It can questioned whether there is a decrease in the number of cancer cases after a very advanced age due to reduced exposure to carcinogens. The age ranges with a sample size ≥ 3 in both tumor and normal are 60-69 (Tumor n=43, Normal=4), 70-79 (Tumor n=51, Normal=5) and 80-89 (Tumor n=33, Normal=6) (Figure 4). For these age groups, it is possible to perform specific differential analyses for each age.
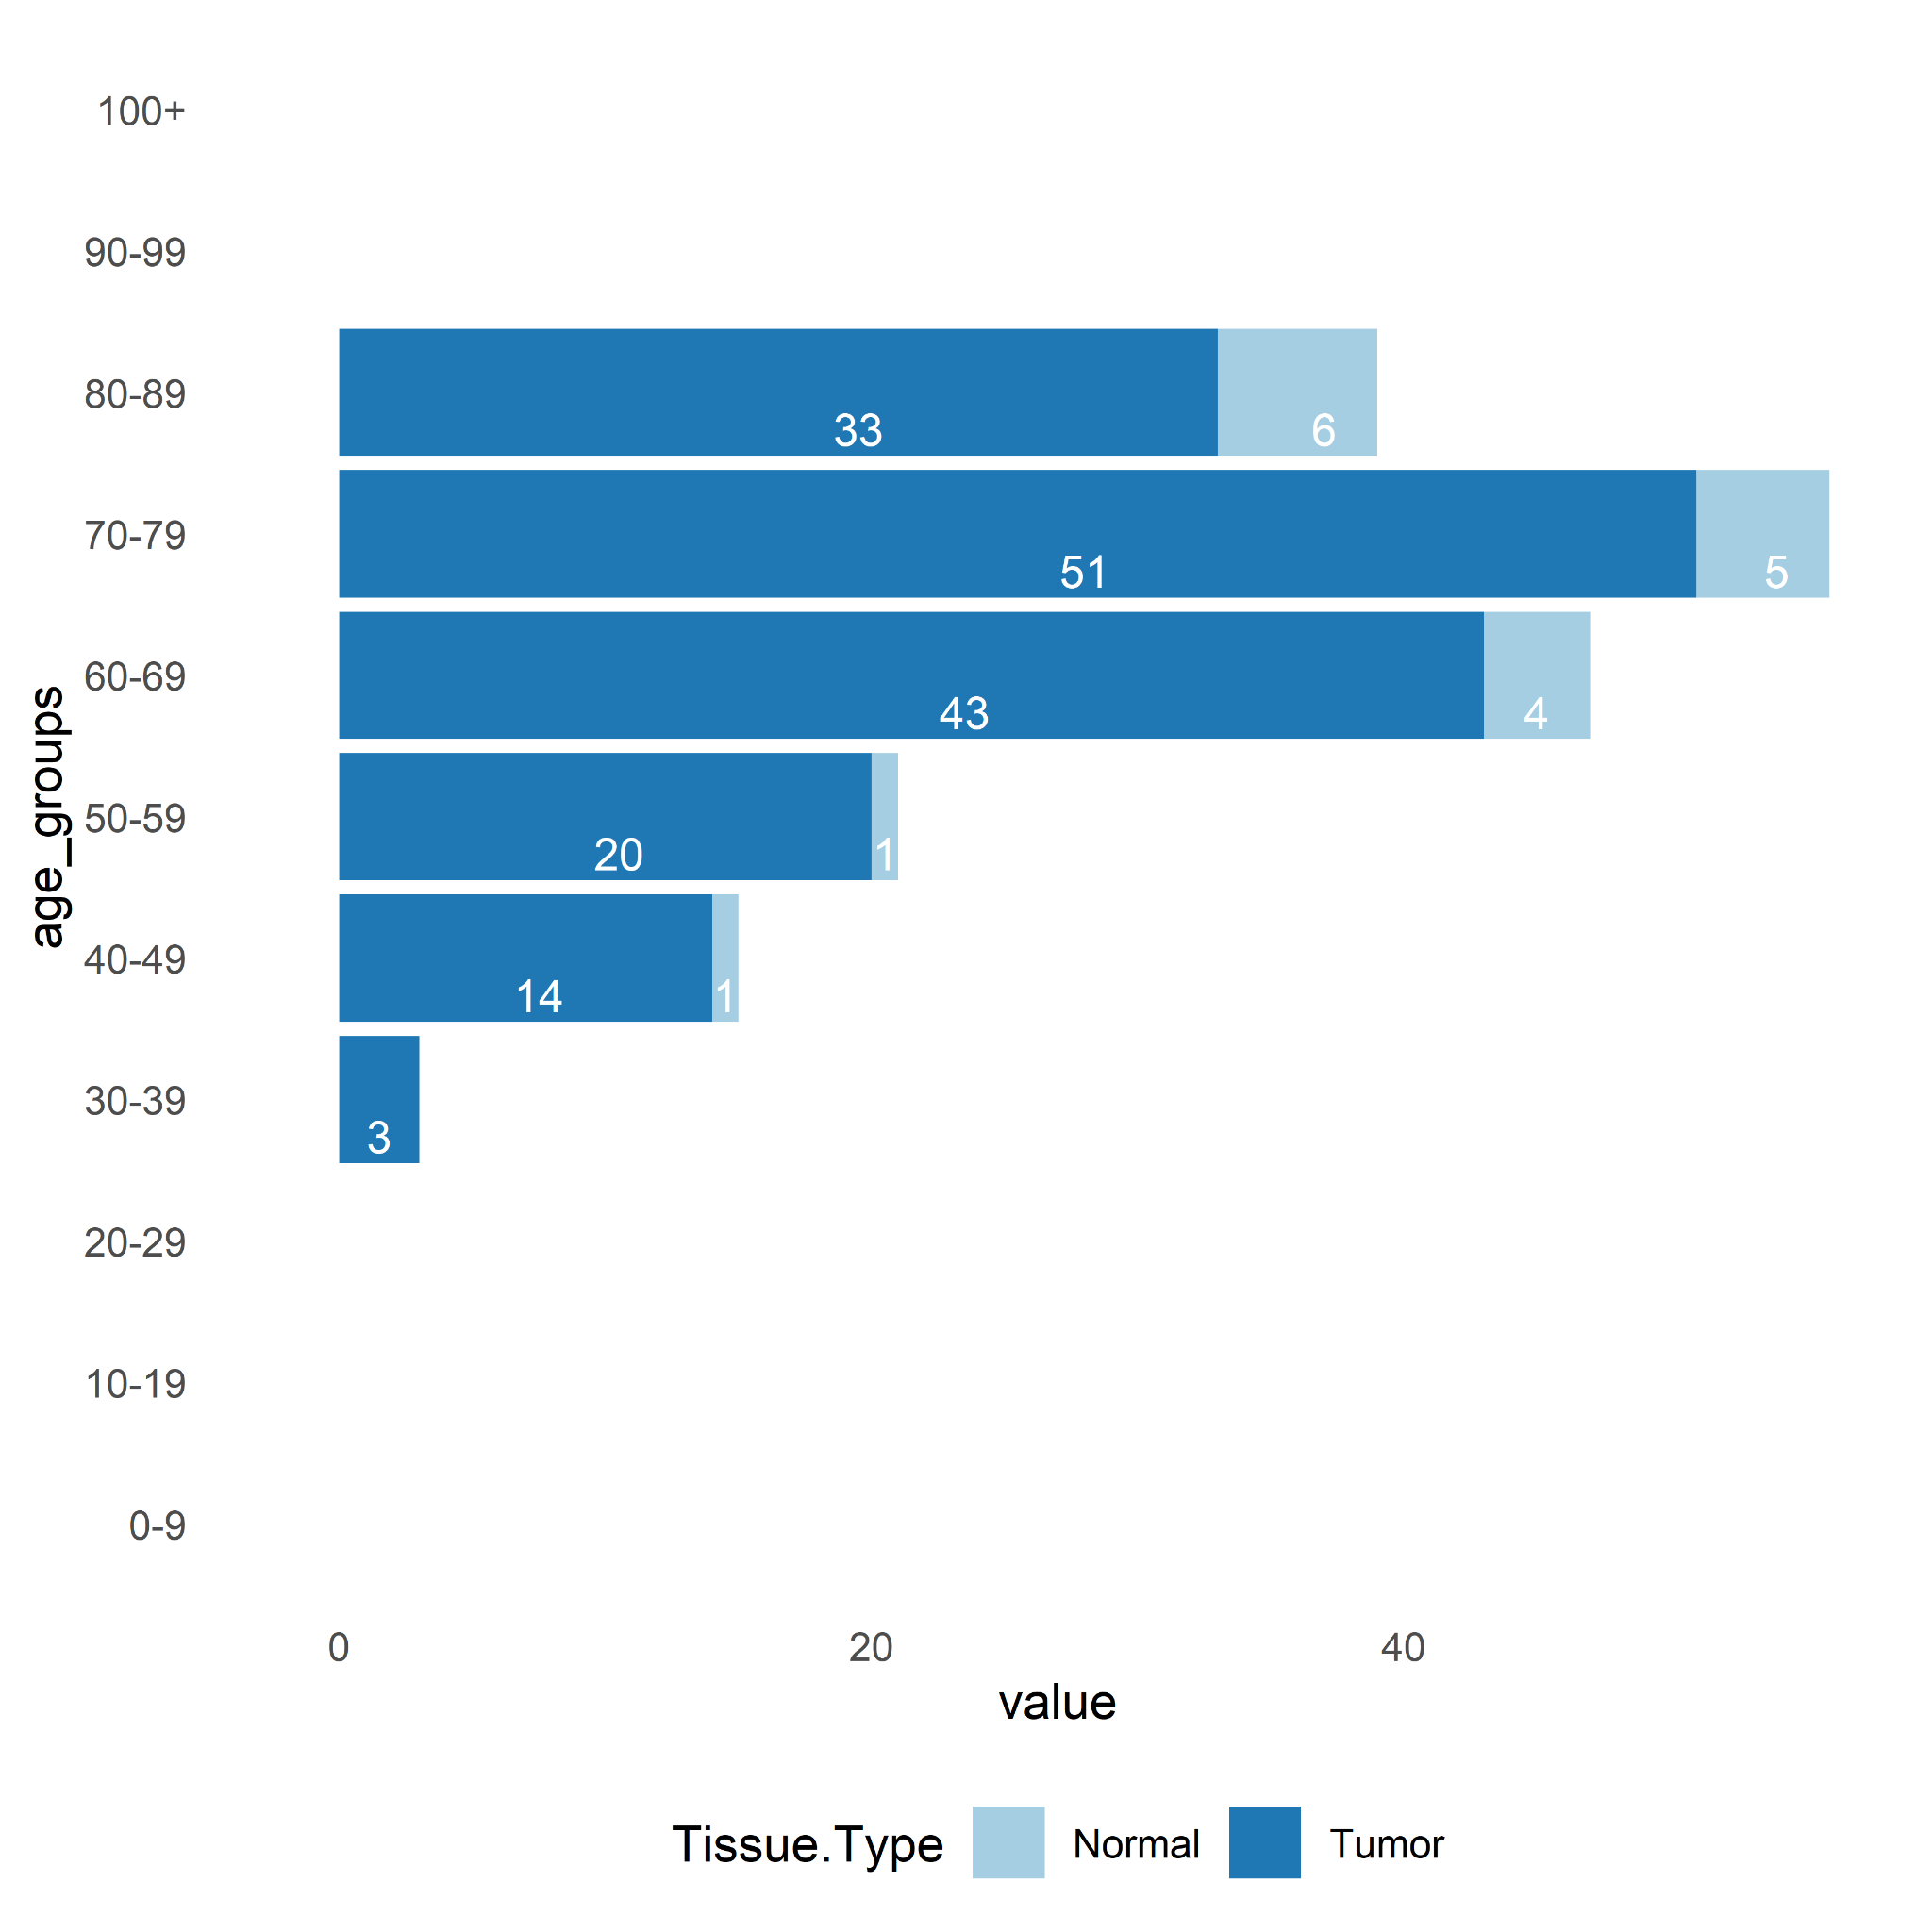
Figure 4. Number of samples per age group (0-9, 10-19, 20-29, 30-39, 40-49, 50-59, 60-69, 70-79, 80-89, 90-99, 100+).
In the case of the tumor descriptor variable (Tumor.Descriptor), it is worth noting that there is a sufficient number of samples n ≥ 3 to perform DE analysis among all of each group (primary, premalignant, metastatic) and the control (Normal samples) (Figure 5).
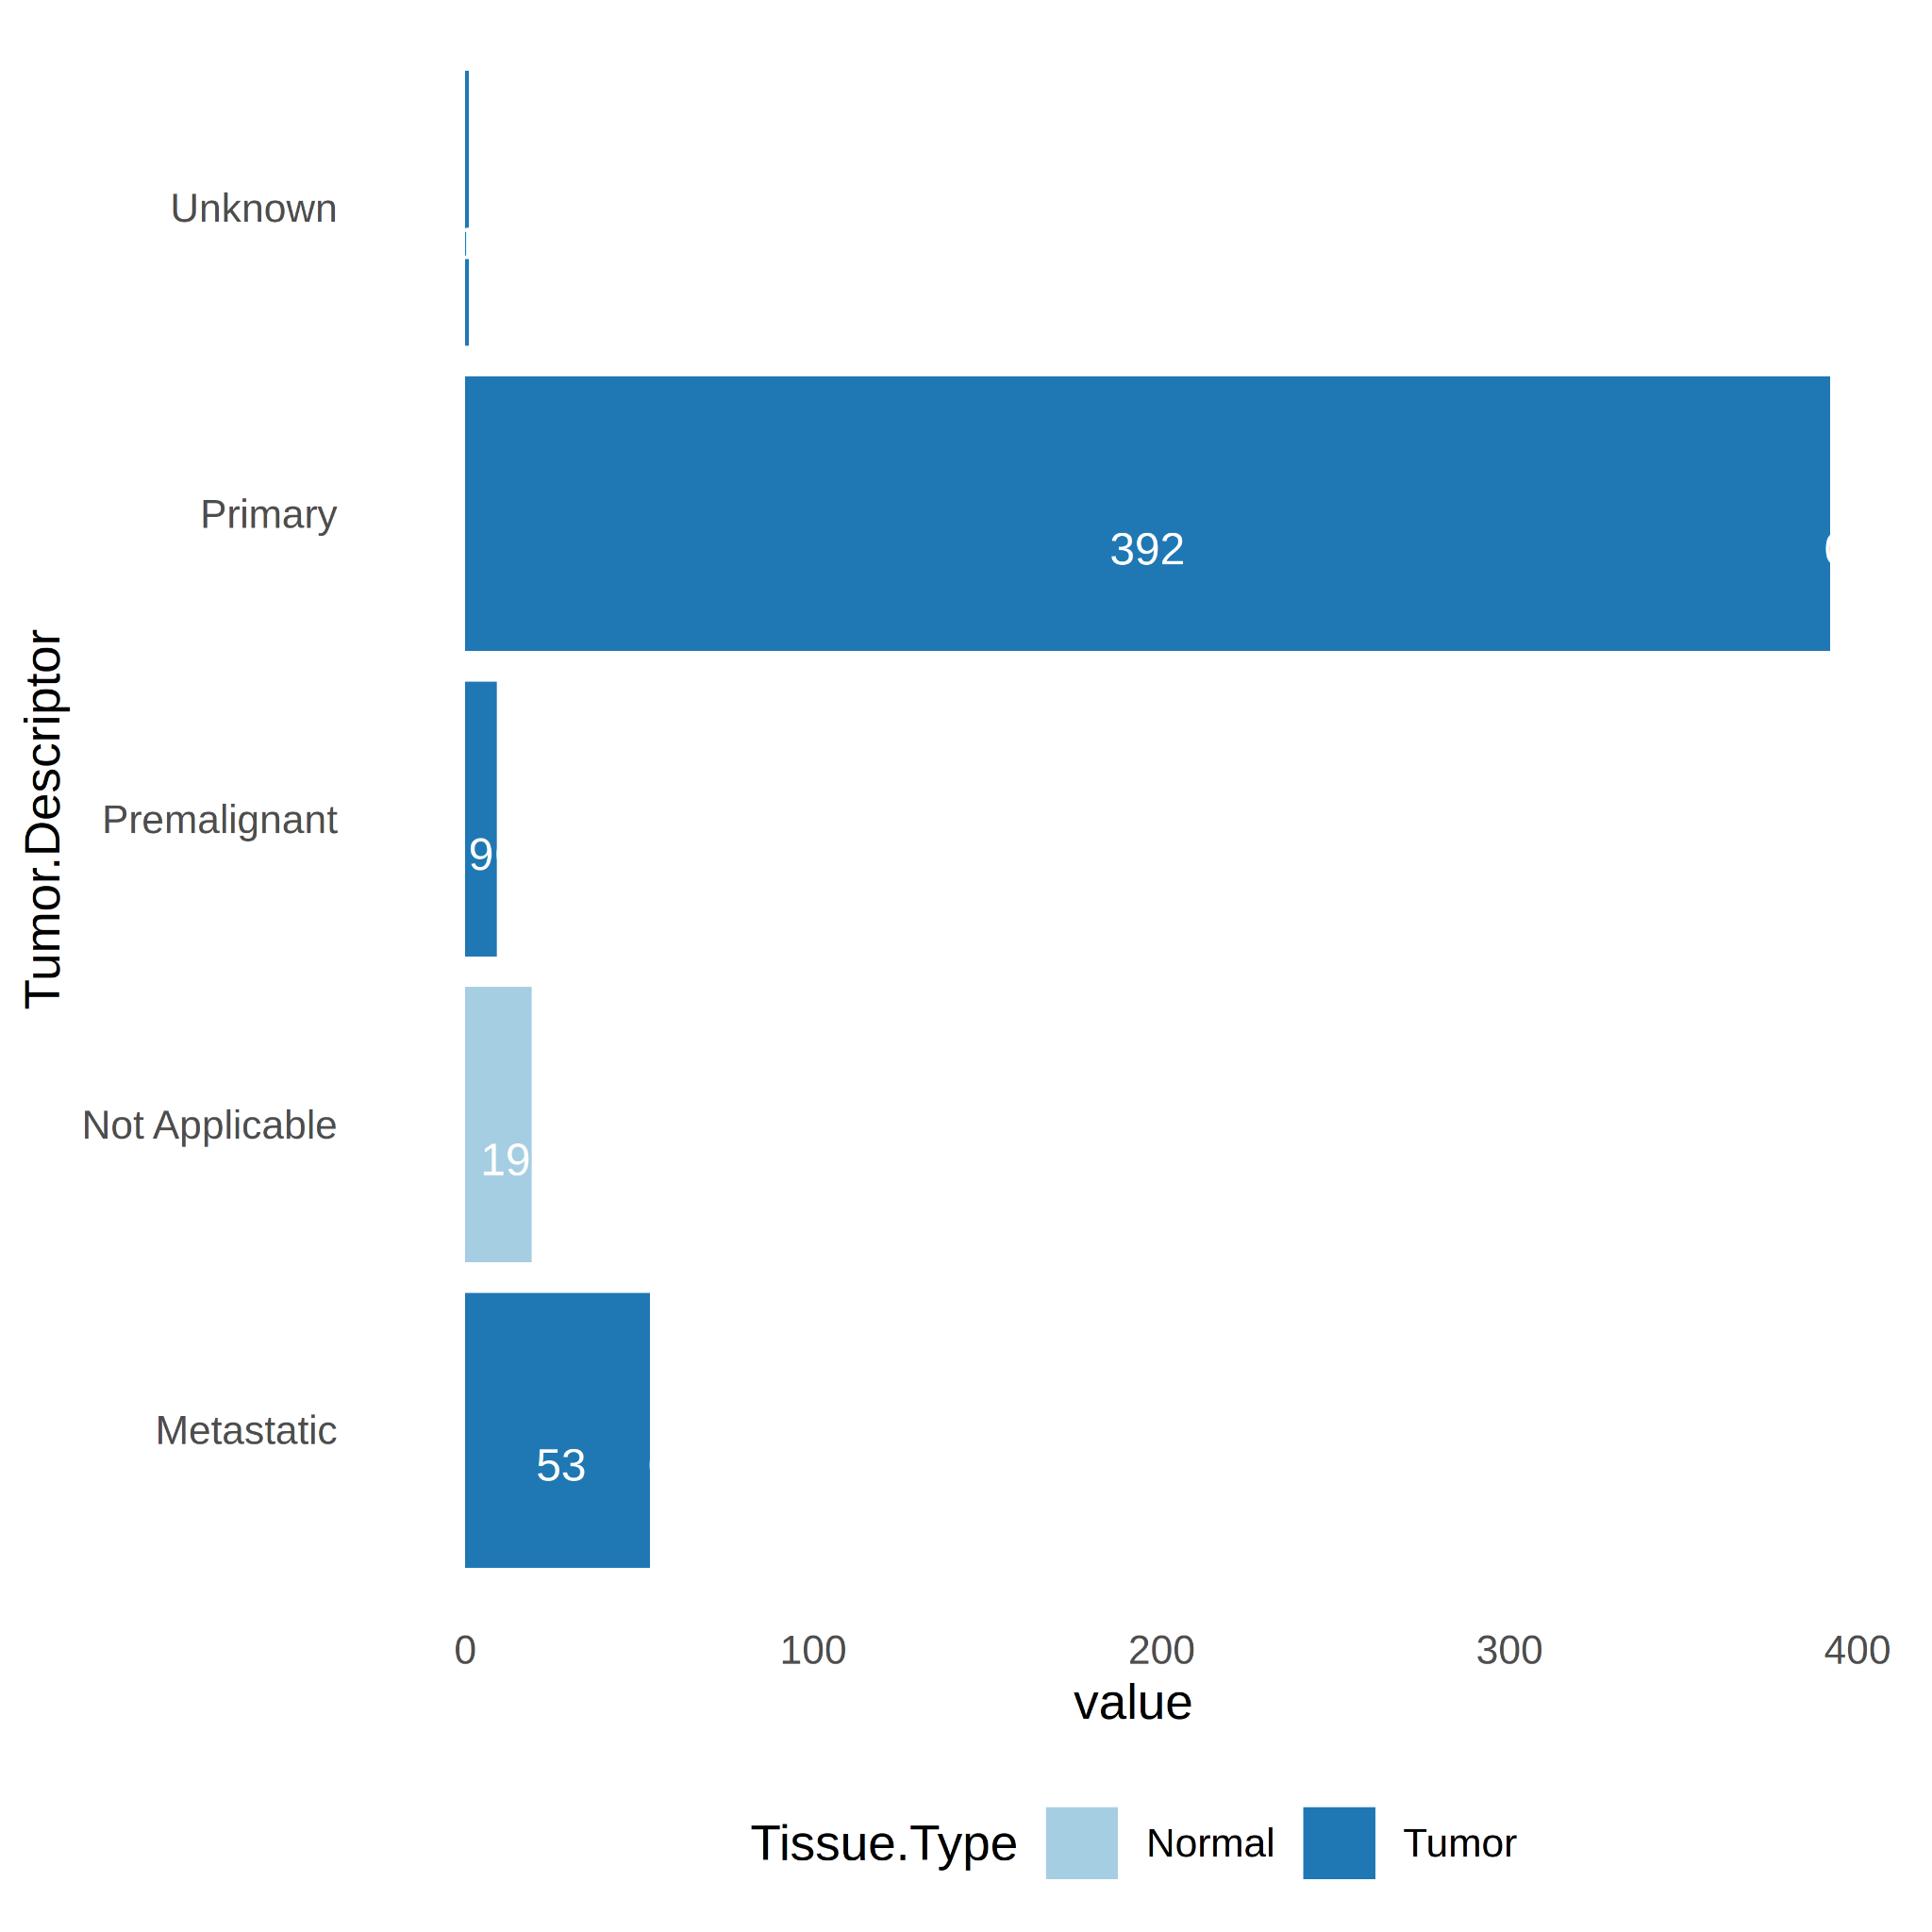
Figure 5. Number of samples per Tumor.Descriptor (primary, premalignant, metastatic).
3.3 Tumor Genes
As reference, I identified differentially expressed genes (DEG’s) among all tumor versus all normal samples (tumor_genes) with log2FC ≥3.0 and padj ≤ 0.05 (see Supplemental Table S1). 7026 DE tumor genes were identified. From these, the Principal Component Analysis (PCA) plot shows good separation of tumor versus normal samples, with 41% and 7% variance explained by PC1 and PC2, respectively (see Figure 6).
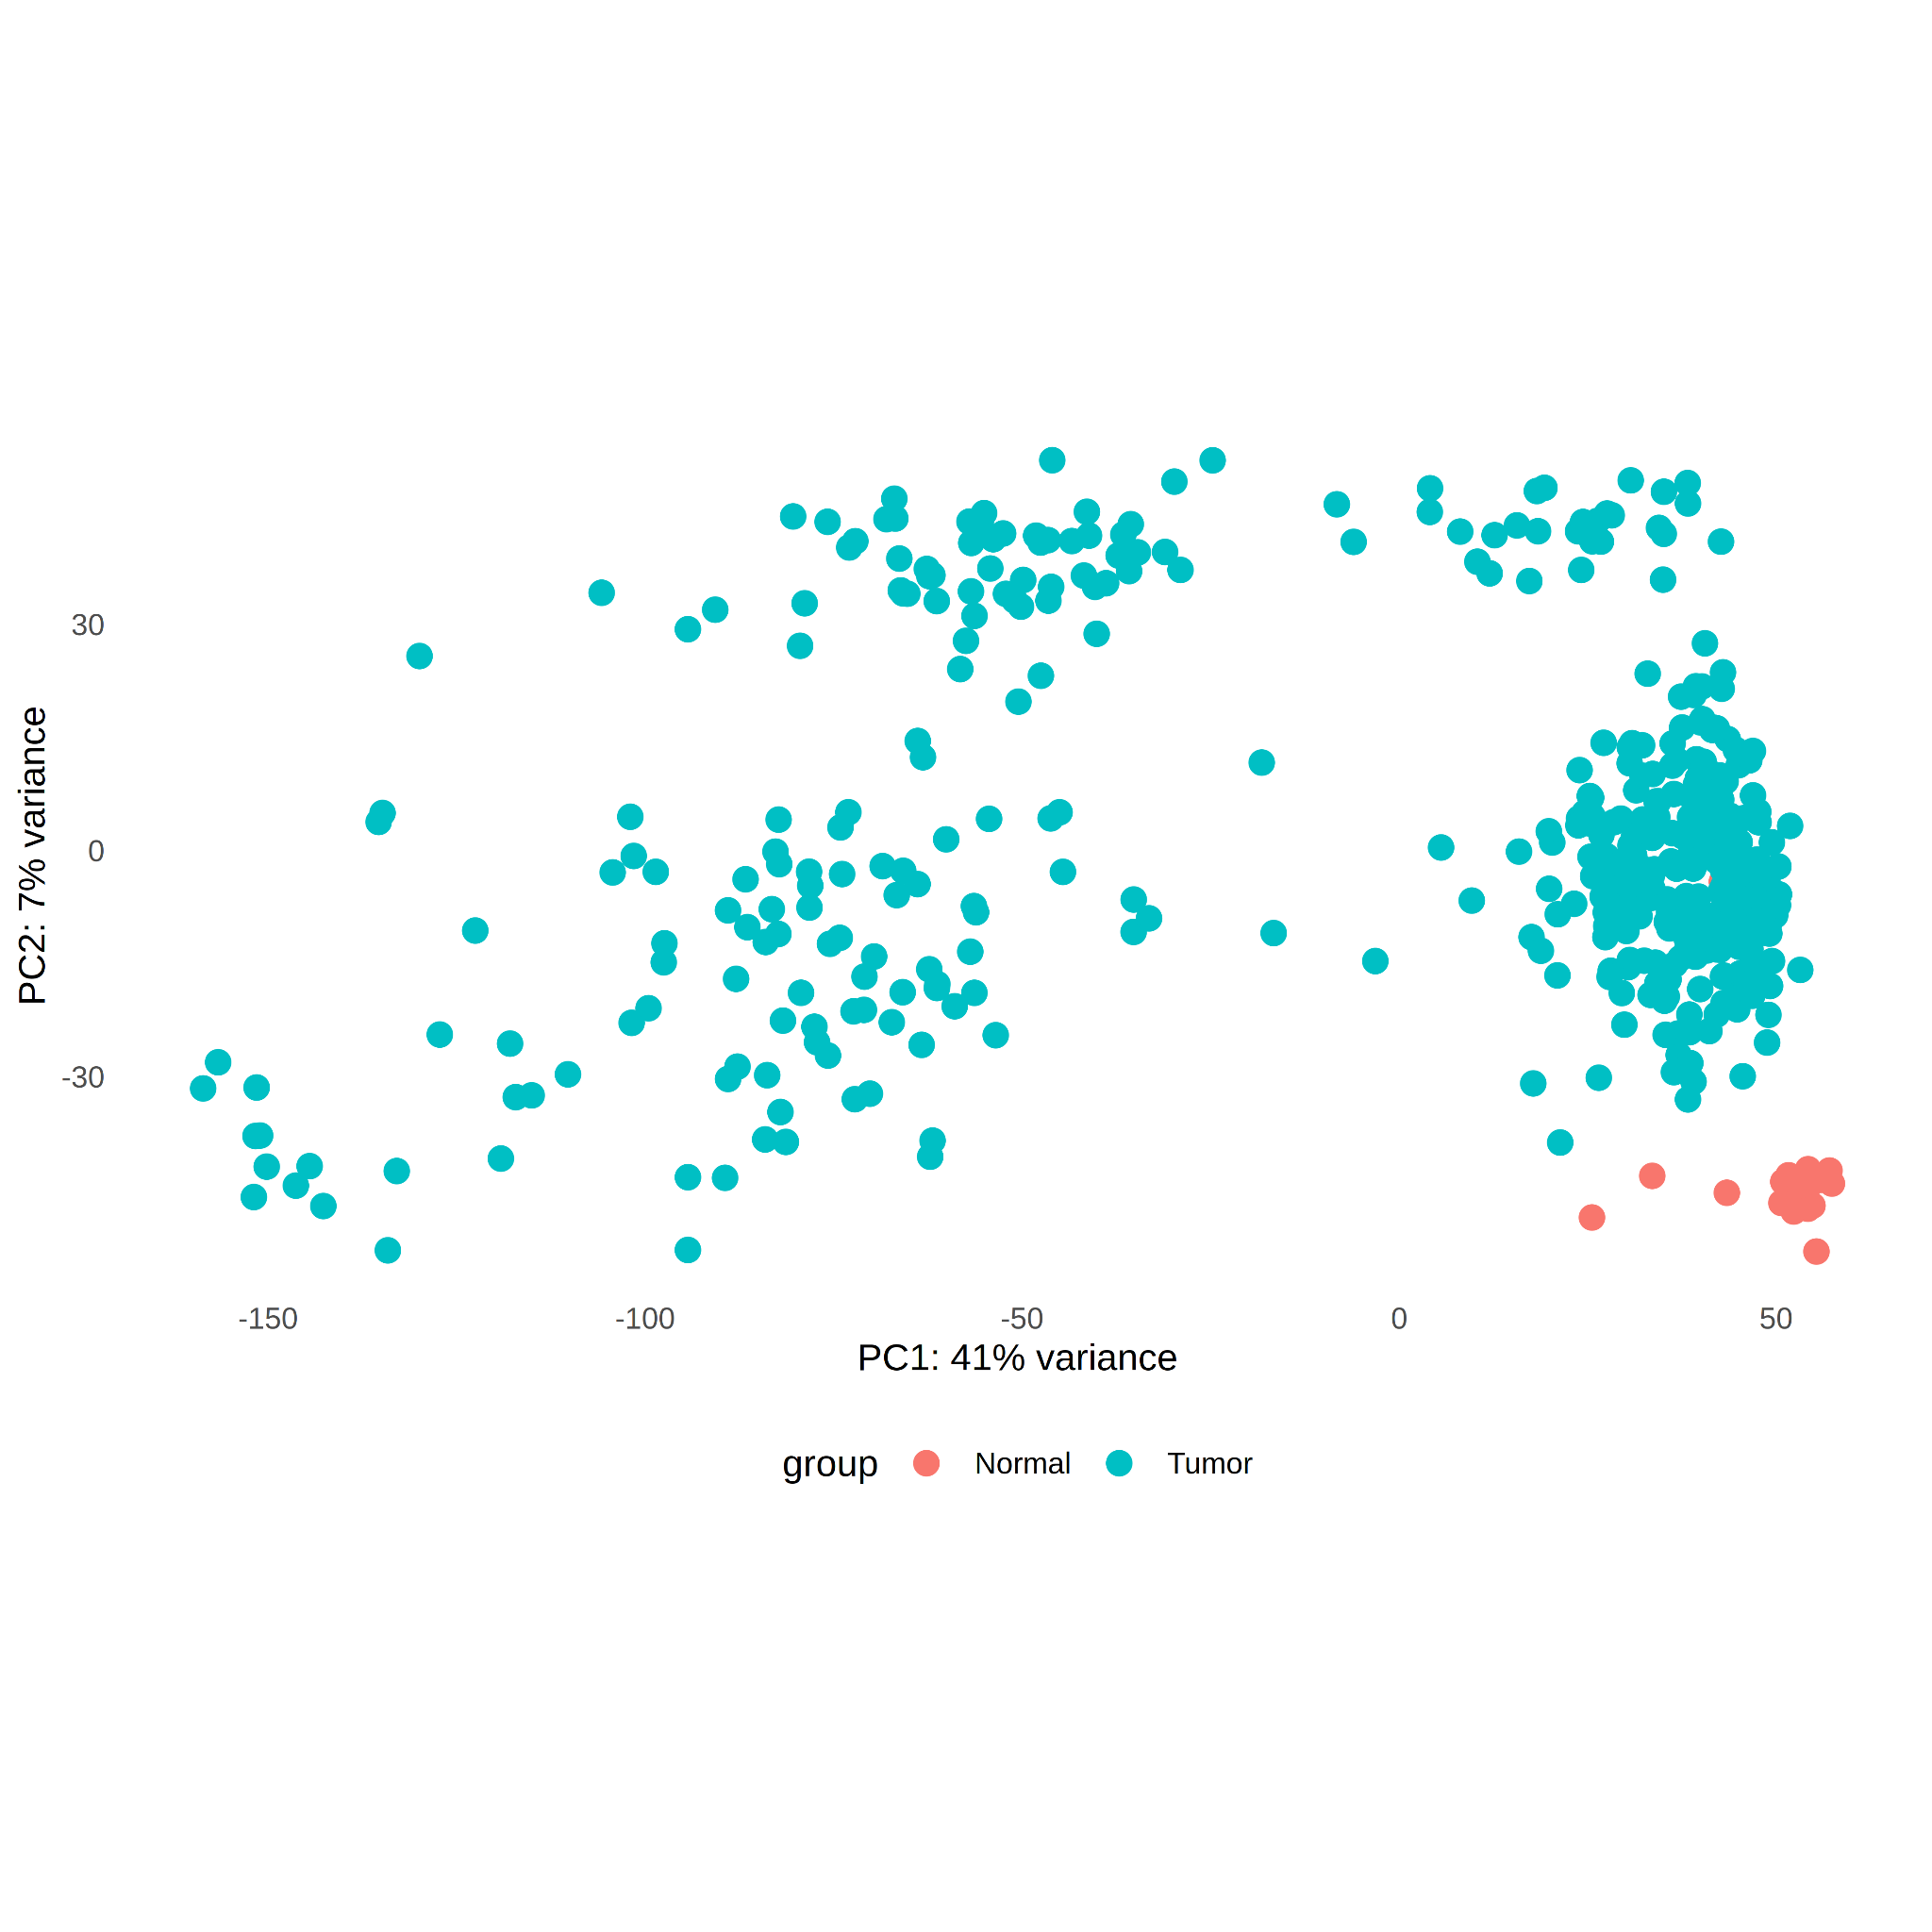
Figure 6. PCA plot of RNA-seq samples with DEGs for tumor and normal samples. DE threshold log2FC ≥3.0 and padj ≤ 0.05.
3.4 (primary-metastic-premalignat)-specific genes
A DE analysis was performed for each tumor descriptor group (primary, premalignant, metastatic) versus the control group (log2FC ≥3.0 and padj ≤ 0.05). For reference, tumor_genes was added to the Veen diagram along with the DE list for each comparison (Figure 7). It is interesting to note a large number of genes at the intersection between tumor_genes and all tumor-descriptor groups (32%, 4391 genes). It is also worth highlighting the number of genes specific to the metastatic group (26%, 3609 genes) and premalignant group (12%, 1663 genes). The lists of genes for this comparisson is in Supplemental Table S2.
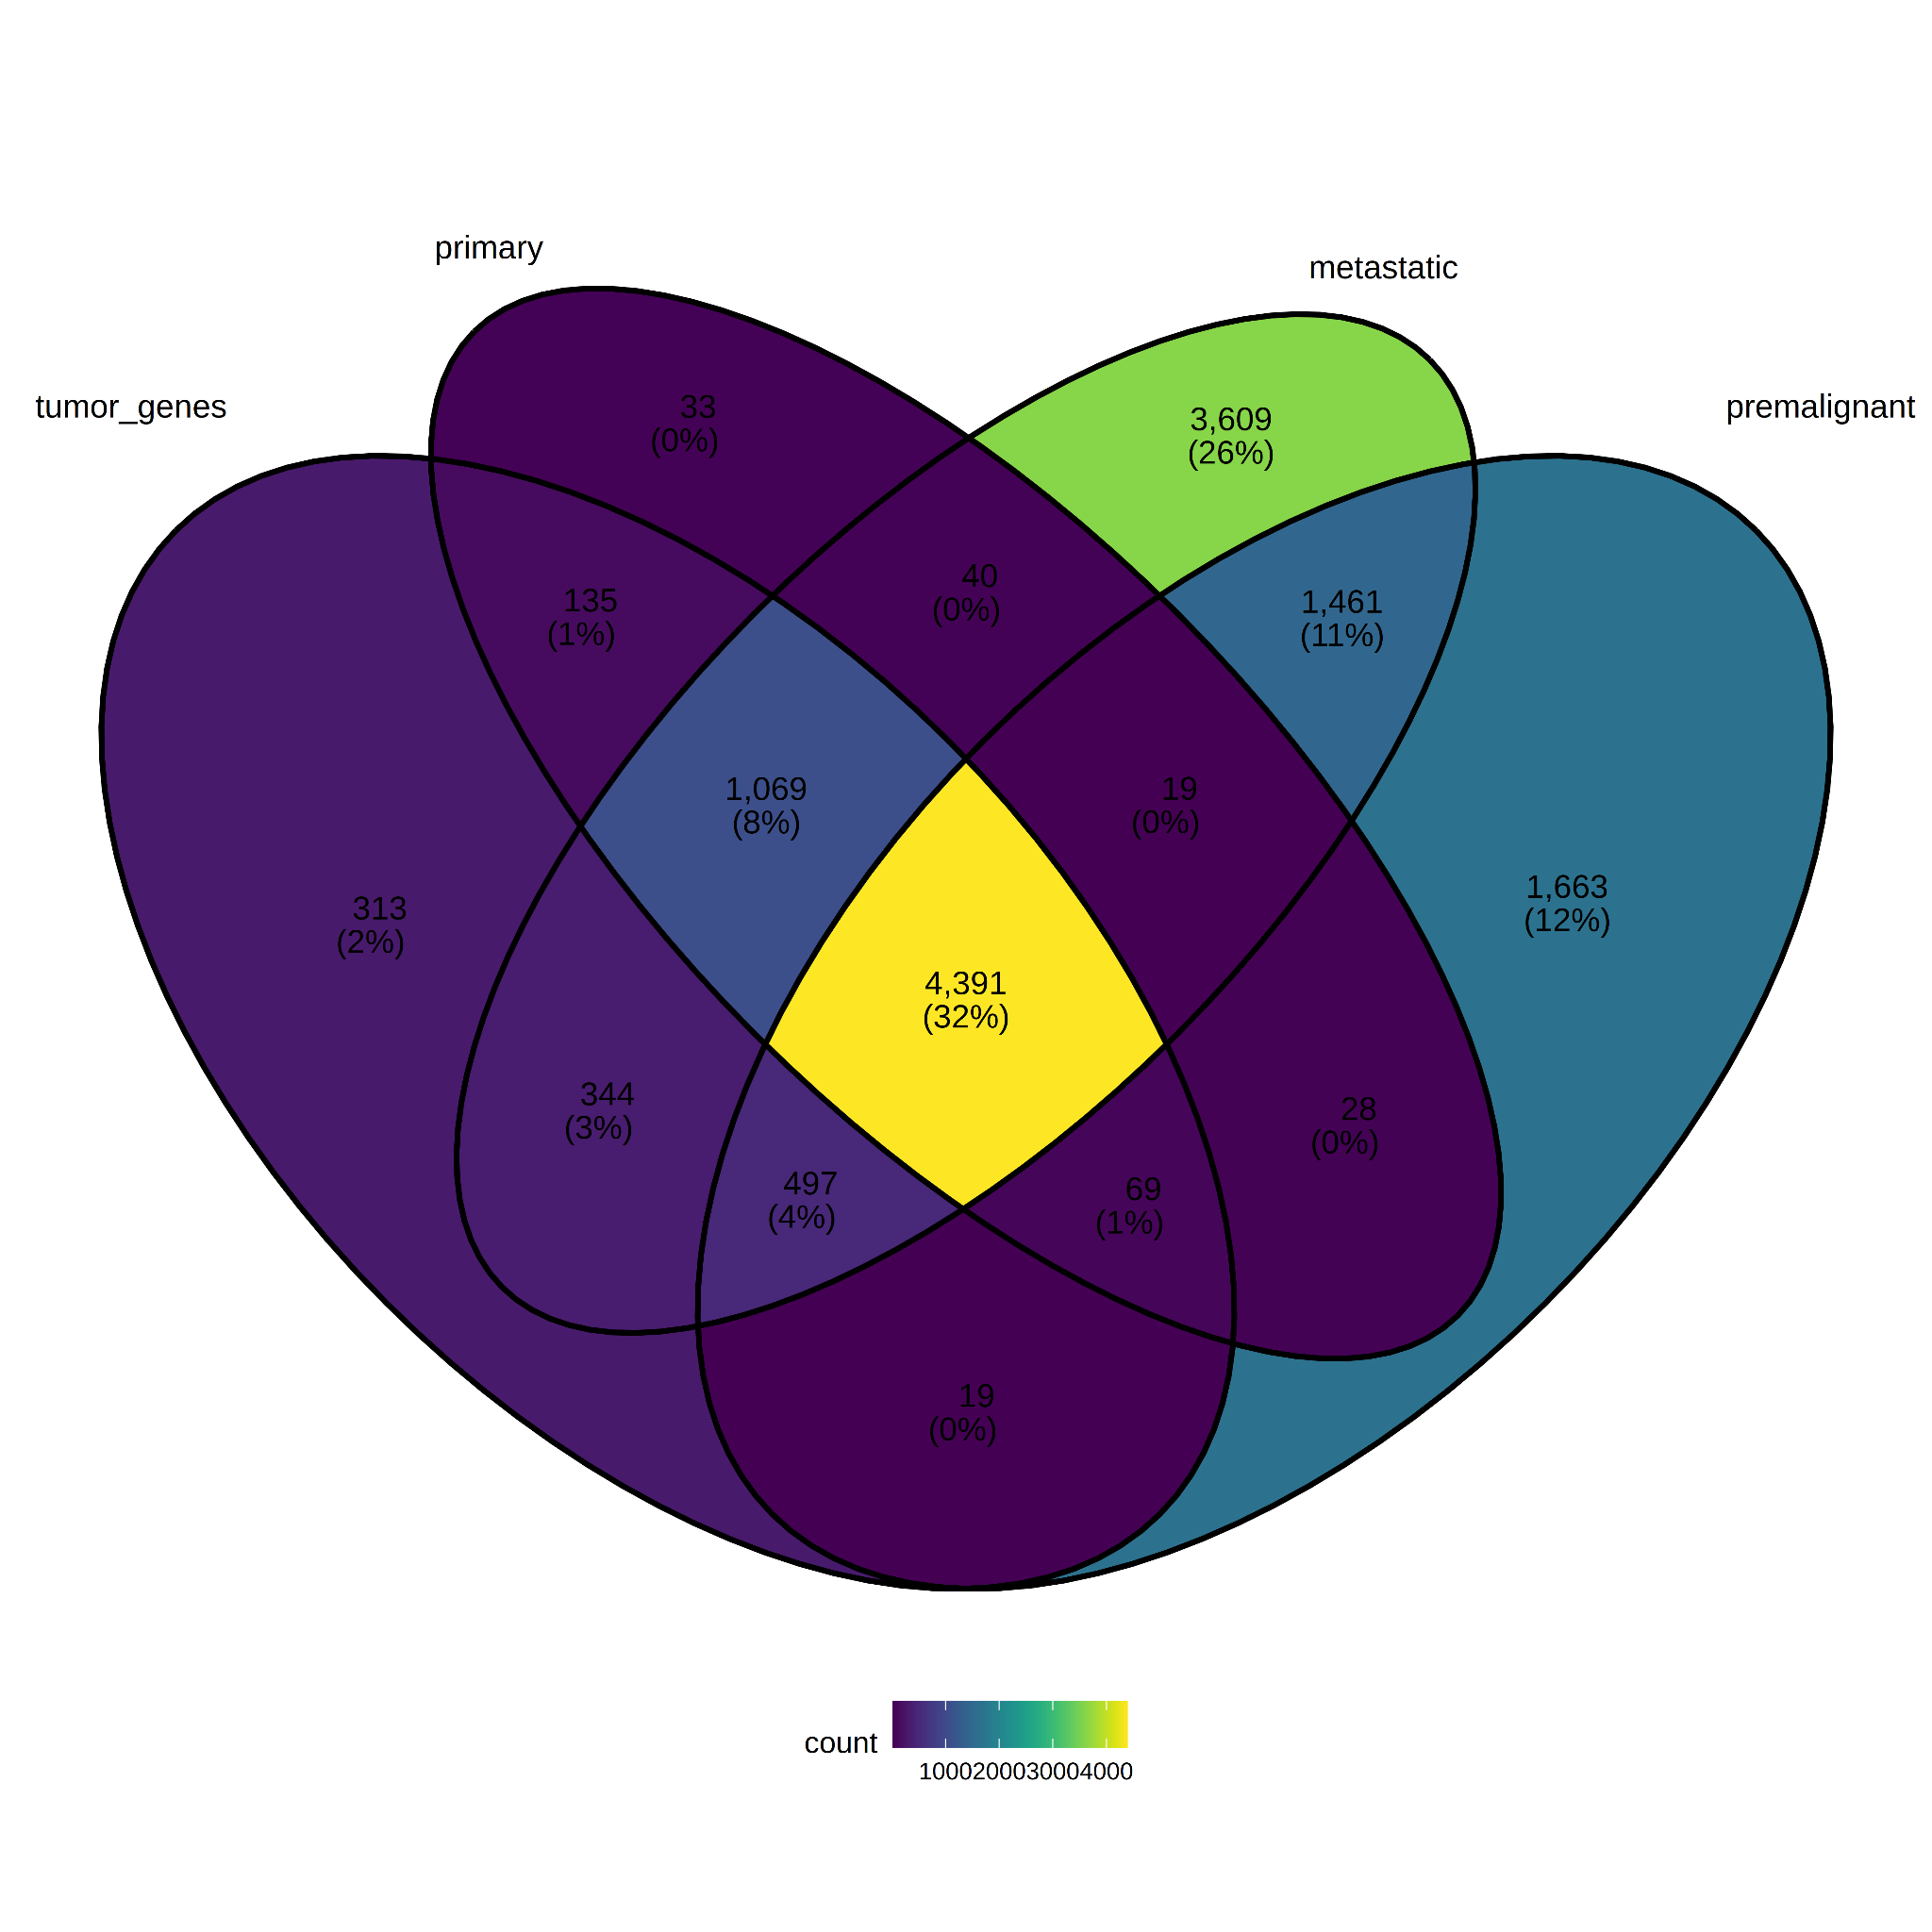
Figure 7. Differentially expressed genes per Tumor.Descriptor.
3.5 Sex-specific genes
Comparisons were made between male_tumor=(male tumor versus male normal) and female_tumor=(female tumor versus female normal) (log2FC ≥3.0 and padj ≤ 0.05). The number of genes at the intersection between tumor_genes, female_tumor genes, and male_tumor genes is large (59%, 4,826 genes). The number of genes specific to the female group is also significant (15%, 1,244 genes) (see Figure 8). The lists of sex-specific genes are in Supplemental Table S3.
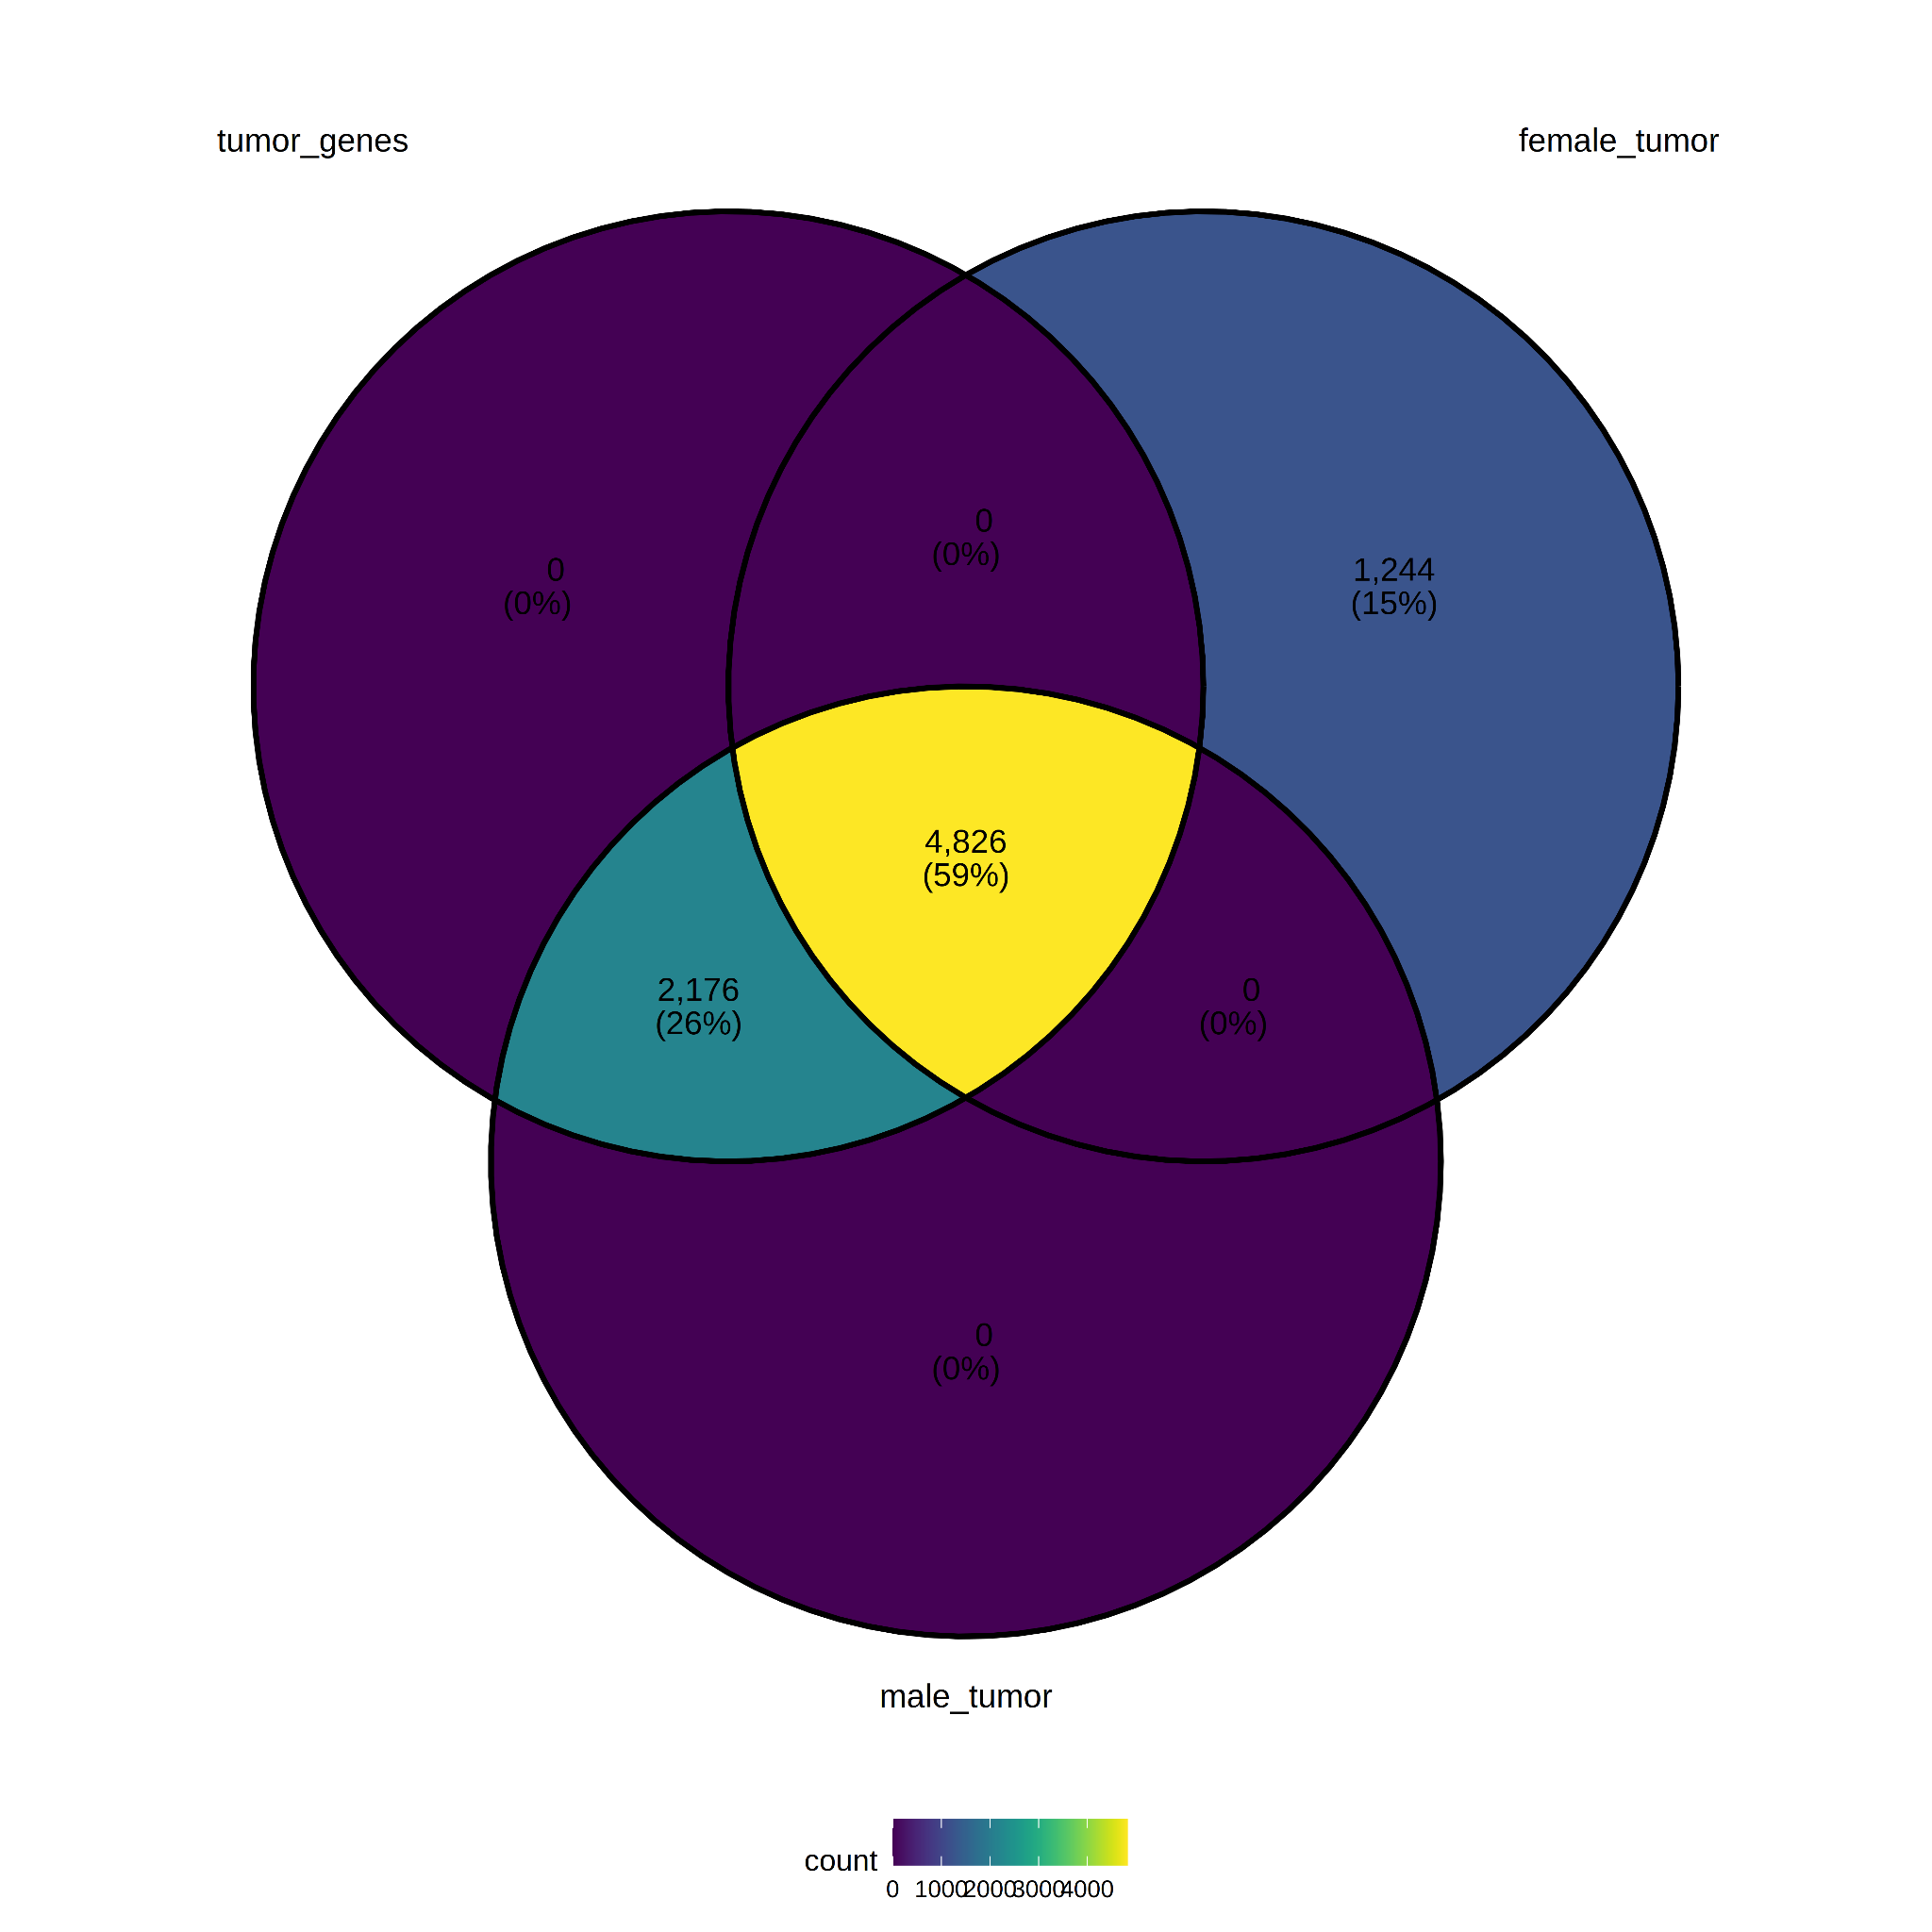
Figure 8. Differentially expressed genes per Sex.
3.6 Age-specific genes
For the analysis of DEG by age categories, 79% of tumor genes do not overlap with age groups (see Figure 9). Further investigation may be suggested to determine whether cancer mechanisms in advanced ages can be differentiated from other age groups, or whether the age variable can be used to correct the comparison between tissue types (tumor versus normal) as covariates. The lists of age-specific genes are in Supplemental Table S4.

Figure 9. Differentially expressed genes per Age group.
3.7 Race-specific genes
Finally, a comparison was made between race “white” (tumor samples) and race “white” (normal samples).The figure shows a 40% overlap (3,117 genes) between the two groups, moreover only 862 specific to the white race group (see Figure 10). The lists of age-specific genes are in Supplemental Table S5.
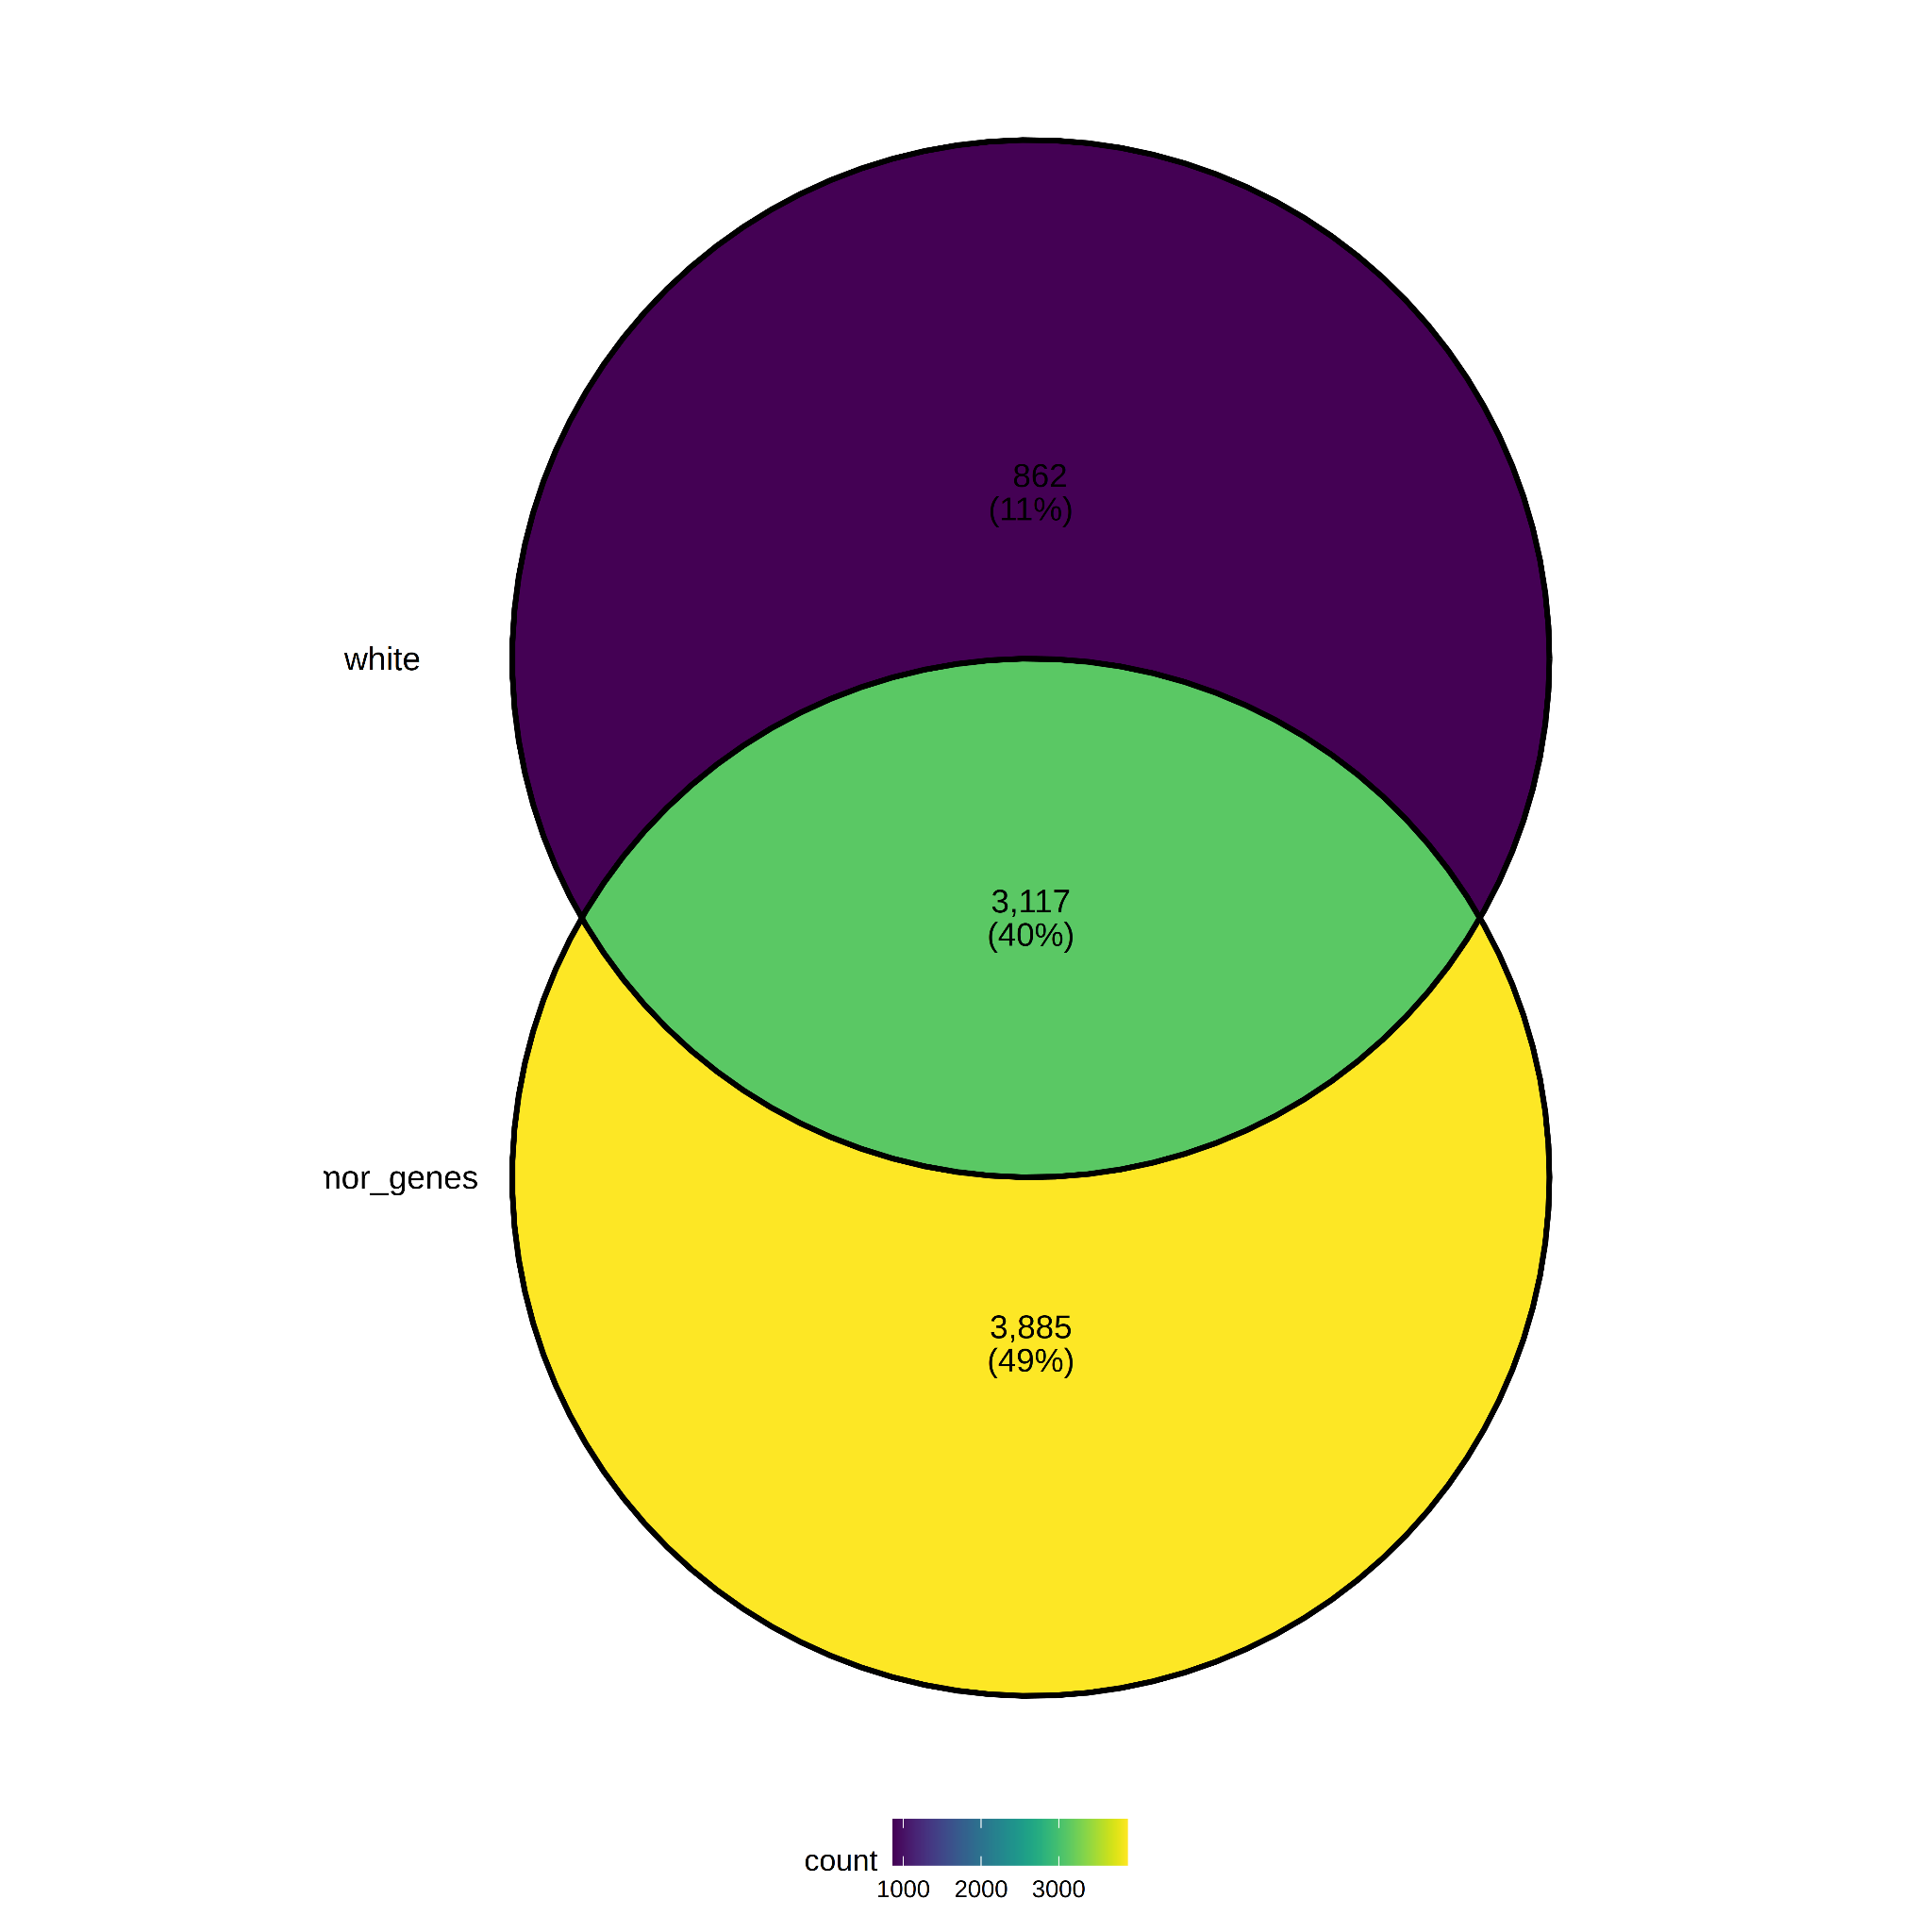
Figure 10. Differentially expressed genes per Race.
3.8 Biomarkers selection
Variable importance with Random forests
A random forest model was constructed from the 7026 putative biomarkers (log2FC ≥3.0 and padj ≤ 0.05). Then., variable importance analysis was applied. Noteworthy, results corroborates GUCA2 (GUCA2A and GUCA2B) as a promising variable for the prediction of Tissue Type (Normal/Tumor) [3] (see Table 1).
Table 1 - Top 10 DE genes according to variable importance analysis with random forest. Root mean square deviation = 0.05, mean absolute error = 0.01, mean relative error = 0.01, correlation between observed and predicted = 0.94.
|
gene id |
gene_name |
foldChange Tumor Normal |
avg normal |
std normal |
avg tumor |
std tumor |
|
ENSG00000044012.4 |
GUCA2B |
0.01 |
542.93 |
343.25 |
5.62 |
15.63 |
|
ENSG00000197273.4 |
GUCA2A |
0.02 |
2,708.68 |
1,142.98 |
55.64 |
101.70 |
|
ENSG00000182271.13 |
TMIGD1 |
0.02 |
280.12 |
123.91 |
4.72 |
11.94 |
|
ENSG00000104267.10 |
CA2 |
0.05 |
1,982.55 |
1,035.06 |
90.03 |
146.36 |
|
ENSG00000183034.13 |
OTOP2 |
0.00 |
70.79 |
63.83 |
0.29 |
1.03 |
|
ENSG00000168748.14 |
CA7 |
0.02 |
126.90 |
80.07 |
2.16 |
4.48 |
|
ENSG00000162461.8 |
SLC25A34 |
0.09 |
11.83 |
6.78 |
1.06 |
1.05 |
|
ENSG00000167434.10 |
CA4 |
0.03 |
501.57 |
275.93 |
12.64 |
30.62 |
|
ENSG00000142959.5 |
BEST4 |
0.02 |
73.92 |
57.51 |
1.59 |
2.09 |
|
ENSG00000133742.14 |
CA1 |
0.01 |
746.89 |
630.23 |
10.77 |
28.53 |
Regression trees
Transcripts Per Million (TPM) were also used to fit a decision tree model for the prediction of Tissue Type (Tumor/Normal). From Figure 11 we can read that the initial distribution of the n=474 samples is as follows : 96% for the Tumor and 04% Normal. Moreover, if the TPM value of ENSG00000197273.4 (GUCA2A) is not greater than 1083 (TPM) then THEN the prediction of Tissue Type is Tumor (see Figure 11).
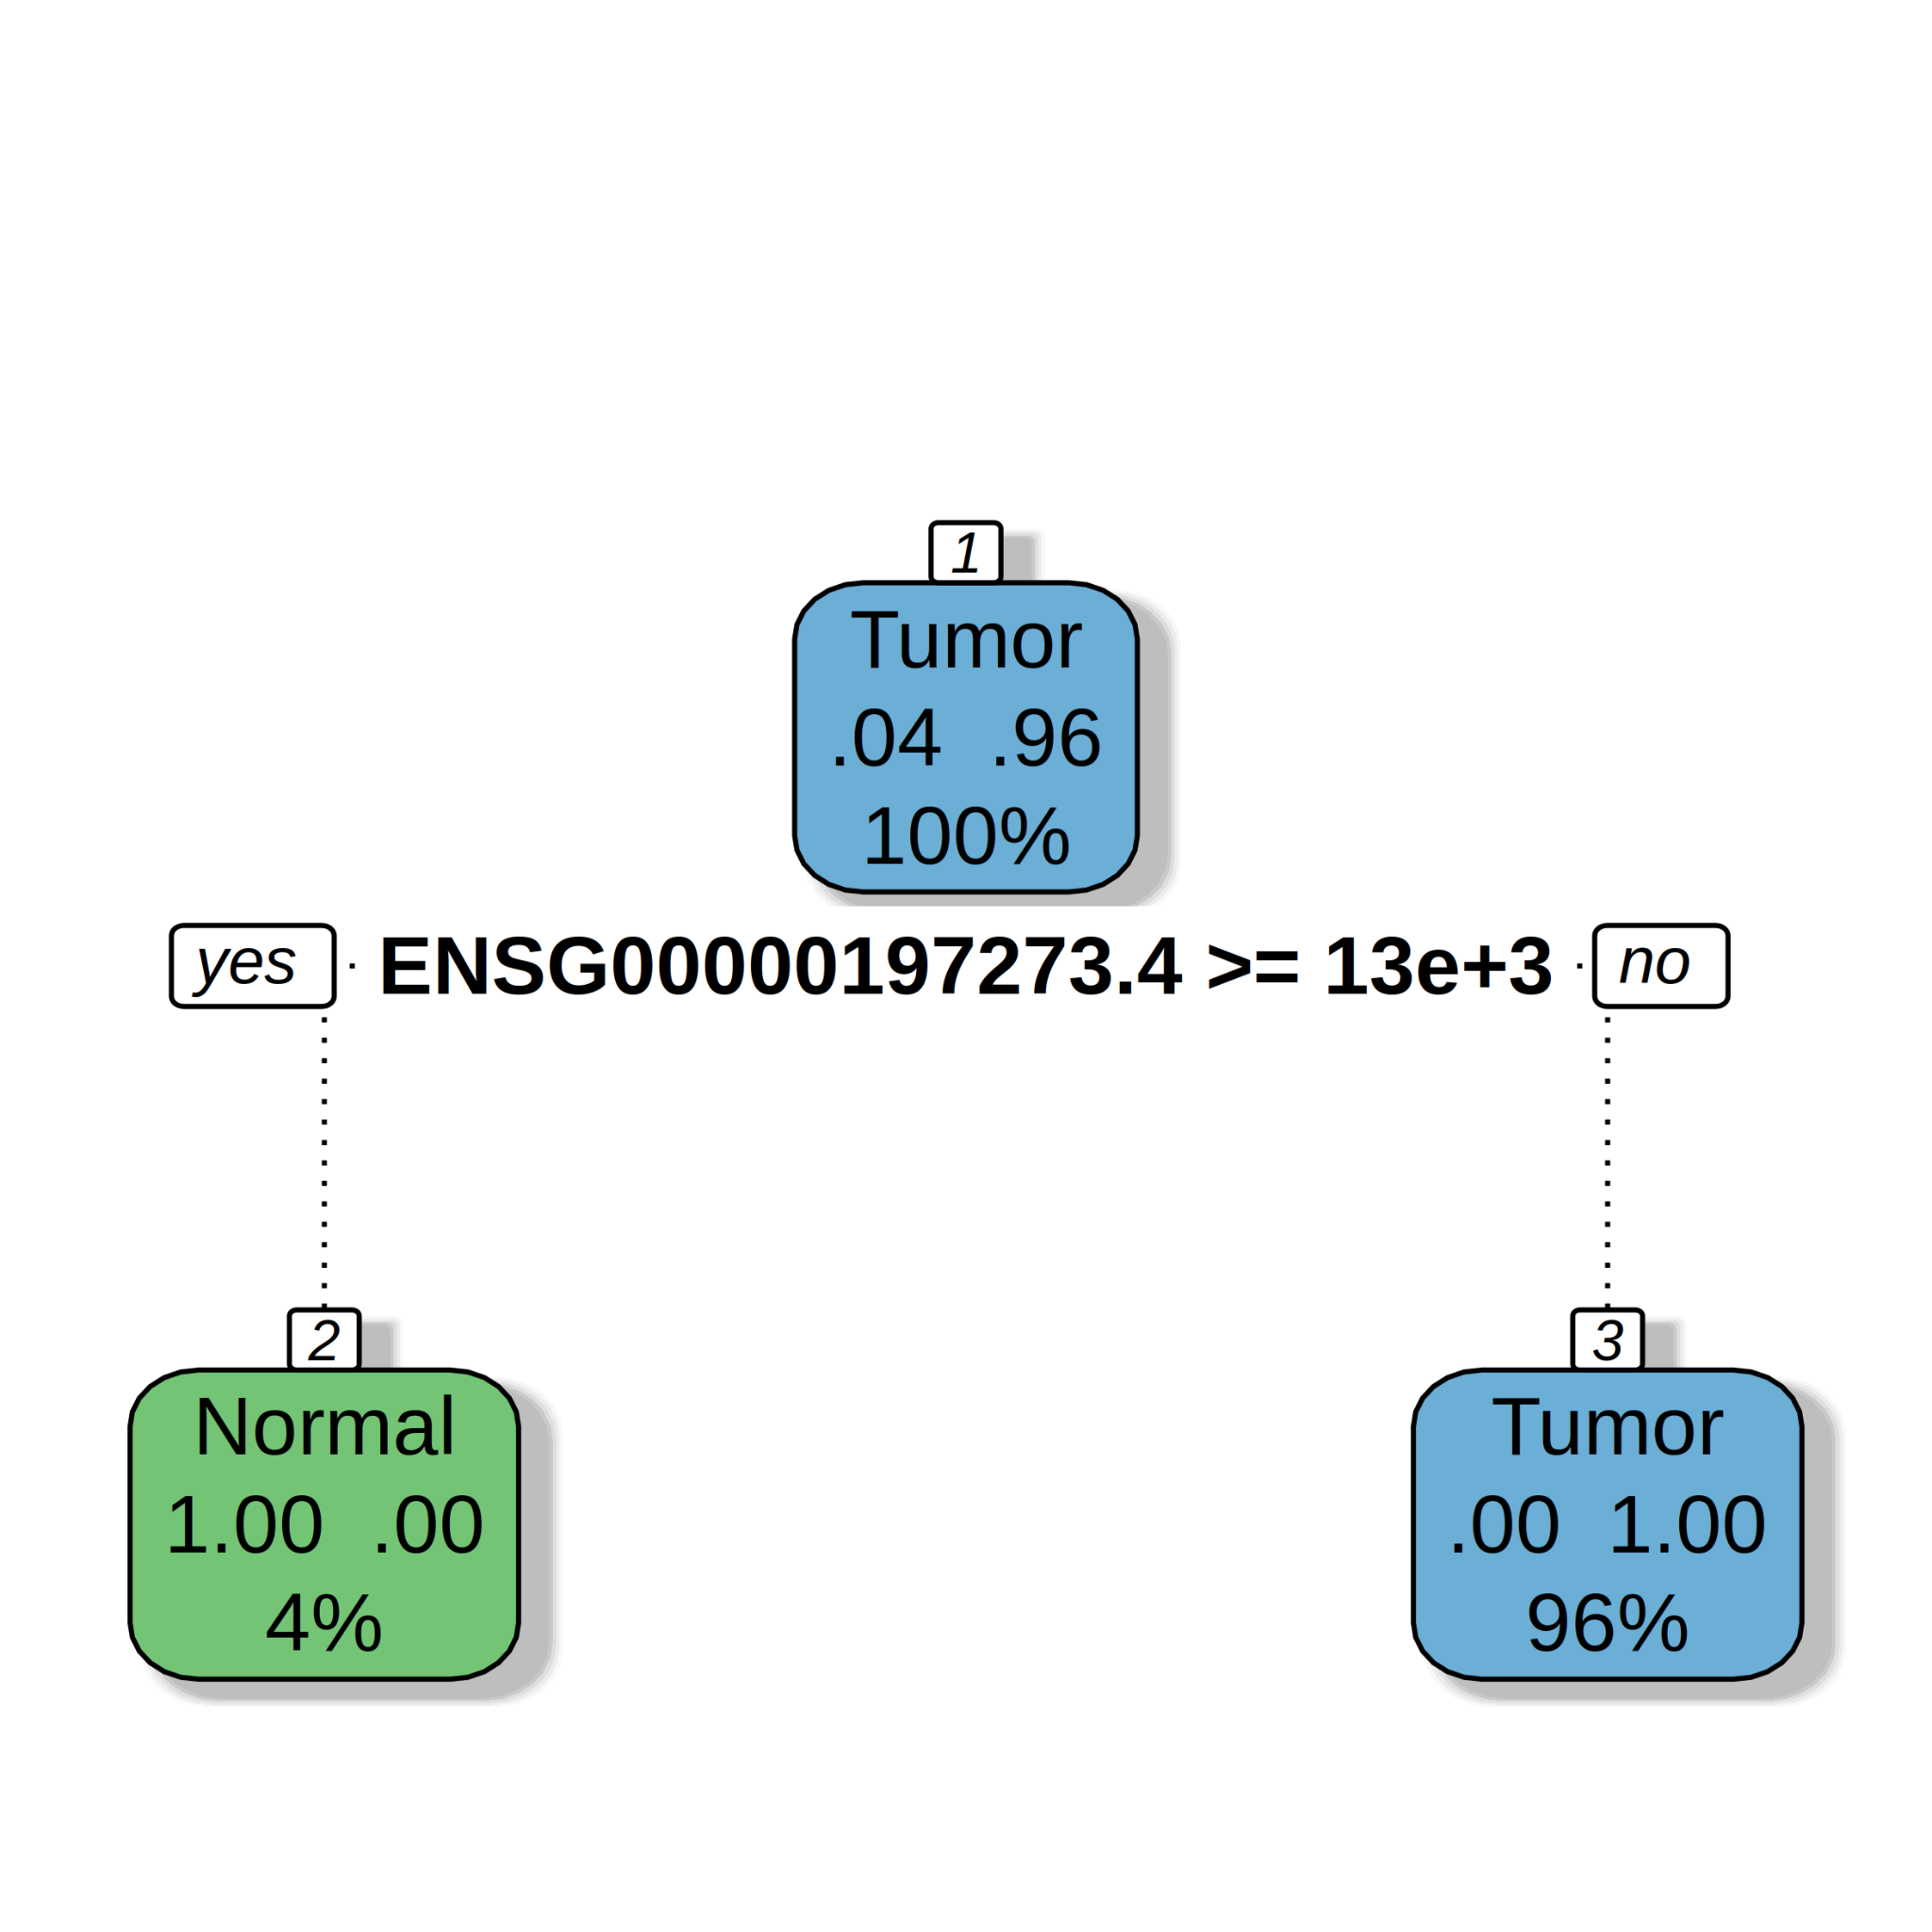
Figure 11. Regression tree models built from prostate cancer data for the prediction of Tissue Type (Tumor/Normal). TPM values were used. Root mean square deviation = 0.09, mean absolute error = 0.02, mean relative error = 0.01, correlation between observed and predicted = 0.86.
4. Conclusions
Cohort studies are important for determining which questions can be answered given the availability of transcriptome data and patient information. Moreover, from automatic biomarker selection, we automatically found the GUCA2A (ENSG00000197273.4) gene as a promising biomarker for the diagnosis of colon cancer [3]. We found that the difference of the mean of GUCA2A TPM values are significantly different between Tumor and Normal samples.
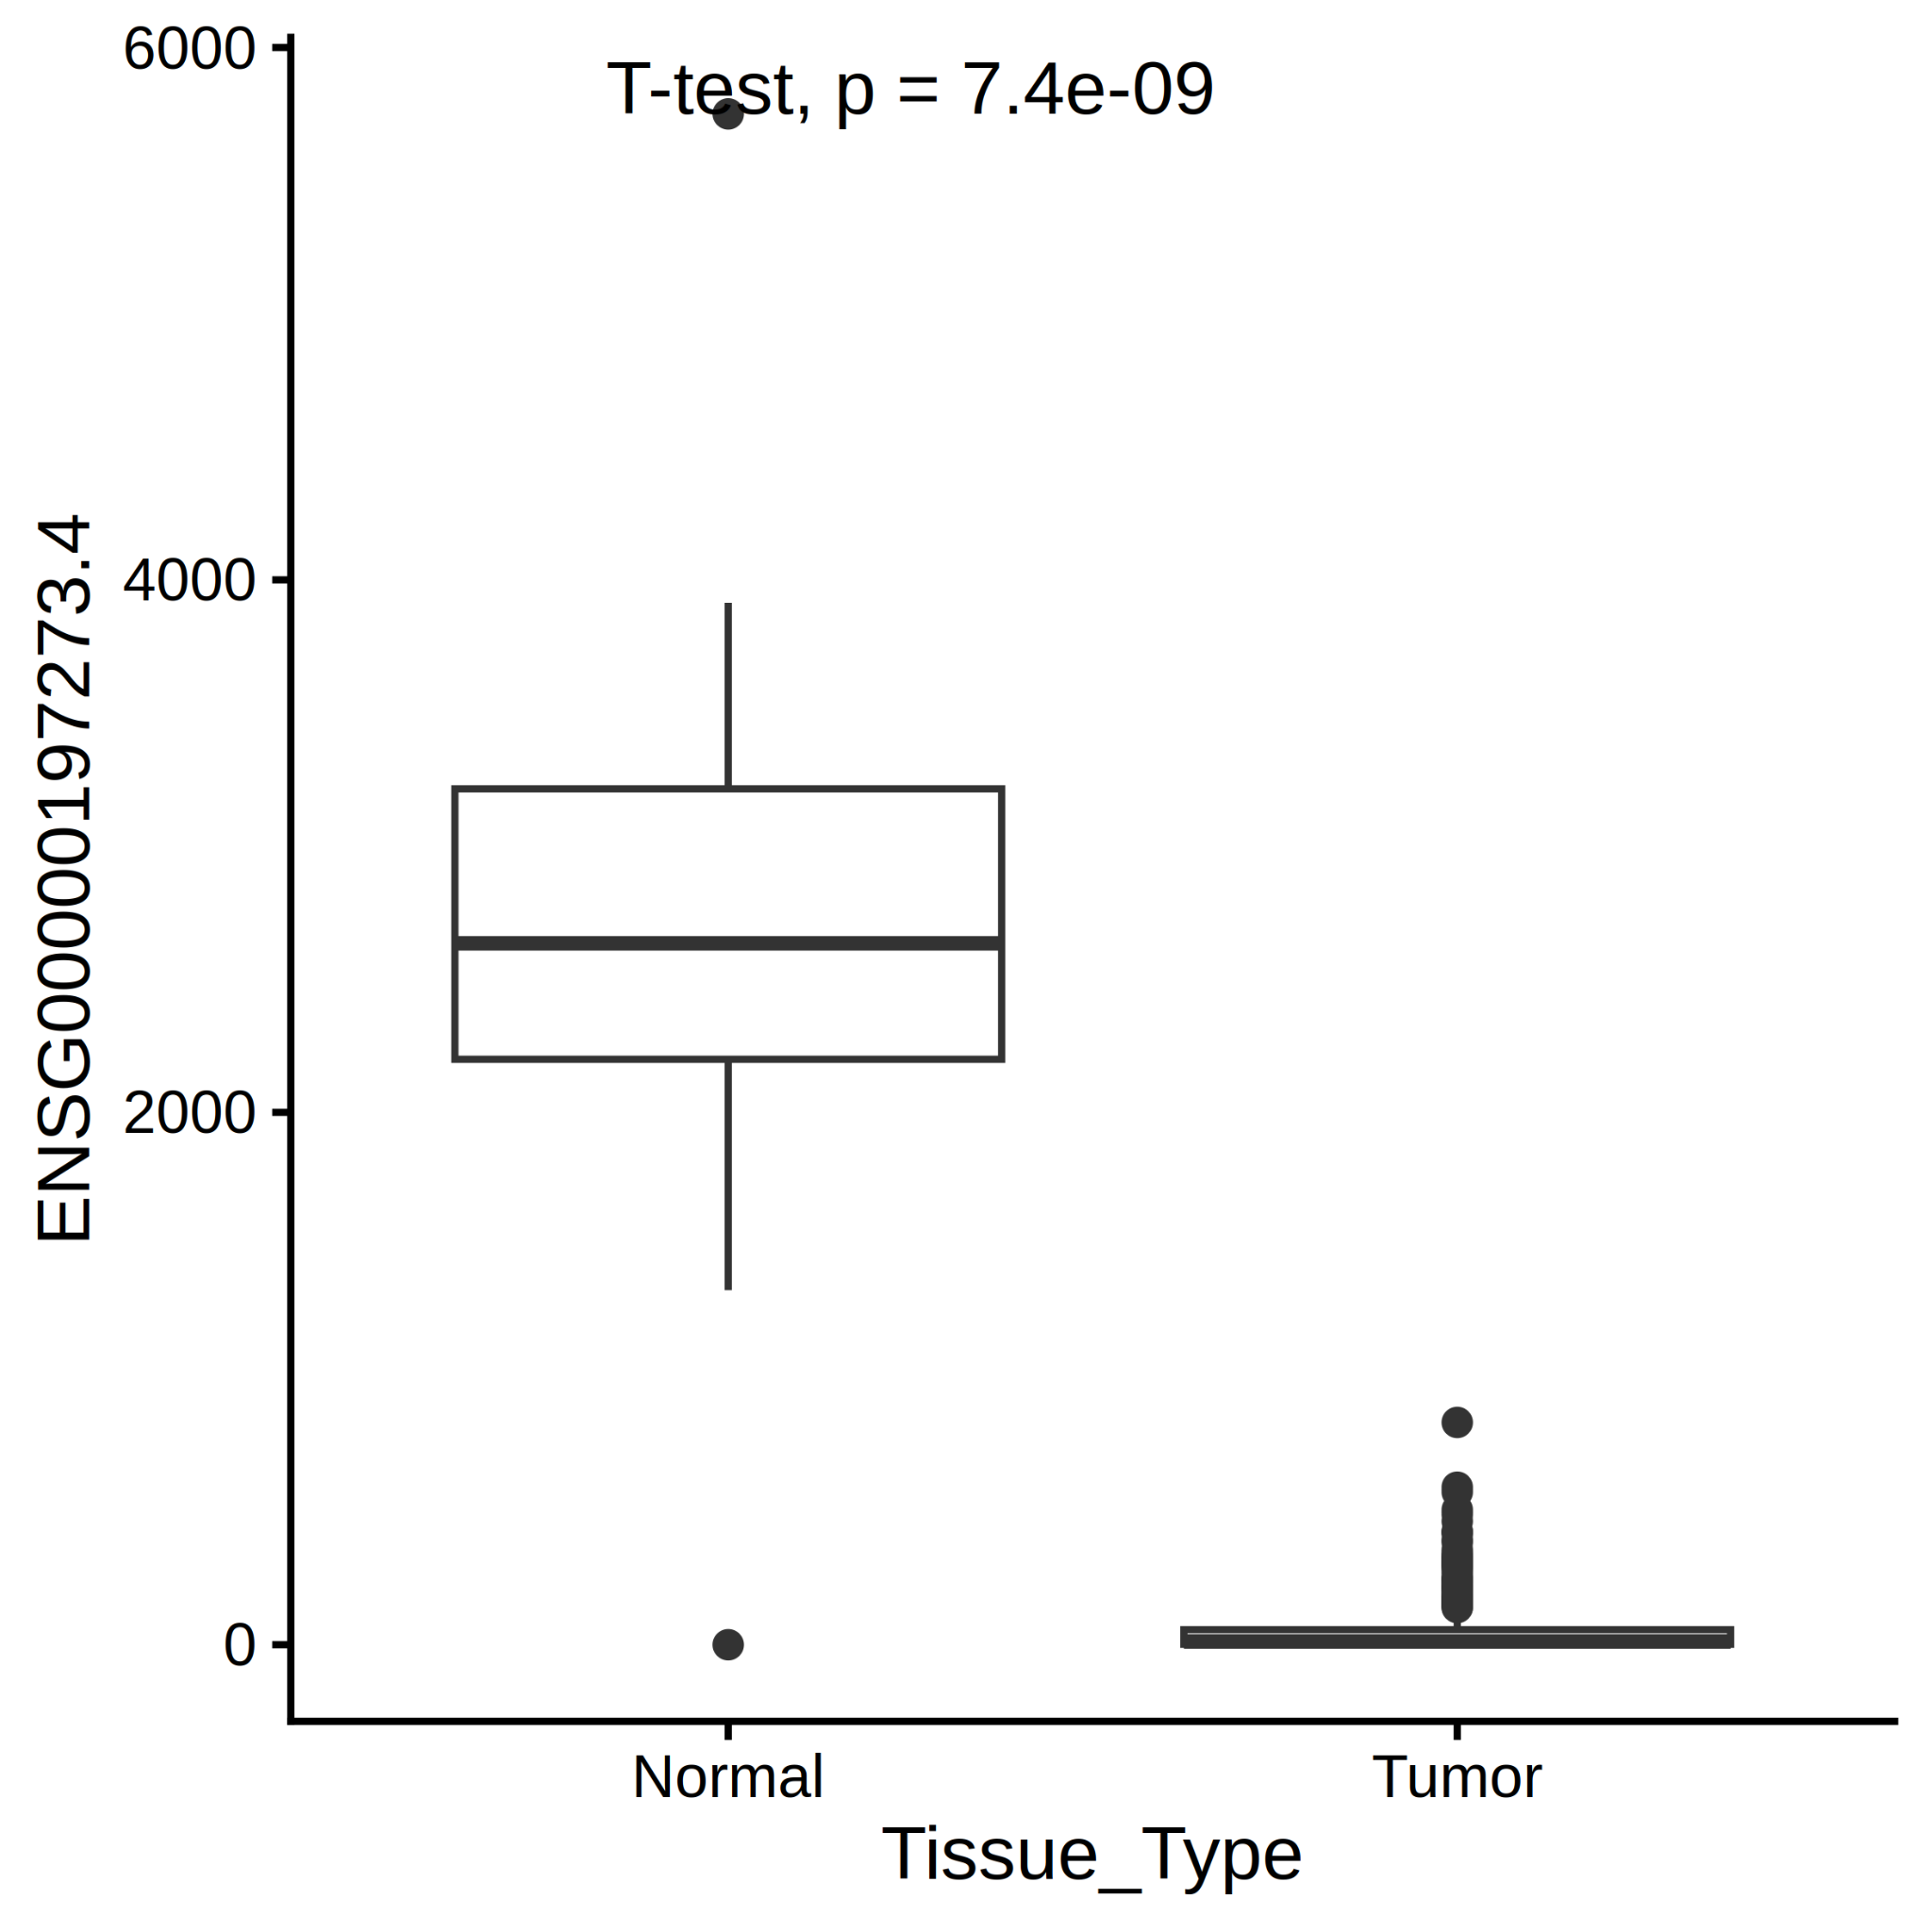
Figure 11. GUCA2A TPM values.
5. References
[1] Gwen Murphy, Susan S Devesa, Amanda J Cross, Peter D Inskip, Katherine A McGlynn, Michael B Cook. Sex Disparities in Colorectal Cancer Incidence by Anatomic Subsite, Race and Age.
[3] Jalali P, Aliyari S, Etesami M, Saeedi Niasar M, Taher S, Kavousi K, Nazemalhosseini Mojarad E, Salehi Z. GUCA2A dysregulation as a promising biomarker for accurate diagnosis and prognosis of colorectal cancer. Clin Exp Med. 2024 Nov 1;24(1):251. doi: 10.1007/s10238-024-01512-y. PMID: 39485546; PMCID: PMC11530487.
Declarations
Ethics approval and consent to participate
This research used publicly available, non-identifiable, transcriptome of human data, already published on the GDC portal (https://portal.gdc.cancer.gov/) accessed on 28-04-2026.
Availability of data and materials
The data that support the findings of this study are openly available in GDC portal. A github with data and scripts to reproduce the results was made available at : https://github.com/datasciencebioinformatics/BiomarkerIdentification_ColonCancer/
Authors' contributions
Felipe Leal Valentim (FLV) conceived and implemented the project
Funding declaration
FLV had the post-doc funded by FUSP but this work was performed independently. The analyses were conceived my during my post-doctoral studies at ISPED, Bordeaux, France and the scripts implemented independently in 2025.
Of all the courses offered by the Federal University of Lavras in 2002, I ranked second. I chose Computer Science because I learned to use a computer on my own. I have experience in data science and artificial intelligence, mainly with the R programming language. I hold a PhD from Wageningen University and currently work as a postdoctoral researcher in Artificial Intelligence at USP (University of São Paulo). I have completed postdoctoral internships at ISPED/INSERM Bordeaux, Médecine Sorbonne Université/INSERM Paris, LACEN-TO/OPAS Palmas, UNIFESP/FAPESP São Paulo, and Fiocruz Rio de Janeiro.


Please sign in or register for FREE
If you are a registered user on Research Communities by Springer Nature, please sign in