From daily diaries to flexible curves: modelling habit change in daily life
Published in Behavioural Sciences & Psychology and Statistics

Our randomised controlled trial in Communications Psychology aimed to embrace the uniqueness of people’s everyday lives while still maintaining enough experimental control to test how unwanted habits can be weakened. Here we look at how we collected data and delivered the manipulation 'in the wild'—and how we tackled the challenge of analysing idiosyncratic time series for testing average intervention effects.
Testing habit change in everyday life
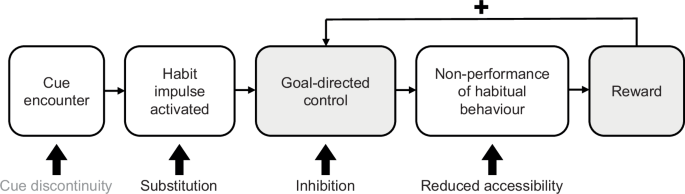
Habits are learned cue–behaviour links1: through repetition in stable contexts, a cue can come to trigger a behaviour quickly and effortlessly. Because these associations form in everyday life, they are also highly personal. In our study, we focused on one common “bad habit”: unhealthy snacking at home. We tested whether different habit theory-informed strategies2—alone or combined with reward—could support the process of weakening this habit in daily life (see Fig. 1).
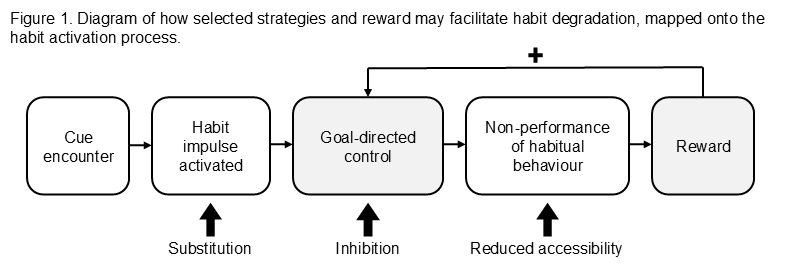
Note: Adapted from Edgren et al. (2026)6.
To capture how habits change in daily life, we collected daily self-reports via a bespoke smartphone app. The app made it easy to send reminders at the right time and to collect responses within the ebb and flow of everyday life. At the same time, we tried to keep the daily questionnaire short to minimise burden. The screen recording below shows what a typical daily entry looked like from a participant’s perspective.
Crucially, the app also allowed us to implement experimental control by showing different content depending on each participant’s assigned condition. This included delivering strategy instructions—and, for half of participants in the intervention, reward. Reward was triggered when participants proactively logged a moment of cue exposure (i.e., encountering the situation that would typically prompt snacking) and reported resisting the habitual response in that moment. In practice, this produced a pop-up with a positive feedback message and a trophy graphic (see screen recording below), alongside accumulating in-app points and accomplishment tiers.
When one trend doesn’t fit everyone
The outcome data consisted of individual time series of habit strength. We wanted to know how habit strength changed over time—and whether the shape of that change differed between experimental groups. At first glance, simple. In practice, anything but.
One challenge was defining “change.” The right definition depends on the process you expect. Based on our earlier work3, we anticipated habit weakening would be steep at first, then slow and possibly stabilise. But we also knew these trends may differ markedly between people. In our previous study on modelling habit-strength time series, some participants’ data were best described by linear trends, others by quadratic or cubic patterns, and others by asymptotic curves3. Such heterogeneity means any a-priori function would fit some people well and others poorly.
This led us to generalised additive models4 (GAMs), which flexibly capture individual trajectories without imposing a fixed functional form. The trade-off is that GAMs don’t yield a single, easy-to-interpret parameter estimate in the way that conventional regression models do. Instead, we extracted information from the fitted GAMs by estimating first derivatives at each time point, using the R package gratia5. This procedure allowed us to harmonize the process of change across heterogeneous trajectories. Intuitively, these derivative values represent the rate of change at a given moment—how steeply habit strength is decreasing (or increasing) on that day, which can also be understood as the local slope (see Fig. 2).
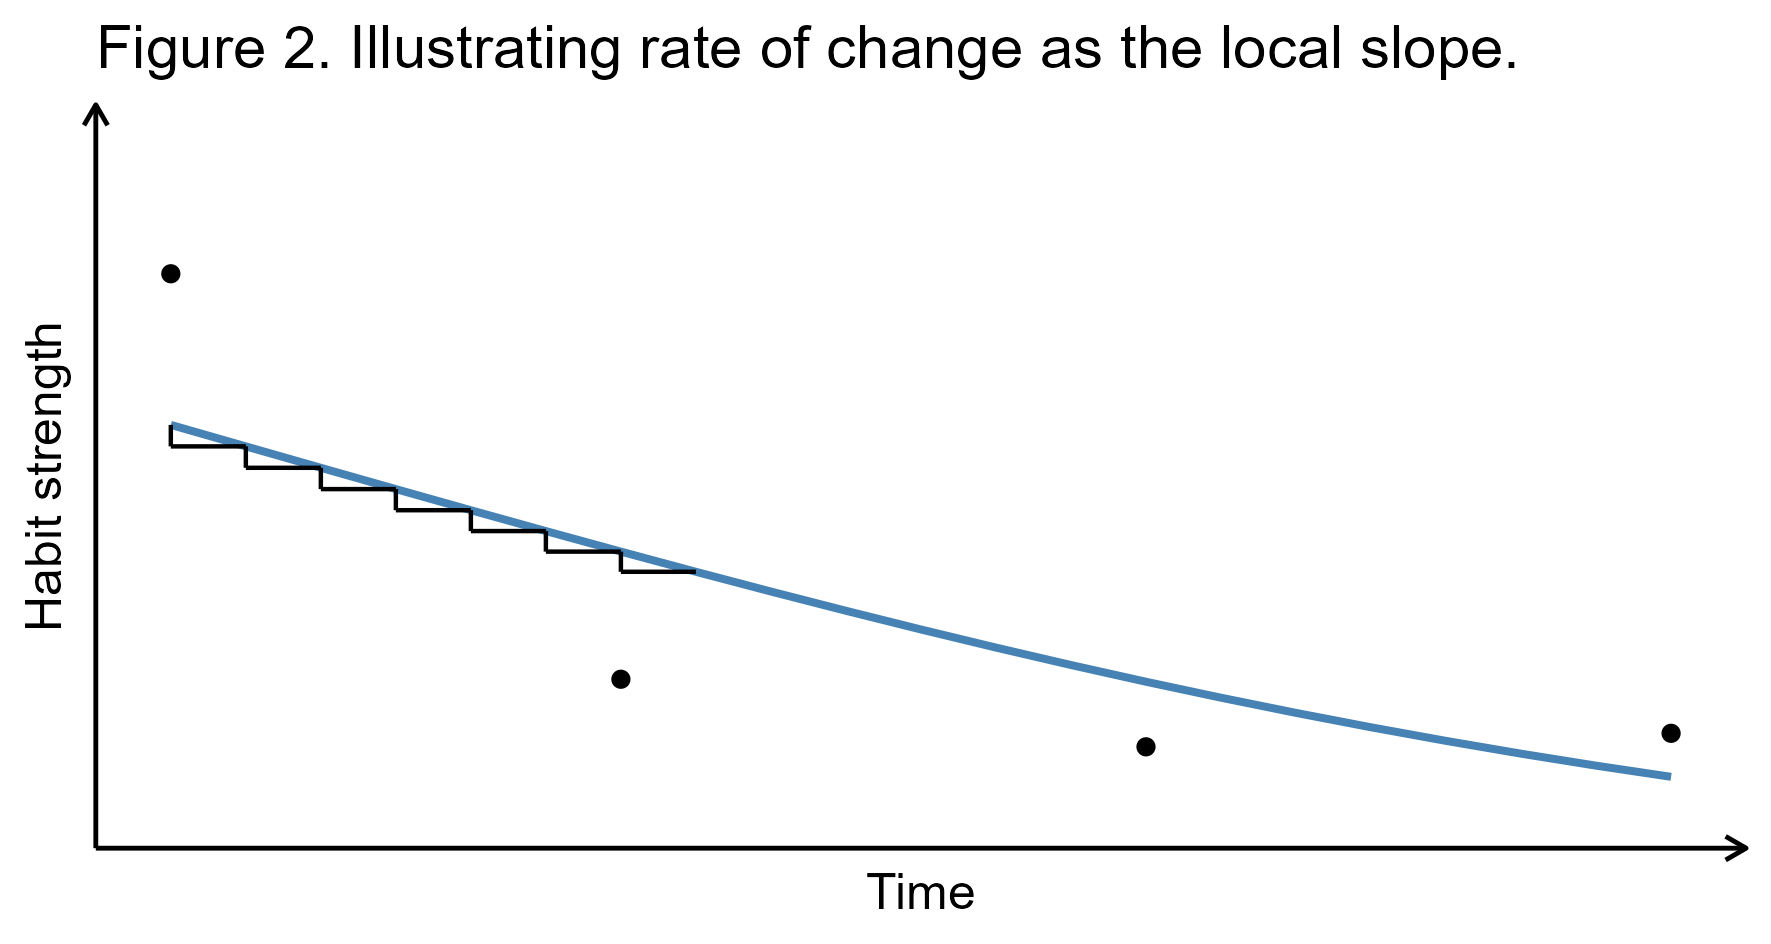
Note: Adapted from Edgren et al. (2026)6.
Overall, we found that habit strength declined over time, and that the intervention groups showed a faster rate of change than the control group during the first week. Beyond that, however, we found no evidence of differences between the specific strategies, or between reward versus no reward, across the other indicators of change we examined. Moreover, findings showed that the trend of how habit strength changes over time varies markedly between individuals (see Fig. 3).
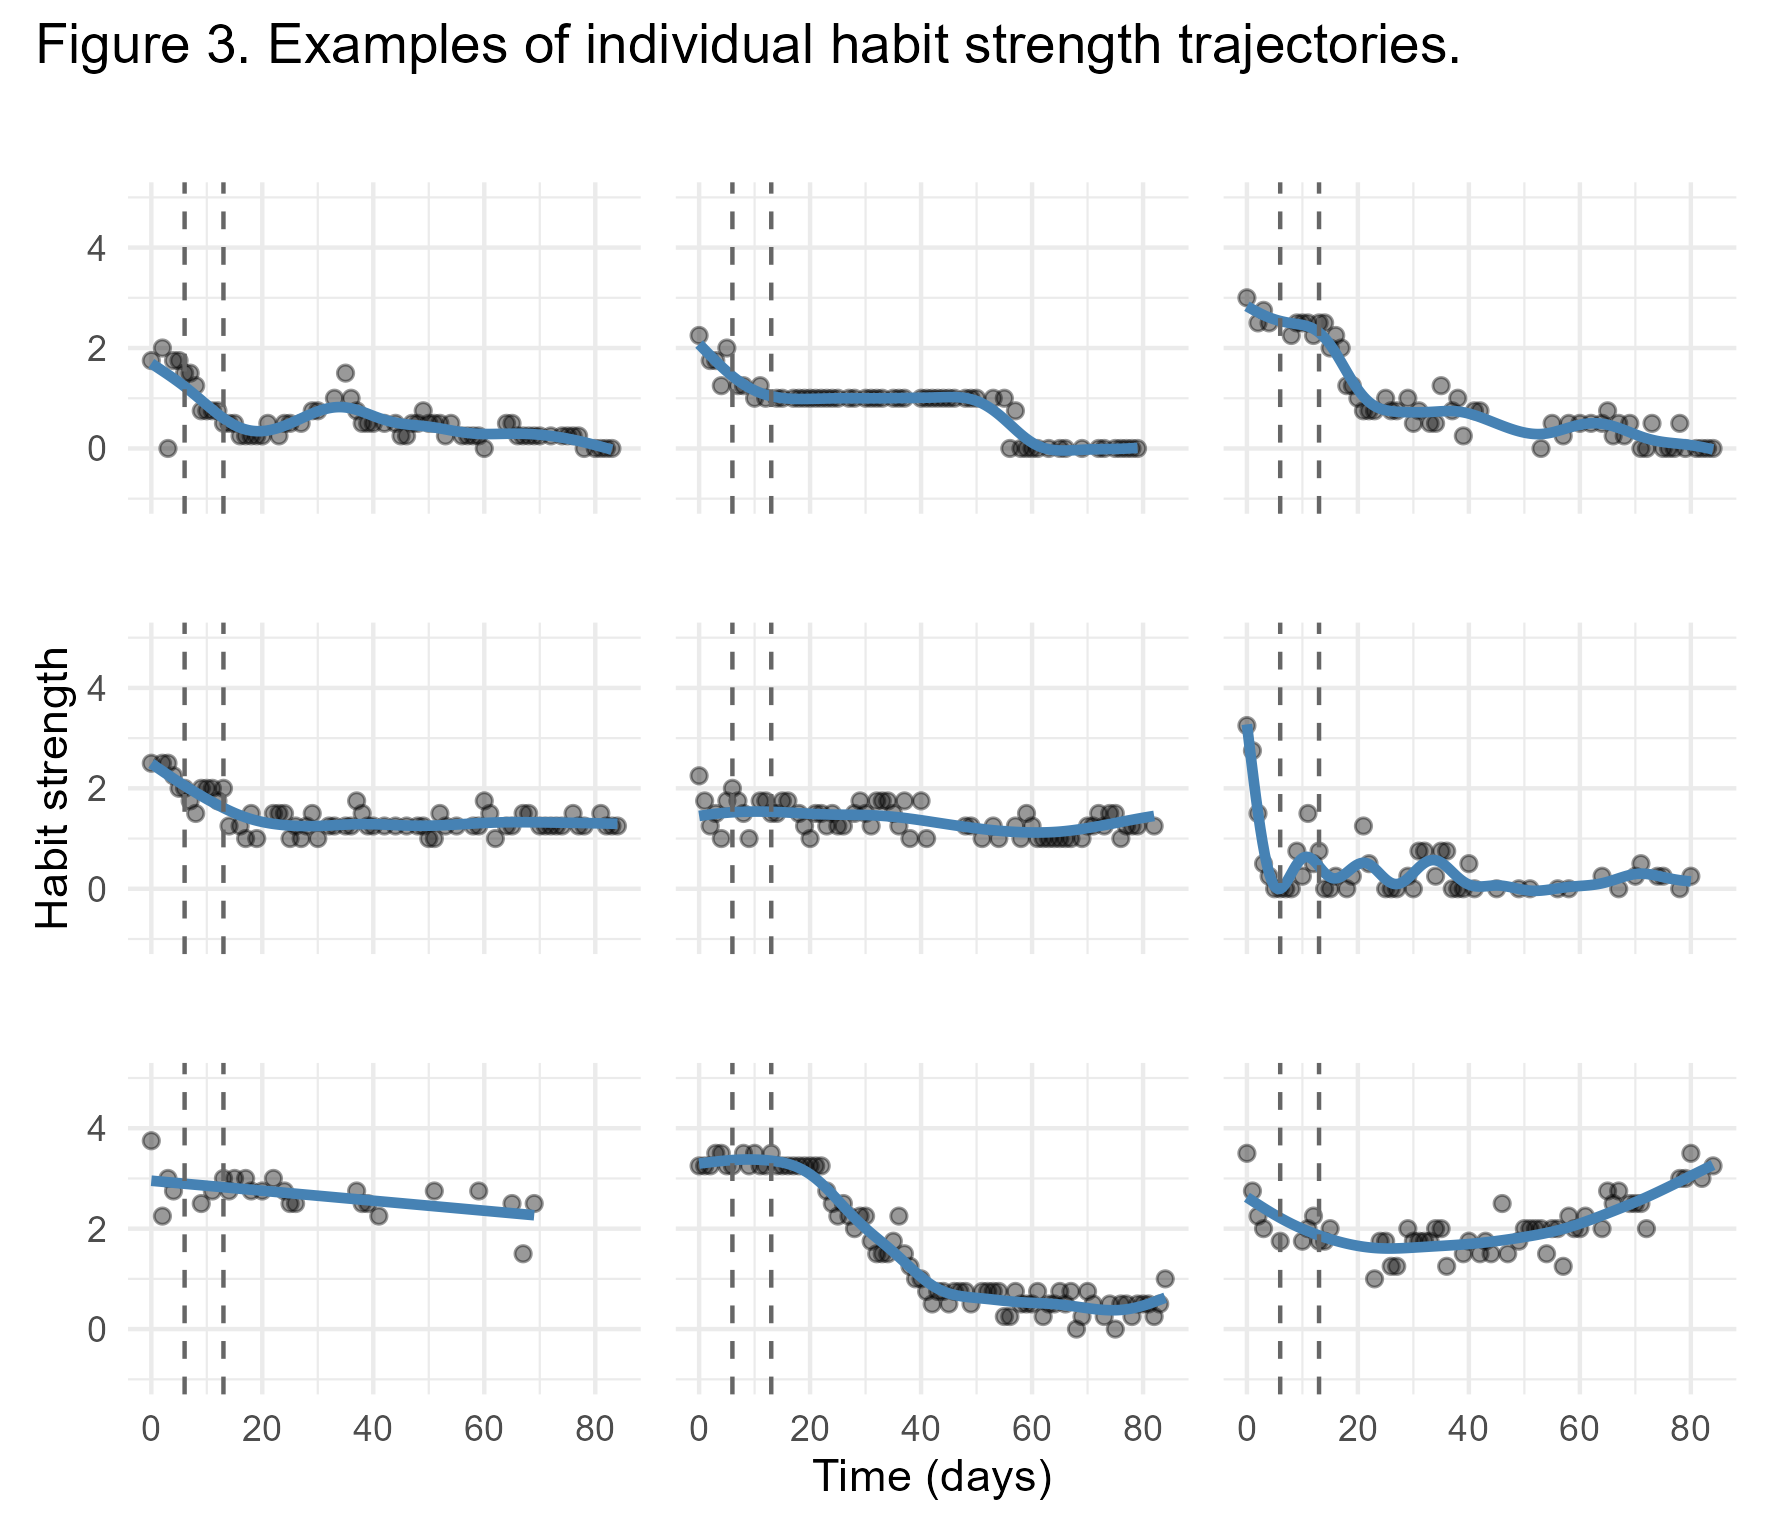
Note: Habit strength was measured with the Self-Report Behavioural Automaticity Index7, with scores ranging from 0 (no habit) to 4 (strong habit). The blue curves are GAM fitted estimates. The dashed vertical lines indicate the end of the first and second week, which marks the time windows of interest for estimating rate of change from the GAM estimates. Adapted from Edgren et al. (2026) supplementary materials6.
Alongside its contributions to habit research, this work enables reflecting on two broader themes: the divergent expectations of researchers and participants in research embedded in daily life, and what it means to focus on rate of change as an outcome.
Lessons learned—and what comes next
Our study sat between two worlds: naturalistic data collection paired with the kinds of manipulations typical of lab experiments. In searching for a “sweet spot” between ecological validity and experimental control, we became more aware that researchers’ and participants’ expectations may not fully align. For example, we designed the study around a specific, context-bound cue–behaviour link. But for participants, that single pairing may have felt like one small piece of a much larger puzzle—tied to broader goals, routines, and competing demands. Many, for instance, reported blending several strategies during the study. Going forward, when lived experience is the object of study, research may stand to benefit from embracing the variability of daily life rather than trying to contain it—for instance by tracking the frequency of the various strategies used rather than imposing restrictions on their use. We have also conducted preregistered follow-up interviews8 with selected participants to explore these intervention fidelity related experiences in more depth, with findings to come later this year.
Looking back, it's striking how central rate of change becomes when modelling time series—whether with GAMs or traditional parametric models. Either way, you make assumptions about how change unfolds, even if you don't frame it that way. A linear model assumes a constant rate of change. A quadratic model allows the rate to change over time (the quadratic term captures how the linear trend accelerates or decelerates). Asymptotic models include a parameter that directly governs how quickly the curve approaches its plateau. Yet in psychology, we rarely pose research questions in terms of rate of change, even though it can be a highly meaningful way to describe behaviour change processes, as seen in the present study. Importantly, placing more emphasis on rate of change in psychological research could also facilitate the iterative development of differential equations needed in formalization of theory9 concerned with how constructs change over time. Rate of change is also central to complex systems theory and attractor landscapes10: pushed beyond a critical threshold, a system can change rapidly. This perspective has been applied in psychological research11 and stands to offer further opportunities—especially for understanding when and why behaviour change suddenly “takes off” (or is maintained) in everyday life.
Looking ahead, research on breaking habits stands to benefit from tracking how people's dynamic use of strategies occurs over time, and from continuing to use rate of change in innovative ways. At the same time, more fundamental issues warrant attention if the field is to make meaningful progress. One is the extent to which unwanted habits actually drive overall engagement in a given health-related behaviour—a question that speaks directly to the value of habit interventions for initiating and maintaining change. Another is the conceptualization and measurement of habit itself, which is central to testing and improving our theories. Encouragingly, progress is already underway, including an ambitious systematic review on the measurement of habit12.
[Poster image generated with ChatGPT-5.4]
References
- Fleetwood, S. A definition of habit for socio-economics. Rev. Soc. Econ. 79, 131–165 (2021).
- Gardner, B., Rebar, A. L., De Wit, S. & Lally, P. What is habit and how can it be used to change real‐world behaviour? Narrowing the theory‐reality gap. Soc. Personal. Psychol. Compass 18, e12975 (2024).
- Edgren, R., Baretta, D. & Inauen, J. The temporal trajectories of habit decay in daily life: An intensive longitudinal study on four health‐risk behaviors. Appl. Psychol. Health Well-Being 17, e12612 (2025).
- Hastie, T. & Tibshirani, R. Generalized Additive Models. Stat. Sci. 1, (1986).
- Simpson, G. L. gratia: Graceful ggplot-Based Graphics and Other Functions for GAMs Fitted using mgcv. (2024).
- Edgren, R., Baretta, D. & Inauen, J. Habit degradation strategies promote faster early reductions in unhealthy snacking habit strength in intensive longitudinal randomised controlled trial. Commun. Psychol. (2026).
- Gardner, B., Abraham, C., Lally, P. & De Bruijn, G.-J. Towards parsimony in habit measurement: Testing the convergent and predictive validity of an automaticity subscale of the Self-Report Habit Index. Int. J. Behav. Nutr. Phys. Act. 9, 102 (2012).
- Edgren, R. & Inauen, J. Perceptions of habit strength: Follow-up interviews with HABIRUPT Study 2 participants - Preregistration. Preprint at https://doi.org/10.17605/OSF.IO/KEPJR (2025).
- Guest, O. & Martin, A. E. How Computational Modeling Can Force Theory Building in Psychological Science. Perspect. Psychol. Sci. 16, 789–802 (2021).
- Heino, M. T. J., Proverbio, D., Marchand, G., Resnicow, K. & Hankonen, N. Attractor landscapes: a unifying conceptual model for understanding behaviour change across scales of observation. Health Psychol. Rev. 17, 655–672 (2023).
- Baretta, D. et al. Predicting recovery after stressors using step count data derived from activity monitors. Npj Digit. Med. 8, 606 (2025).
- Gördes, L. et al. Measuring Habit Effectively: A Scoping Review and Meta-Analysis. Preprint at https://doi.org/10.17605/OSF.IO/AU6BJ (2024).
Follow the Topic
-
Communications Psychology
An open-access journal from Nature Portfolio publishing high-quality research, reviews and commentary. The scope of the journal includes all of the psychological sciences.

Related Collections
With Collections, you can get published faster and increase your visibility.
Replication and generalization
Publishing Model: Open Access
Deadline: Dec 31, 2026
Comparative Psychology of Cognition, Affect, and Behaviour
Publishing Model: Open Access
Deadline: Jul 02, 2026


Please sign in or register for FREE
If you are a registered user on Research Communities by Springer Nature, please sign in