Robust evidence for theta-band rhythmicity in behavior across two dense-sampling datasets
Published in Behavioural Sciences & Psychology



Is cognition rhythmic?
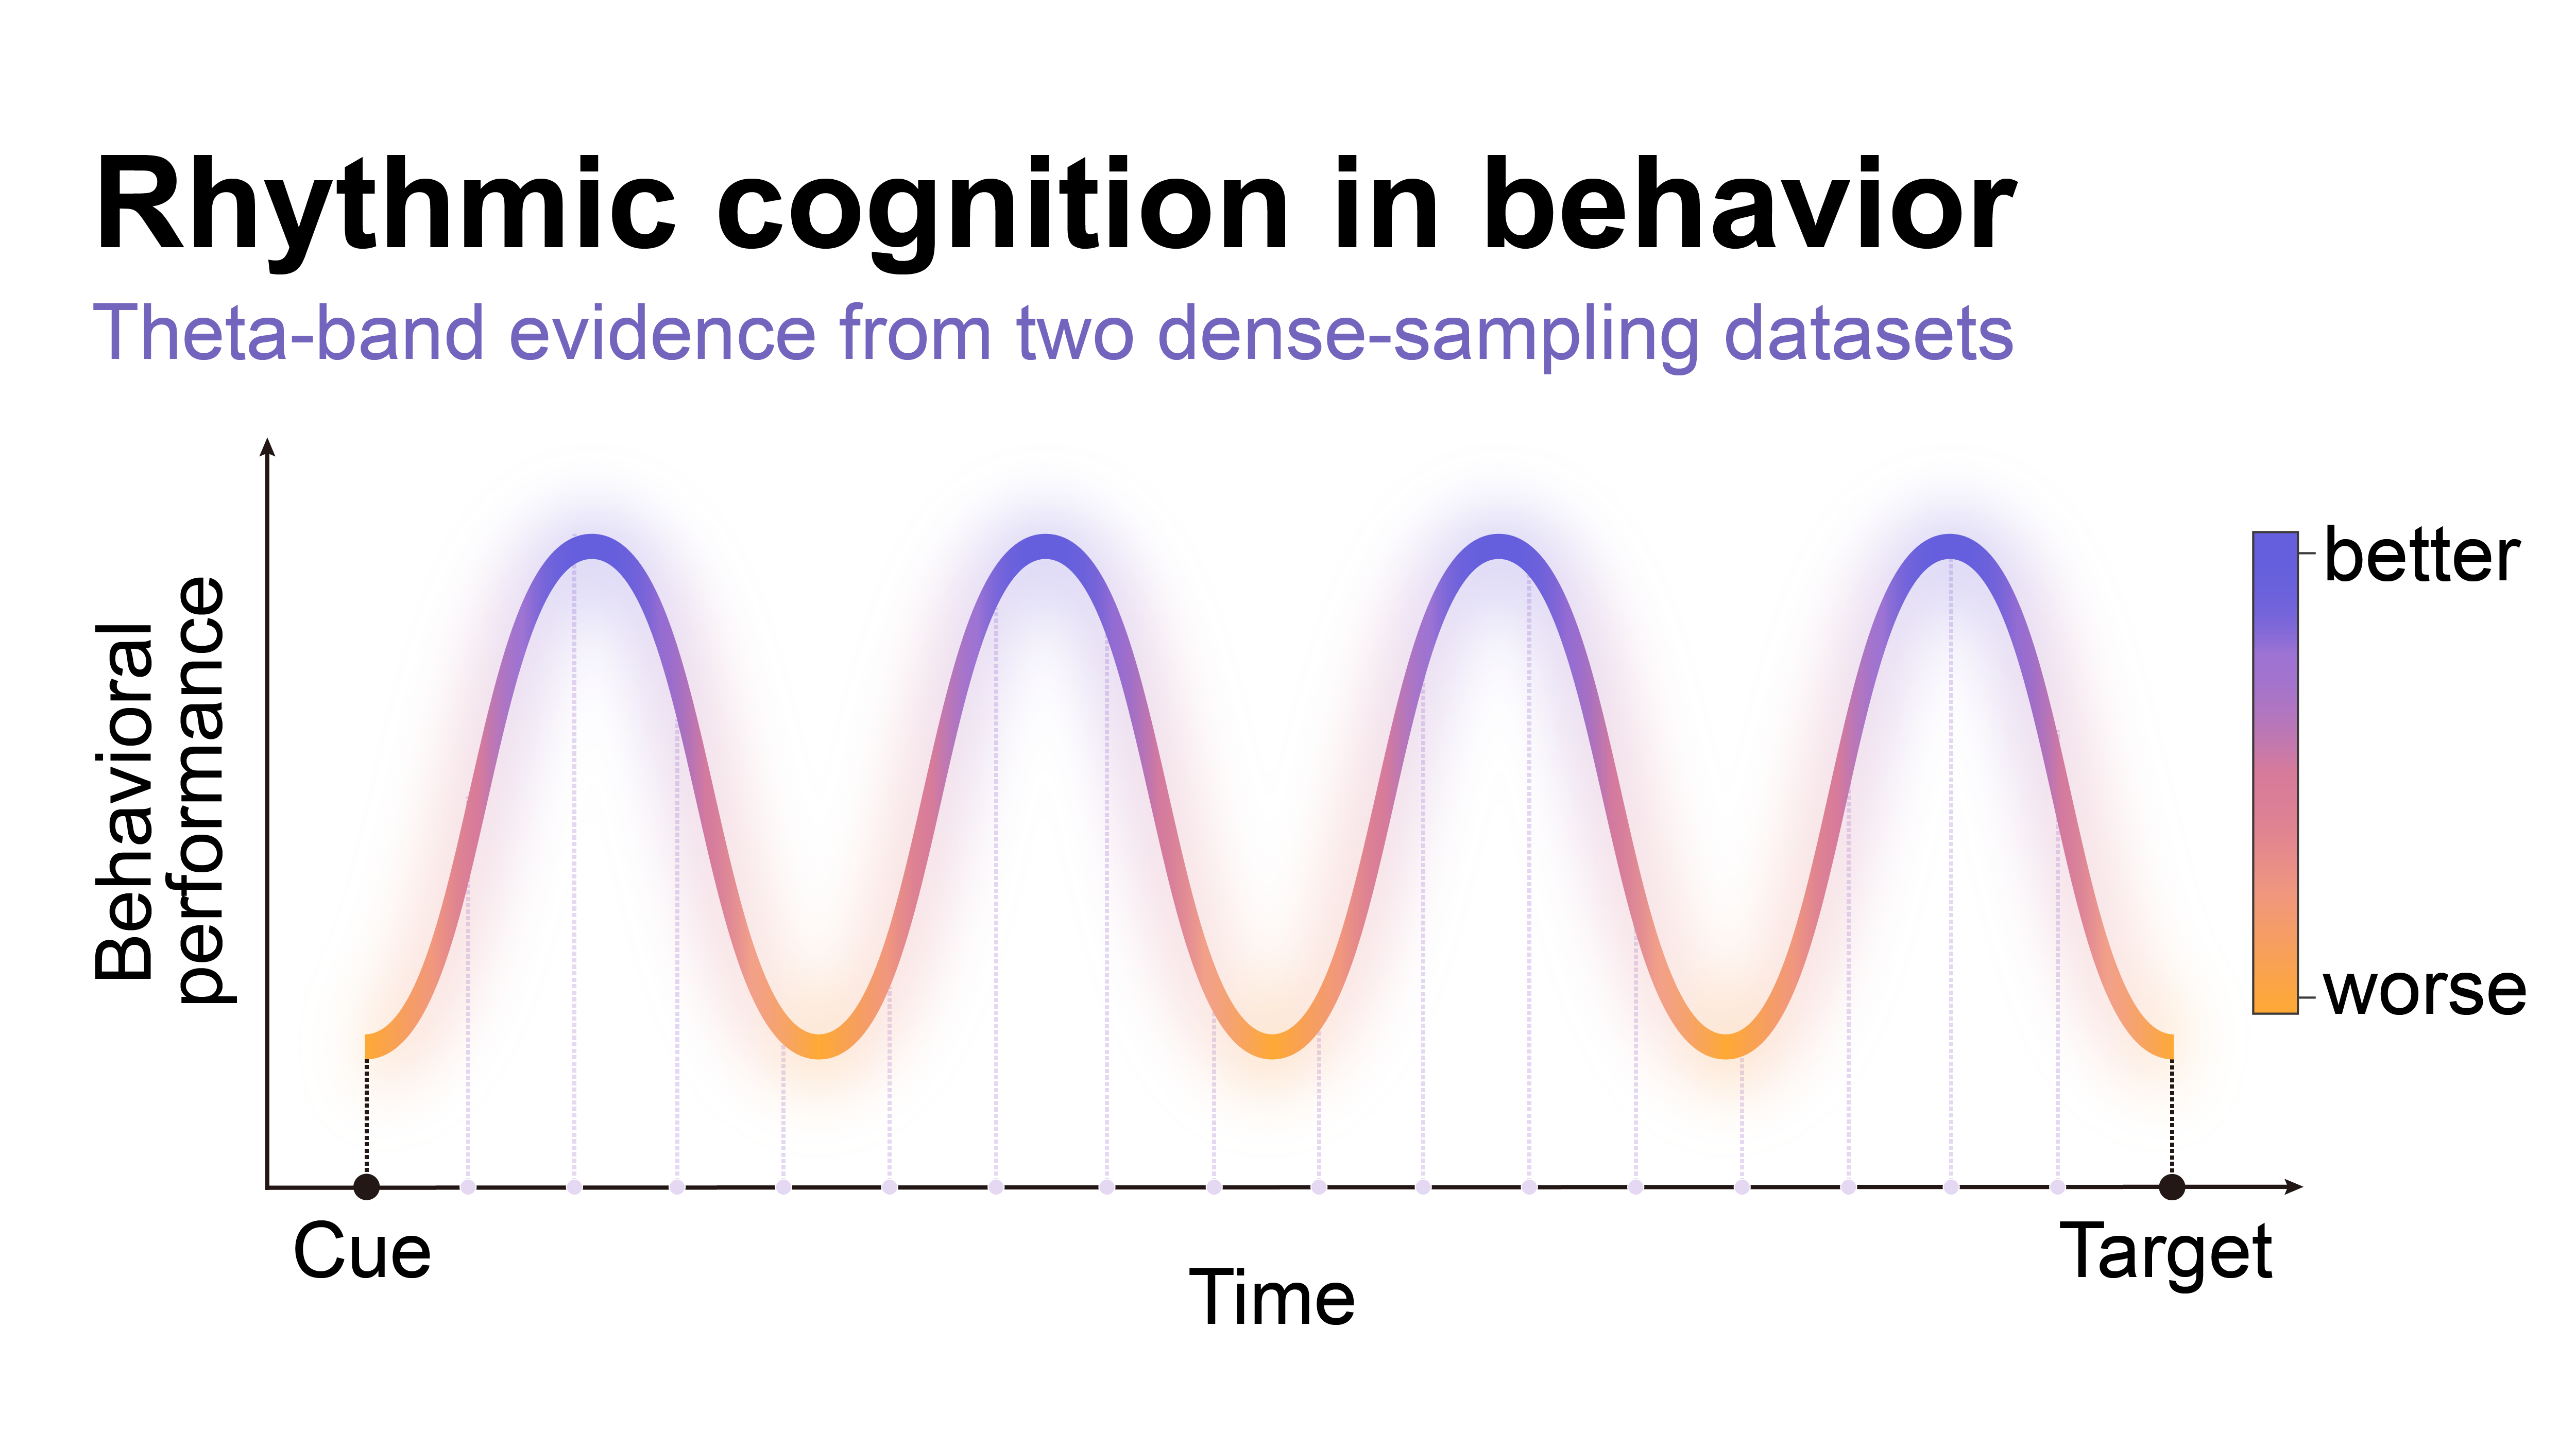
We usually experience cognition as continuous. We see something, keep it in mind, make a decision, and respond, without noticing any obvious gaps. But is this really true? An alternative view is discrete cognition. In this view, two cognitive processes (e.g., keeping information in mind and making a decision) would alternate repeatedly before finally acting upon it. This process could be implemented via neural oscillations. Brain activity is full of oscillations, rhythmic changes in neural excitability that may influence when information is processed most efficiently. Here, two cognitive processes could alternate repeatedly between the top and the trough of the oscillation. If neural rhythms indeed implement discrete cognition in this way, their effects should also be visible in behavior. Accuracy or response time would change depending on when a stimulus appears relative to an internal processing cycle (in this example, at the “keeping in mind” or “making a decision” phase of the oscillation). These periodic changes in performance are called behavioral oscillations.¹
Theta rhythms in behavior
Our starting point was a previous study on behavioral oscillations from our group². In that task, participants on each trial first saw a cue indicating the relevant visual stimulus and the response hand. The target then appeared after a variable delay. By tracking accuracy and response time across these delays, the study constructed a behavioral time course for each participant and condition. The report found that performance fluctuated in the theta spectrum (~4–8 Hz). It also suggested that this rhythm slowed down when participants had to follow more difficult task rules.
However, the original analysis had a methodological limitation. A peak in the spectrum does not necessarily mean that behavior is truly rhythmic. Noise, slow changes over time, or other non-rhythmic temporal structure can also produce apparent peaks. Given the fundamentally different view of cognition such findings would imply, our first goal was to test whether the original findings would still hold after rigorously controlling for this possibility.
A stronger test of behavioral rhythms
We reanalysed the original dataset using an autoregressive-surrogate method³. For each participant and condition, we first estimated the non-rhythmic temporal structure in the behavioral time course. We then generated surrogate time courses with similar temporal properties and compared their spectra with the spectrum of the real data. The key question was whether the real behavioral data showed stronger theta-band rhythmicity than expected from their own non-rhythmic structure.
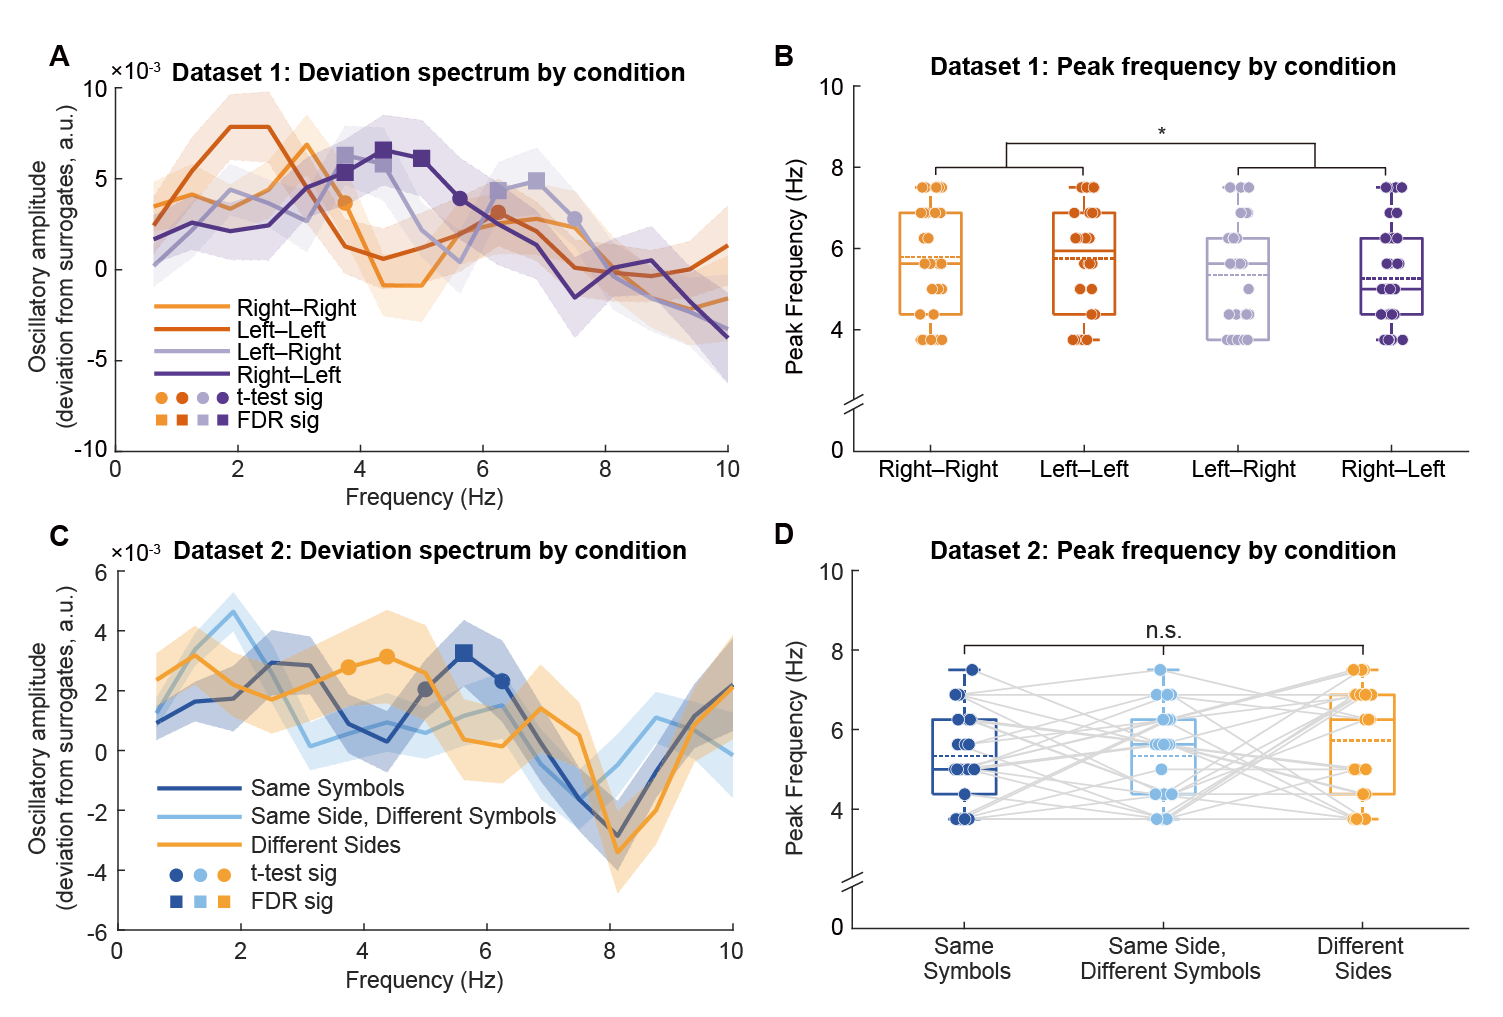
Figure 1. Accuracy-based theta rhythmicity and peak-frequency estimates across two datasets. (A) Group-mean deviation spectra for Dataset 1 (n = 34). Curves represent Right–Right, Left–Left, Left–Right, and Right–Left; shaded areas indicate ± s.e.m. Circles mark frequencies significant in one-tailed one-sample t-tests (p < 0.05), and squares mark frequencies surviving Benjamini–Hochberg false discovery rate (FDR) correction. (B) Individual peak-frequency estimates for Dataset 1. Right–Right and Left–Left are easy conditions, whereas Left–Right and Right–Left are difficult conditions. (C) Group-mean deviation spectra for Dataset 2 (n = 26), showing the “Same Symbols,” “Same Side, Different Symbols,” and “Different Sides” conditions. Significance markers are as in panel A. (D) Individual peak-frequency estimates for Dataset 2; grey lines connect observations from the same participant. In B and D, box plots show medians and interquartile ranges, points represent participants, and dashed lines indicate condition means. * indicates p < 0.05; n.s. indicates not significant.
In Experiment 1, theta-band rhythmicity was still observed in accuracy (Figure 1A). We also reproduced the earlier frequency effect in accuracy: difficult rules showed a lower theta peak frequency than easy rules (Figure 1B). The reanalysis was consistent with the original conclusion, but ruled out the possibility that it was just a by-product of non-rhythmic temporal structure.
Task demand or cue structure?
In Experiment 2, we wanted to replicate this finding, as well as control for yet another ambiguity in the original design. In Experiment 1, rule difficulty was not fully separated from cue structure. Easy rules were cued by repeated symbols, such as LL and RR, whereas difficult rules were cued by two different symbols, such as LR and RL. The frequency shift could therefore reflect task demand, but it could also reflect differences in cue ambiguity or entropy. To address this, we modified the cue design in Experiment 2. We used letter-arrow cues and included cases in which different symbols carried the same cue meaning. This allowed us to test whether any frequency shift was related to task demand itself, rather than to the structure of the cue.
In Experiment 2, we again observed theta-band rhythmicity in behavior. However, the rhythmicity was weaker and appeared less consistently across conditions (Figure 1C). The difficulty-related frequency shift also did not reappear: peak theta frequency did not reliably differ across conditions (Figure 1D). This does not rule out frequency modulation, but it suggests that peak-frequency differences are difficult to estimate when the underlying rhythmicity is weaker and more variable across conditions.
Summary
Overall, our findings support the idea that cognition is discrete, built on theta-band rhythmic structure. What remains less clear is whether the speed of these rhythms (i.e. the theta frequency) can be controlled by task demands.
References
- Xu, M., Badaya, E., Senoussi, M. & Verguts, T. Robust evidence for theta-band rhythmicity in behavior across two dense-sampling datasets. Commun Psychol. https://doi.org/10.1038/s44271-026-00500-0 (2026).
- Senoussi, M. et al. Theta oscillations shift towards optimal frequency for cognitive control. Nat Hum Behav 6, 1000–1013. https://doi.org/10.1038/s41562-022-01335-5 (2022).
- Harris, A. M. & Beale, H. A. Detecting behavioural oscillations with increased sensitivity: A modification of Brookshire’s (2022) AR-surrogate method. eLife 14, RP106141. https://doi.org/10.7554/eLife.106141.1 (2025).
Follow the Topic
-
Communications Psychology
An open-access journal from Nature Portfolio publishing high-quality research, reviews and commentary. The scope of the journal includes all of the psychological sciences.

Related Collections
With Collections, you can get published faster and increase your visibility.
Replication and generalization
Publishing Model: Open Access
Deadline: Dec 31, 2026
Stress and Health
Publishing Model: Open Access
Deadline: Nov 30, 2026


