When Industrial Faults Overlap: Behind Our Multi-Label Control-Chart Study
Published in Computational Sciences, Mechanical Engineering, and Statistics

Why one label is not enough
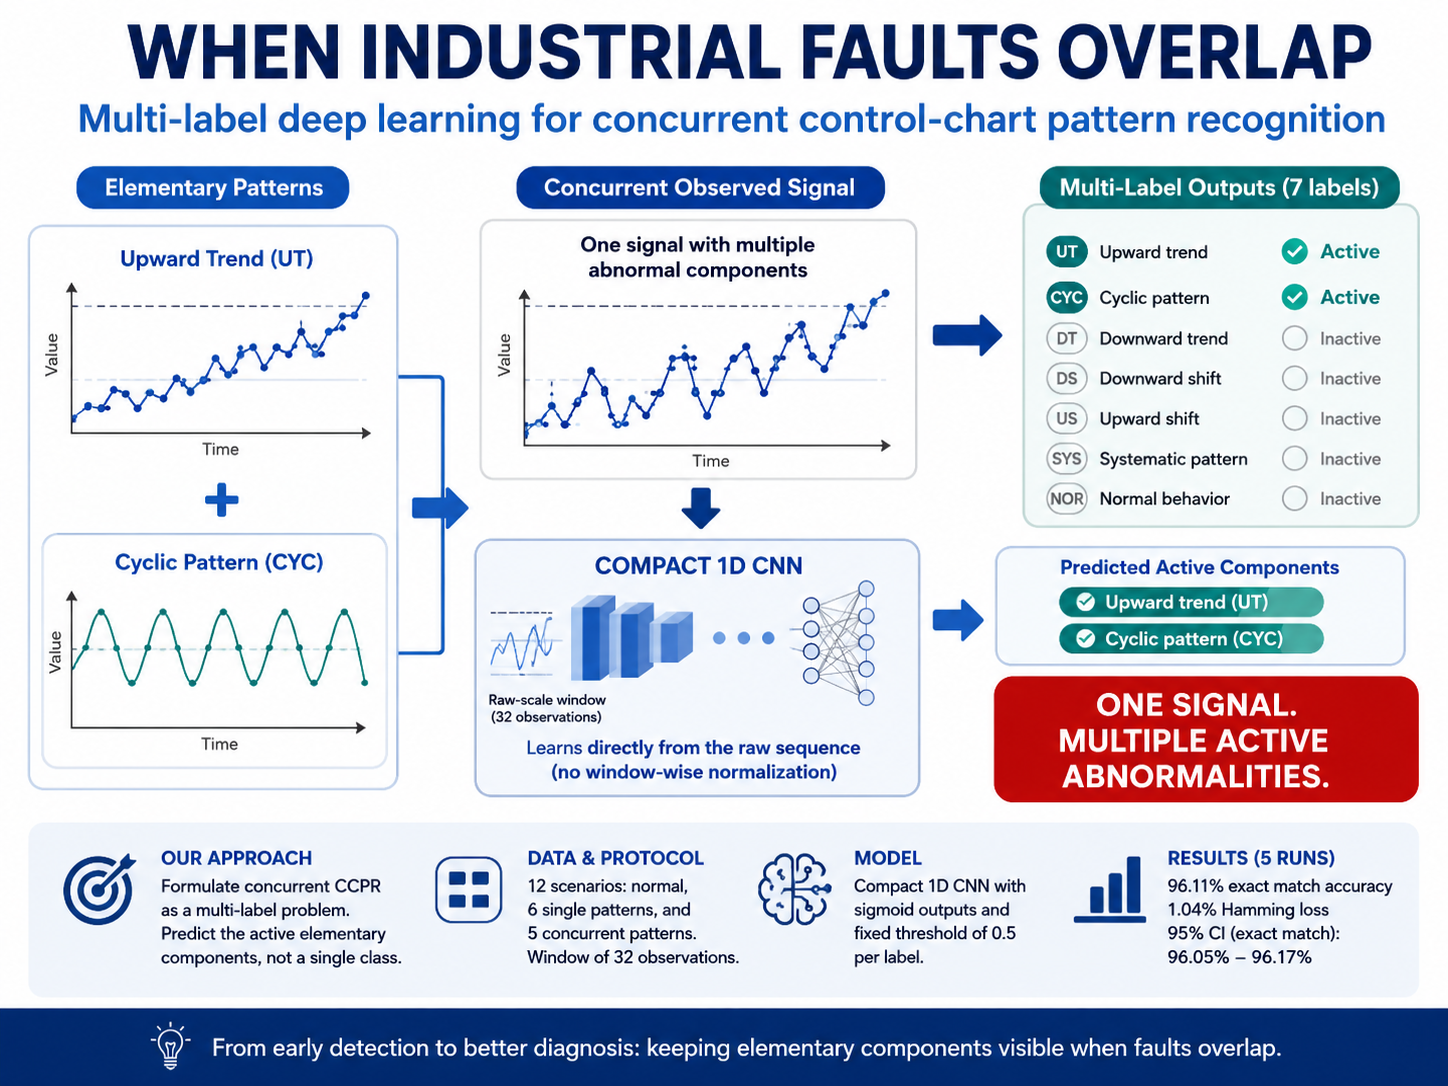
Control charts are often introduced as alarm systems: when a process leaves its normal state, the chart signals that something may be wrong. Yet the shape of the signal can contain more useful information. A trend, shift, cycle, or systematic pattern can indicate different underlying changes. The difficulty is that real processes do not always experience these abnormalities one at a time.
This observation motivated our study. Much of control-chart pattern recognition is framed as a multiclass problem, where each observation window must be assigned to one class. That assumption becomes restrictive when two abnormal behaviours occur together. A window containing both a trend and a cyclic component is not well described by forcing the model to choose only one of them. Creating a separate class for every possible combination is also difficult to scale and can hide the elementary components needed for diagnosis.
From composite classes to visible components
Our central decision was therefore to formulate concurrent control-chart recognition as a direct multi-label problem. Instead of predicting one class name, the model returns a binary vector indicating which elementary patterns are active. This keeps the components visible in the output and makes the prediction easier to interpret from a diagnostic perspective.
We built a controlled protocol containing twelve scenarios: normal behaviour, six individual abnormal patterns, and five selected concurrent patterns. Each sample consisted of a window of 32 observations. A compact one-dimensional convolutional neural network received the raw sequence and produced seven sigmoid outputs, one for each possible elementary label.
One design choice that mattered more than it may first appear was retaining the raw scale of the windows. Window-wise normalisation is often attractive because it standardises the input, but it can also weaken level information that helps distinguish shift patterns. We therefore kept the original scale and examined the model under a transparent and fixed evaluation protocol rather than searching for an unnecessarily complex architecture.
Evaluating the whole prediction, not only part of it
Multi-label outputs require more than conventional accuracy. A prediction may identify one active abnormality correctly while missing another. We therefore evaluated the model from two perspectives. Exact match required the complete label vector to be correct, while Hamming loss counted individual label errors. We also reported precision, recall, and F1-score to examine whether the model tended to create false activations or miss active components.
Across five repeated training runs, the model reached 96.11% exact-match accuracy, with 96.41% precision, 96.46% recall, 96.44% F1-score, and 1.04% Hamming loss. The 95% confidence interval for exact match was 96.05–96.17%, indicating stable performance under the selected protocol. The model was particularly reliable for cyclic and systematic behaviour.
The more difficult cases involved short shifts and some trends. In a window of only 32 observations, a late or small shift leaves limited post-change evidence, while a weak trend can resemble random variation.
What we learned behind the results
The most useful lesson was not simply that a convolutional network can achieve a high score. It was that the formulation of the output changes the meaning of the monitoring task.
A multiclass model asks:
Which single pattern is this?
A multi-label model asks:
Which abnormal components are present?
That second question is closer to the needs of diagnosis when disturbances overlap.
The study also reinforced the importance of reporting strict and label-wise metrics together. A single aggregate score can conceal whether errors come from missed components, false activations, or a small number of difficult scenarios. Pattern-level analysis showed where the model was strong and where additional data or a different monitoring design would be needed.
At the same time, restraint is essential. Our experiments used a controlled synthetic protocol with selected concurrent cases. They do not establish universal performance across every mixture, noise level, sampling regime, or industrial process. Broader combinations involving shifts, more complex overlaps, changing noise conditions, temporal autocorrelation, and external industrial validation remain open challenges.
Where the work should go next
The next step is to move from reliable recognition in a controlled benchmark toward early and actionable monitoring in real processes. This requires more than improving classification accuracy.
Future studies should consider:
- the operational cost of false alarms;
- the consequences of delayed detection;
- changing process conditions and autocorrelation;
- class imbalance;
- generalisation across production sites or equipment;
- whether predictions lead to useful operational decisions.
We are especially interested in collaborating with researchers and industrial partners who can contribute real multivariate process data, domain-defined failure scenarios, or practical measures of false-alarm and detection-delay costs.
Such collaborations could help test whether multi-label recognition can support not only better pattern identification, but also more transparent and useful industrial decision-making.
References
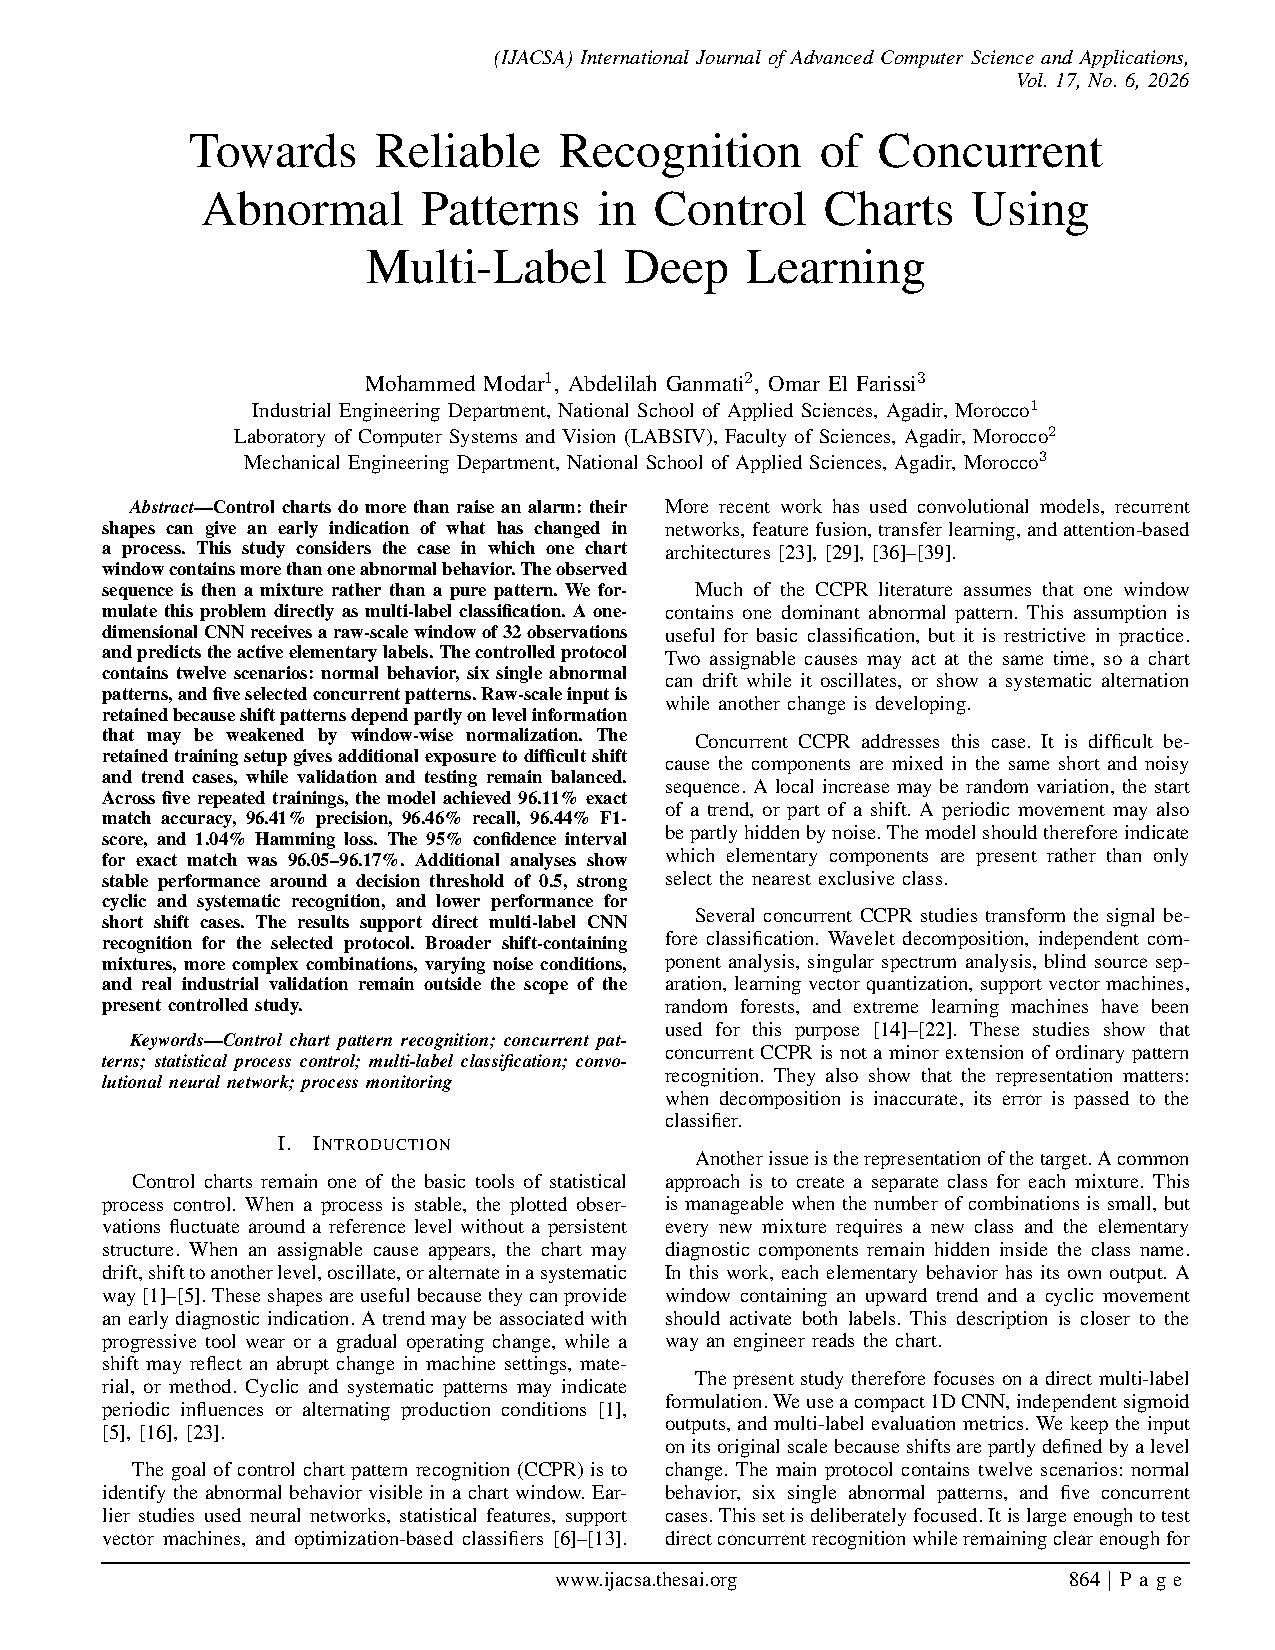
Modar, M., Ganmati, A., and El Farissi, O. (2026). “Towards Reliable Recognition of Concurrent Abnormal Patterns in Control Charts Using Multi-Label Deep Learning.” International Journal of Advanced Computer Science and Applications, 17(6). DOI: 10.14569/IJACSA.2026.0170681.
Zhang, M.-L., and Zhou, Z.-H. (2014). “A Review on Multi-Label Learning Algorithms.” IEEE Transactions on Knowledge and Data Engineering, 26(8), 1819–1837. DOI: 10.1109/TKDE.2013.39.

I am a computer science researcher based at the National School of Applied Sciences, Ibn Zohr University, Morocco. My current research focuses on intelligent industrial monitoring, multivariate control-chart pattern recognition, embedded and edge AI, robust computer vision, and secure digital systems. My doctoral research investigated compact binary biometric templates and privacy-preserving authentication on smart cards. I am particularly interested in international collaborations involving real industrial datasets, interpretable time-series models, edge deployment, field-ready computer vision, and secure embedded systems. Alongside my research activities, I serve as Head of Administrative Affairs at ENSA Agadir and contribute to engineering education in image processing, artificial intelligence, and software security.


