A bibliometric analysis of virtual influencers in the Web of Science
Published in Business & Management
Regarding the audience, our results recommend brand managers explore the role of children as influencers and pee receivers of the message.
Second, regarding the content, managers should be aware of ethical requirements to avoid legal problems.
Third, regarding the media, networks should continue to be included in a company’s communication strategy. Still, the type of social networks used should be updated, taking into account the target. In this area, a promising future is foreseen for influencer marketing through growing influencer networks such as TikTok.
Fourth, regarding the source of the message, companies must increasingly focus on the influential power of children and young people.
Fifth, regarding the industry, our results show that influencer marketing is highly recommended for entrepreneurs in tourism, food, wine-alcohol, or fashion sectors. On the contrary, communication tool has lost weight in the health industry. Celebrities in the tourism and sports industry need to be better utilised.
Lastly, regarding the methods, this paper corroborates, the usefulness of using cognitive maps to detect relevant insights regarding a specific topic and to present future trends for researchers. In this vein, we recommend managers be aware of new technologies’ advantages to measure the results of the influencer communication strategy.
METHOD
Software
Our bibliometric analysis allowed a quantitative analysis of all scientific publications indexed in the Journal Citation Reports containing the keywords “virtual influencers”, or “online influencers”, or “foodies”, or “bloggers”, or “Youtubers”, or “peer endorsement”, or “virtual endorsers”, or “online endorsers”. To this end, SciMAT software was used (Cobo, Chiclana, Collop, de Ona, and Herrera-Viedma,2013). The use of the resources of Web of Science to carry on a bibliometric analysis of generic communication themes can be shown in Muñoz-Leiva, Porcu and Barrio-García (2015) and Montero-Díaz, Cobo, Gutiérrez-Salcedo, Segado-Boj, and Herrera-Viedma (2018), among others. As Muñoz-Leiva, Porcu, and Barrio-García (2015) have explained, this software uses co-work analysis to identify the interests and aspirations of academic researchers. “This technique reduces a large set of descriptors (or keywords) to a set of network graphs that effectively illustrate the strongest associations between descriptors” (p. 682).
Data collection and data set
We retrieved the information from the ISIWeb of Science. A final set of 1740 papers containing these keywords was analysed. Citation counts to April 1, 2021, were considered (15773 citations within those papers were recorded and analysed). The period embraced was from 1999 (when the first indexed paper was published) until 2021.
Data collection was based on Cobo, Chiclana, Collop, de Ona, and Herrera-Viedma (2013), applying a de-duplicating process over the keywords. The author’s keywords and the Keywords Plus were considered to group words representing the same concept. Some keywords meaningless in this context, such as stop words or words with a very broad and general meaning (Cobo, Chiclana, Collop, de Ona, and Herrera-Viedma, 2013), were removed (for example, the generic themes “influencer” or “communication”).
To answer RQ1 and RQ2, citation analysis was used. This is a method of tracking publishing patterns based on the assumption that a heavily cited author, paper, or book is considered important by many scholars in a discipline (Kim and McMillan, 2008). To solve RQ3, three scientific maps were obtained and compared for three consecutive periods.
To avoid subjectivism, a preliminary analysis was presented at a Marketing Trends Conference in a work-in-progress session (Authors, 2023). More specifically, two steps were followed. In the first one, two anonymous reviewers of our proposal provided feedback about the content’s relevance before accepting it. In the second one, when the work in progress was presented, three skillful marketing doctors in the room helped us with the methodology to, for example, guarantee the correct grouping of the keywords to represent the same concept and to interpret the graphics properly.
Periods of time
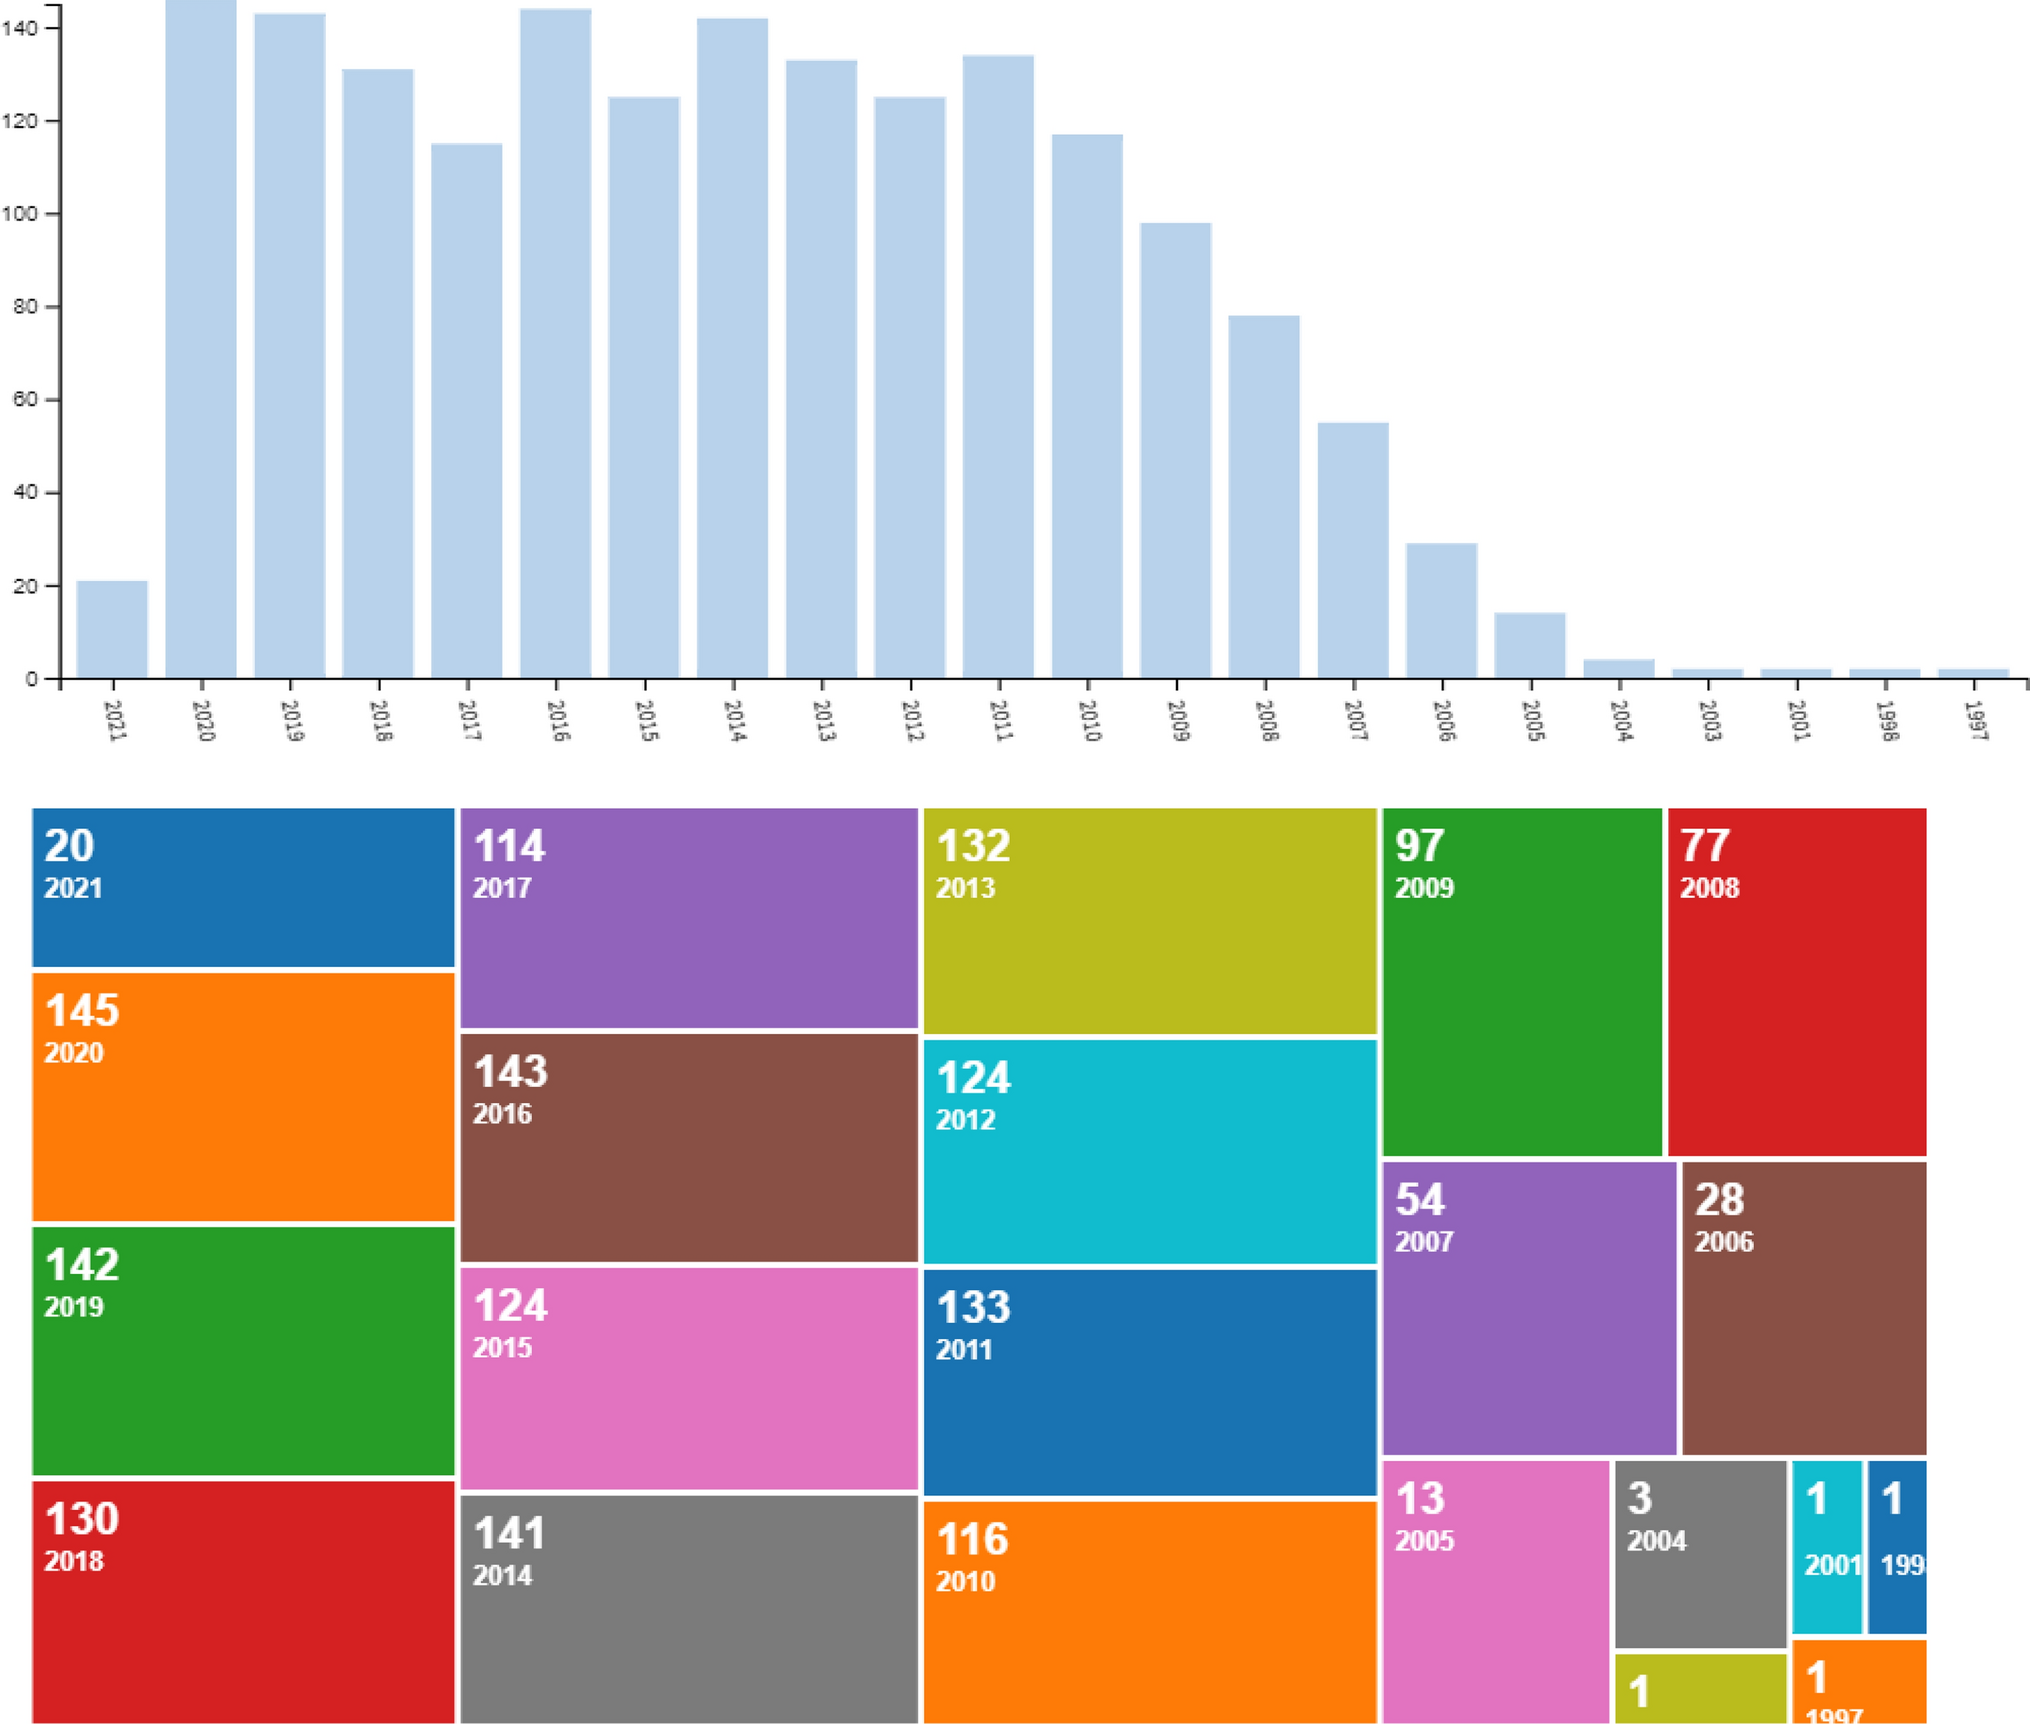
Based on the number of papers per year, three main periods were identified (Figure 1): (i) from 1997 to 2012 (649 papers), (ii) from 2013 to 2016 (540 papers) and (iii) from 2017 to 2021 (514 papers). The idea was to analyse a comparable number of papers per period. In 2013, an augment of documents was observed until 2016 because technologies advanced and social networks multiplied; then, in 2017, a second turning point was identified.

Please sign in or register for FREE
If you are a registered user on Research Communities by Springer Nature, please sign in