Annual 10m Soybean Cropland Maps: Improving Soybean Cultivation Management in China
Published in Earth & Environment and Agricultural & Food Science

Background & Aims
China is the world's largest consumer of soybeans and the fourth-largest producer, but its domestic self-sufficiency rate for soybeans is only 15%, far below the internationally recommended food self-sufficiency security level. High-resolution annual maps of soybean planting distribution are crucial for soybean cultivation management and global food security. However, China currently lacks nationwide soybean distribution maps The challenges stem from several factors:
- The collection of on-site soybean samples is time-consuming and labor-intensive, and the scarcity of samples poses a significant obstacle to model training and data validation.
- China's predominant small-scale farming economy results in fragmented and complex land parcels, especially with the recent government encouragement of "corn-soybean intercropping techniques," making accurate soybean identification even more challenging.
- The quality of optical remote sensing imagery is susceptible to cloud and rain interference, leading to a lack of extensive image data in some regions during the soybean growing season.
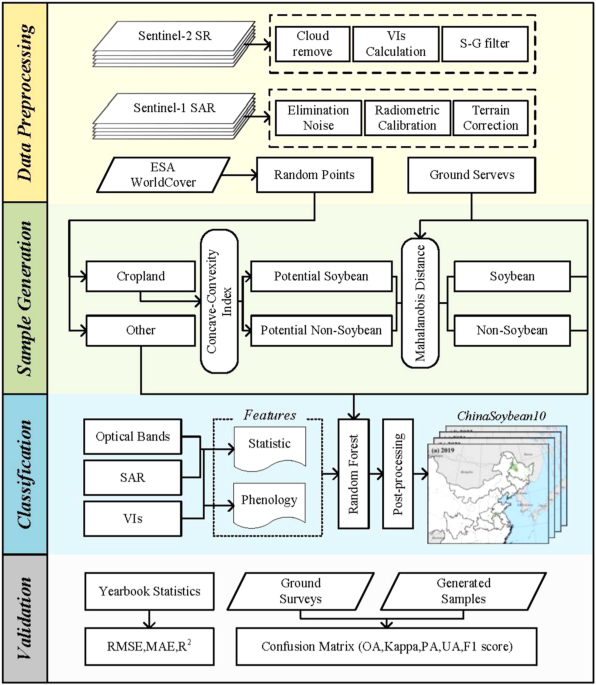
Addressing these issues and challenges, our team has developed a method for sample spatiotemporal migration and soybean identification based on vegetation index time series characteristics. Utilizing Sentinel-1/2 remote sensing data, we have produced 10-meter resolution maps of soybean cropland in China from 2019 to 2022. These data will facilitate the analysis and improvement of soybean production practices in China.
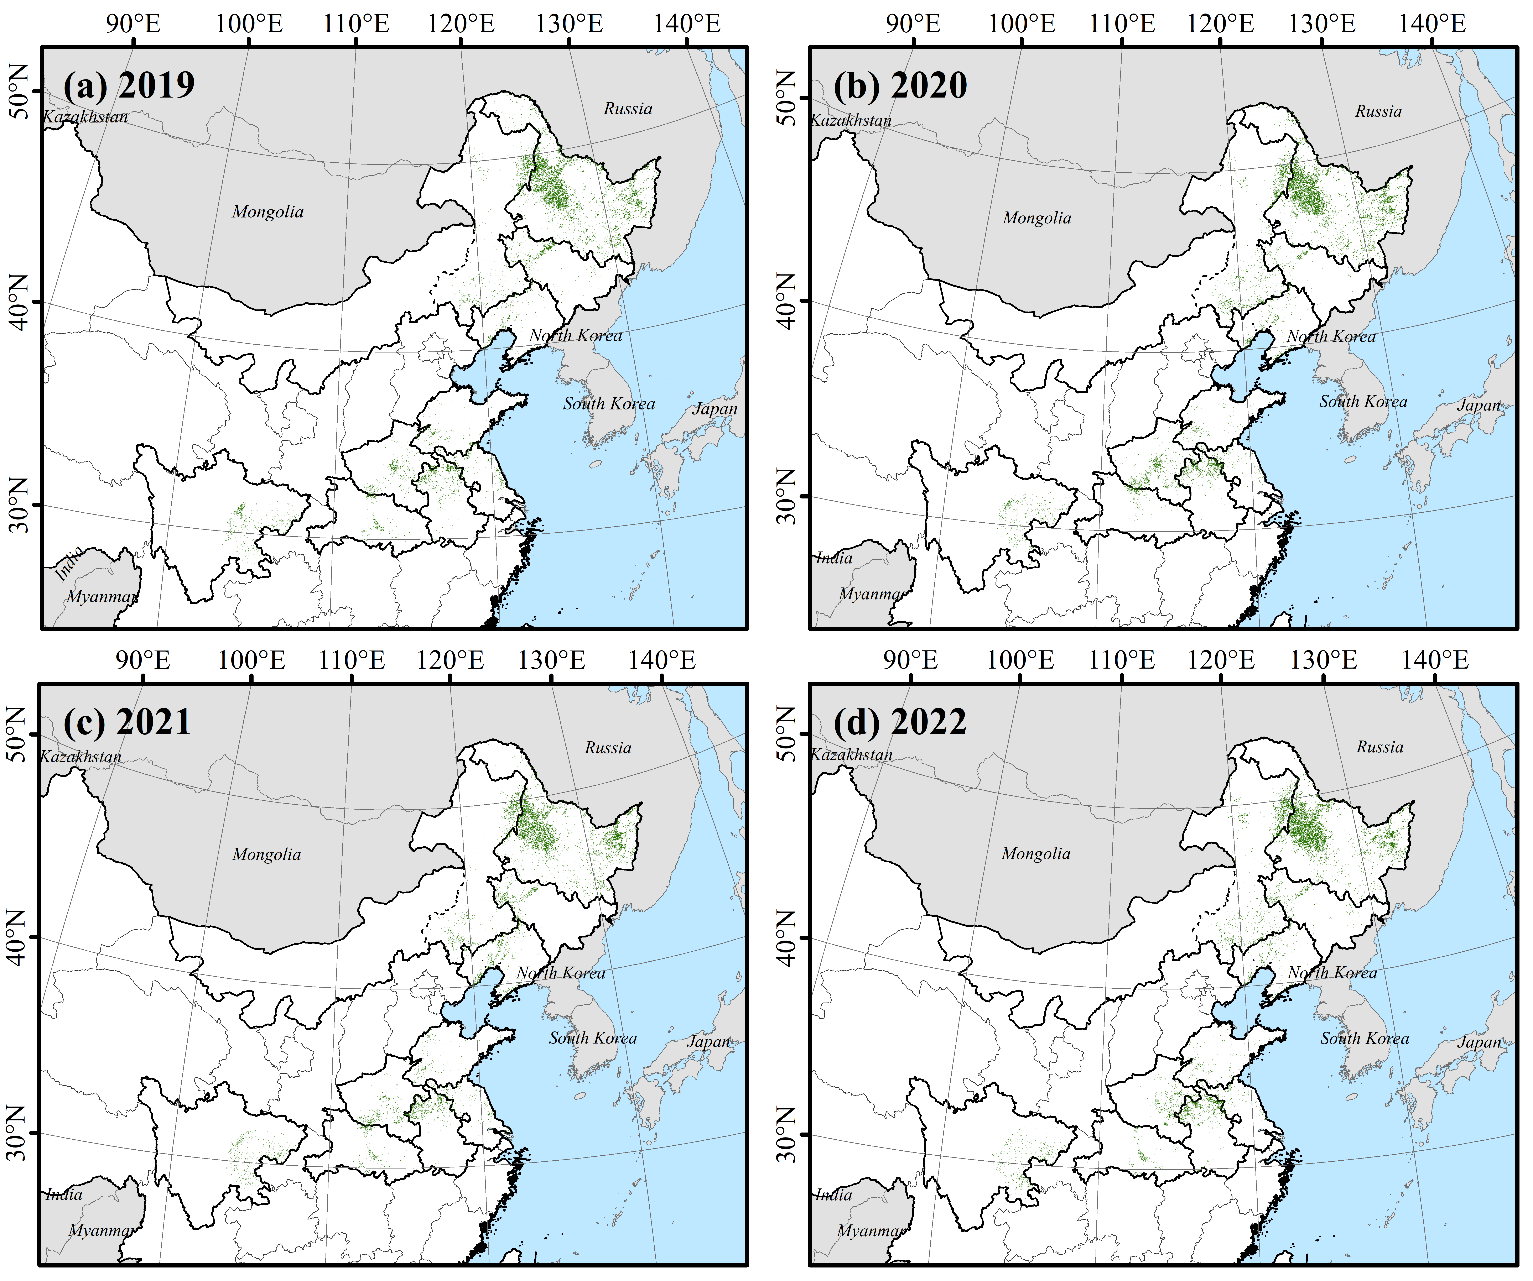
Figure 1 Soybean cropland maps in China from 2019 to 2022
How did we make these maps?
Using traditional agricultural field surveys to create a nationwide soybean distribution map is nearly impossible, as it would require enormous labor, time, and cost. The emergence of remote sensing technology has made this task feasible, as remote sensing imagery offers macroscopic, objective, and continuous observations, holding immense potential for crop identification and monitoring. Leveraging Sentinel-1/2 time series remote sensing imagery, we extracted soybean's full growth season characteristics from a combination of optical and SAR (Synthetic Aperture Radar) data. We then utilized Random Forest to train regional soybean classification models and produced the soybean planting distribution map for China.
Label data is indispensable for supervised classification. Our team conducted field sample collection in multiple provinces across China from 2019 to 2022. However, the temporal and spatial coverage of samples remains limited, insufficient to support nationwide soybean mapping. Therefore, we considered spatiotemporal migration based on existing soybean samples, conducting in-depth analysis of the physical and chemical differences between soybeans and other crops during their growth process. We proposed a method based on soybean growth phenology information and spectral time series features for soybean sample spatiotemporal migration.
Step One
Generate a large number of farmland and non-farmland sample points based on the ESA WorldCover land cover dataset.
Step Two
Utilize the Concavity-Convexity Index (CCI) to partition random farmland samples into potential soybean and non-soybean samples, leveraging the characteristic of soybeans having higher chlorophyll content in comparison to crops such as peanuts and cotton.
Step Three
Construct two sets of feature spaces containing six bands and vegetation indices based on the characteristics of soybeans in terms of greenness, moisture content, and red-edge bands. Calculate the Mahalanobis distance and its probability distribution between potential soybean points and measured points in the feature space, and then select stable and reliable soybean samples.
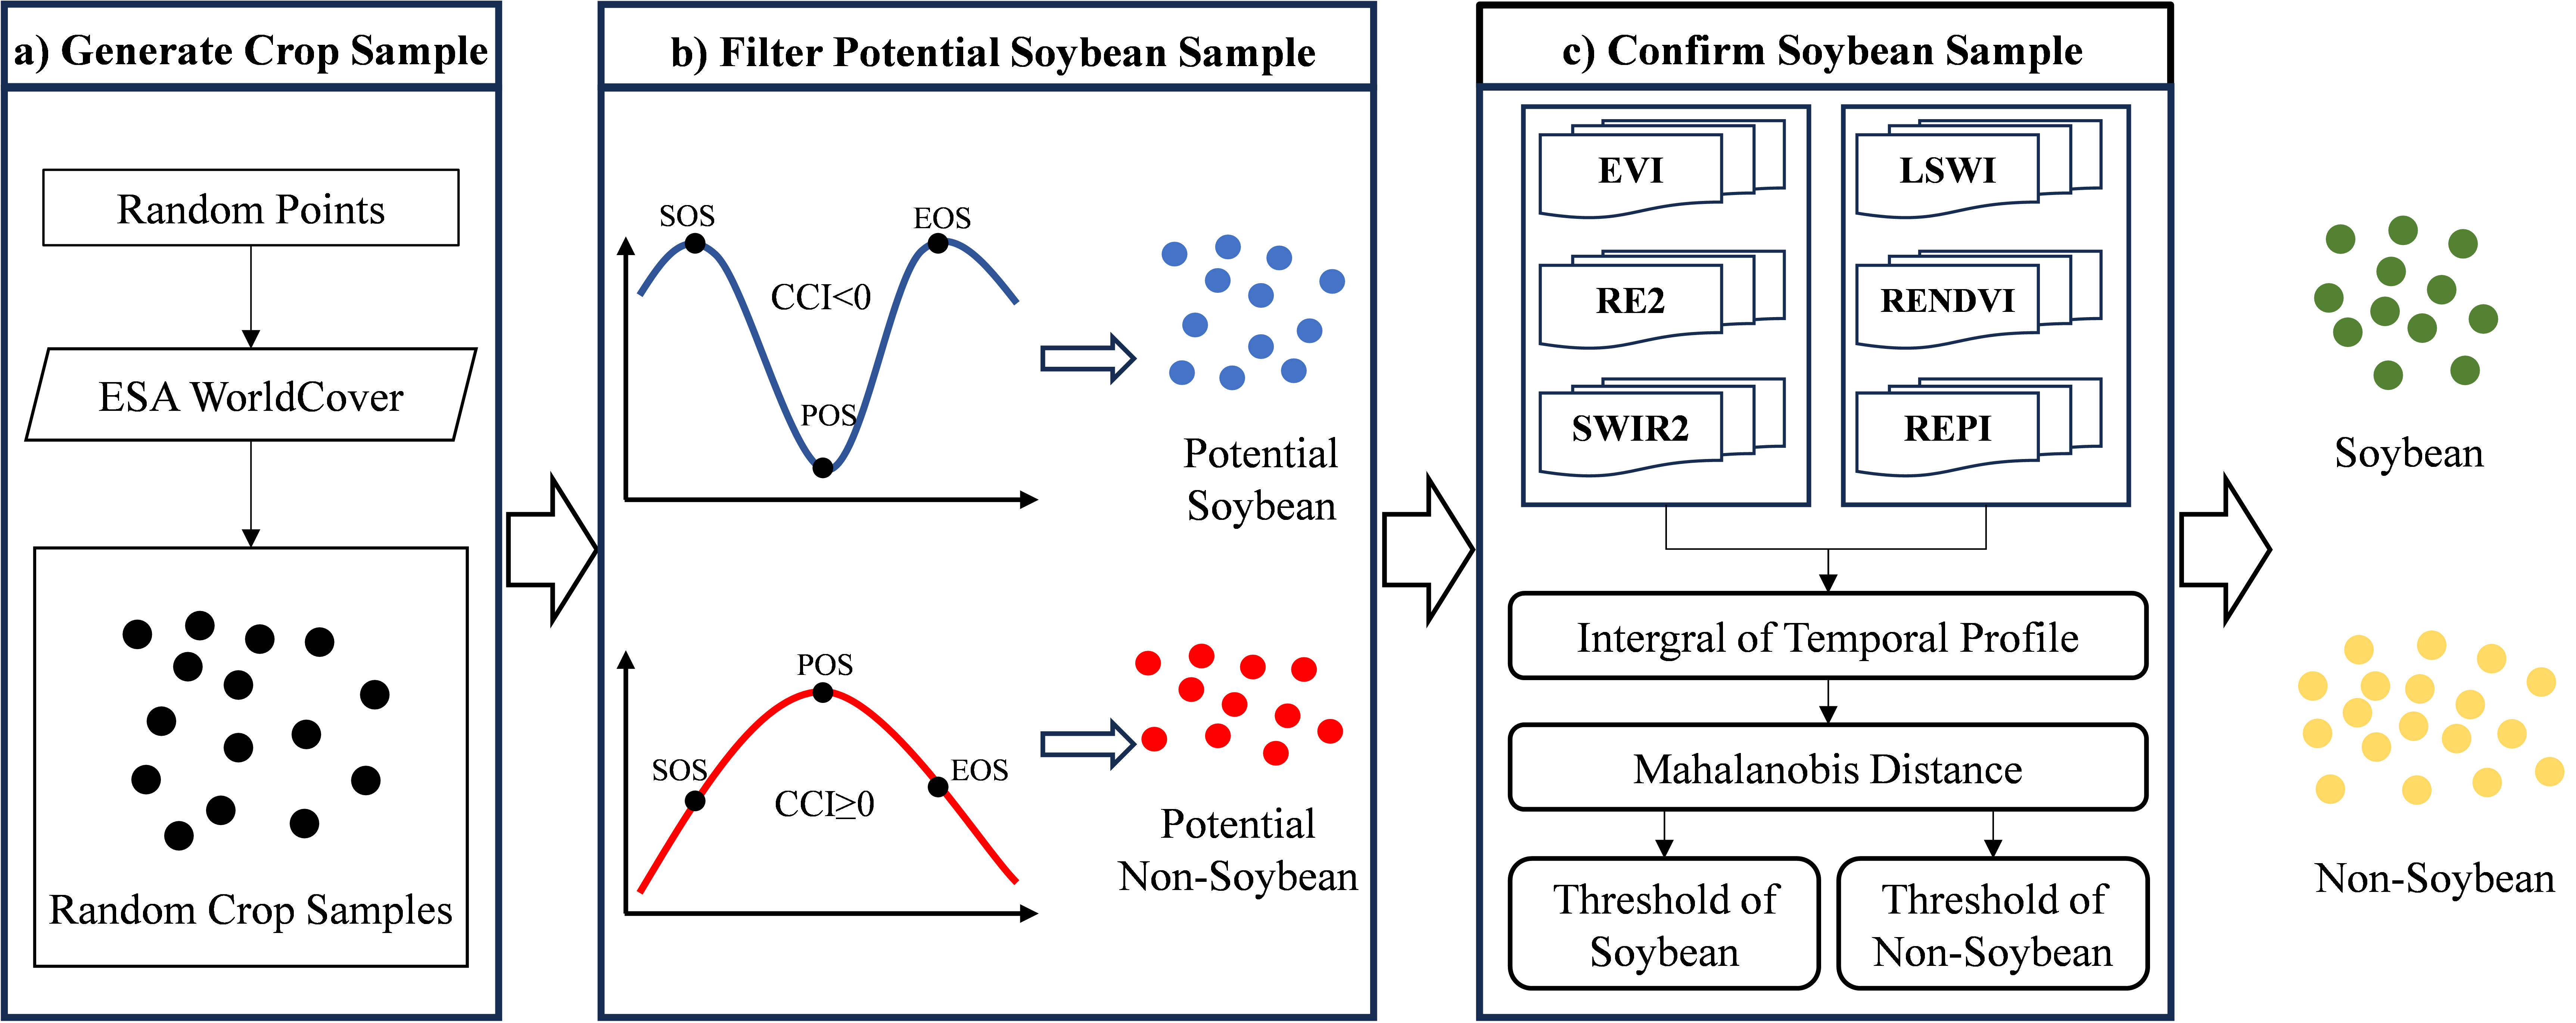
Figure 2 Soybean sample migration method
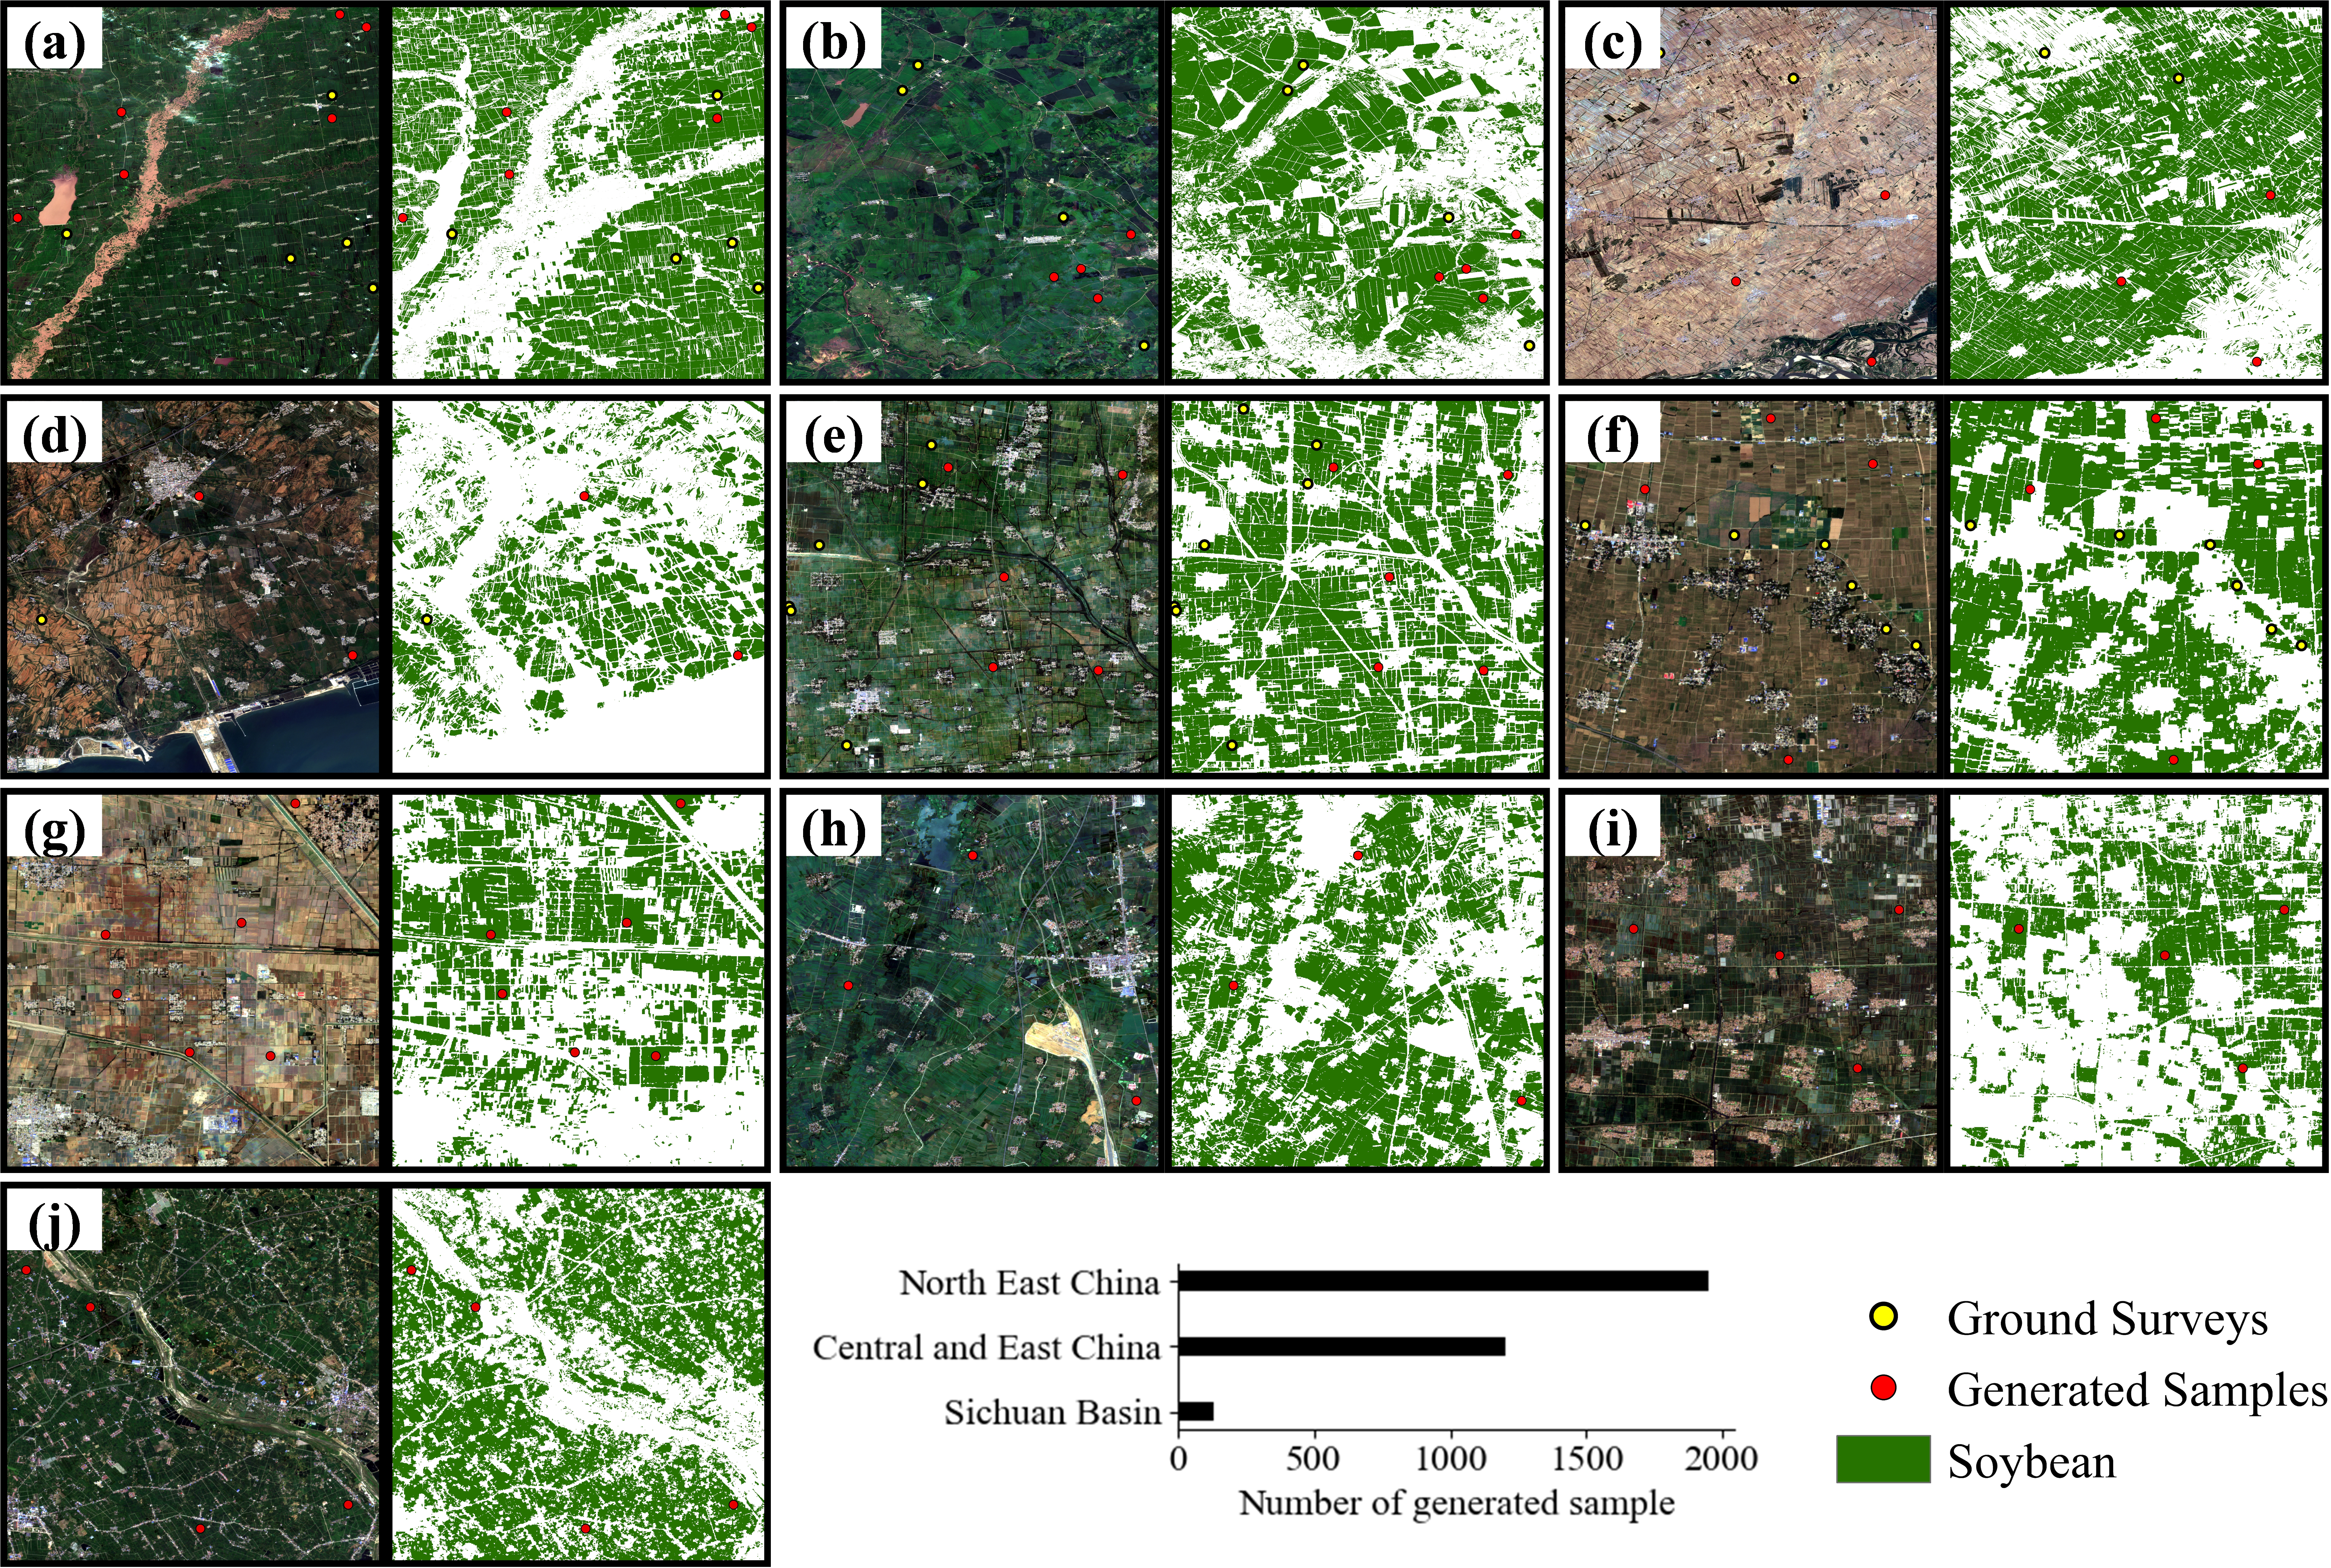
Figure 3 Spatial distribution of generated soybean samples
Our creation of the multi-year soybean distribution maps was conducted independently for different years and provinces. Years and regions with field survey samples were given priority for model training. For years and regions without field survey samples, we generated samples for mapping based on soybean samples from similar climatic zones. The design and construction of the mapping framework have been completed in our previous work, encompassing image preprocessing, feature parameter selection, feature extraction, and land cover classification. This framework can accurately identify soybeans even in complex areas with intricate planting structures. We established workflows in Google Earth Engine (GEE) and utilized its massive data storage and powerful computing capabilities to complete product production. Through visual comparisons with some mainstream products in local areas, we found that our product exhibited good consistency with them, and certain misclassification issues present in other products were not observed in ours.
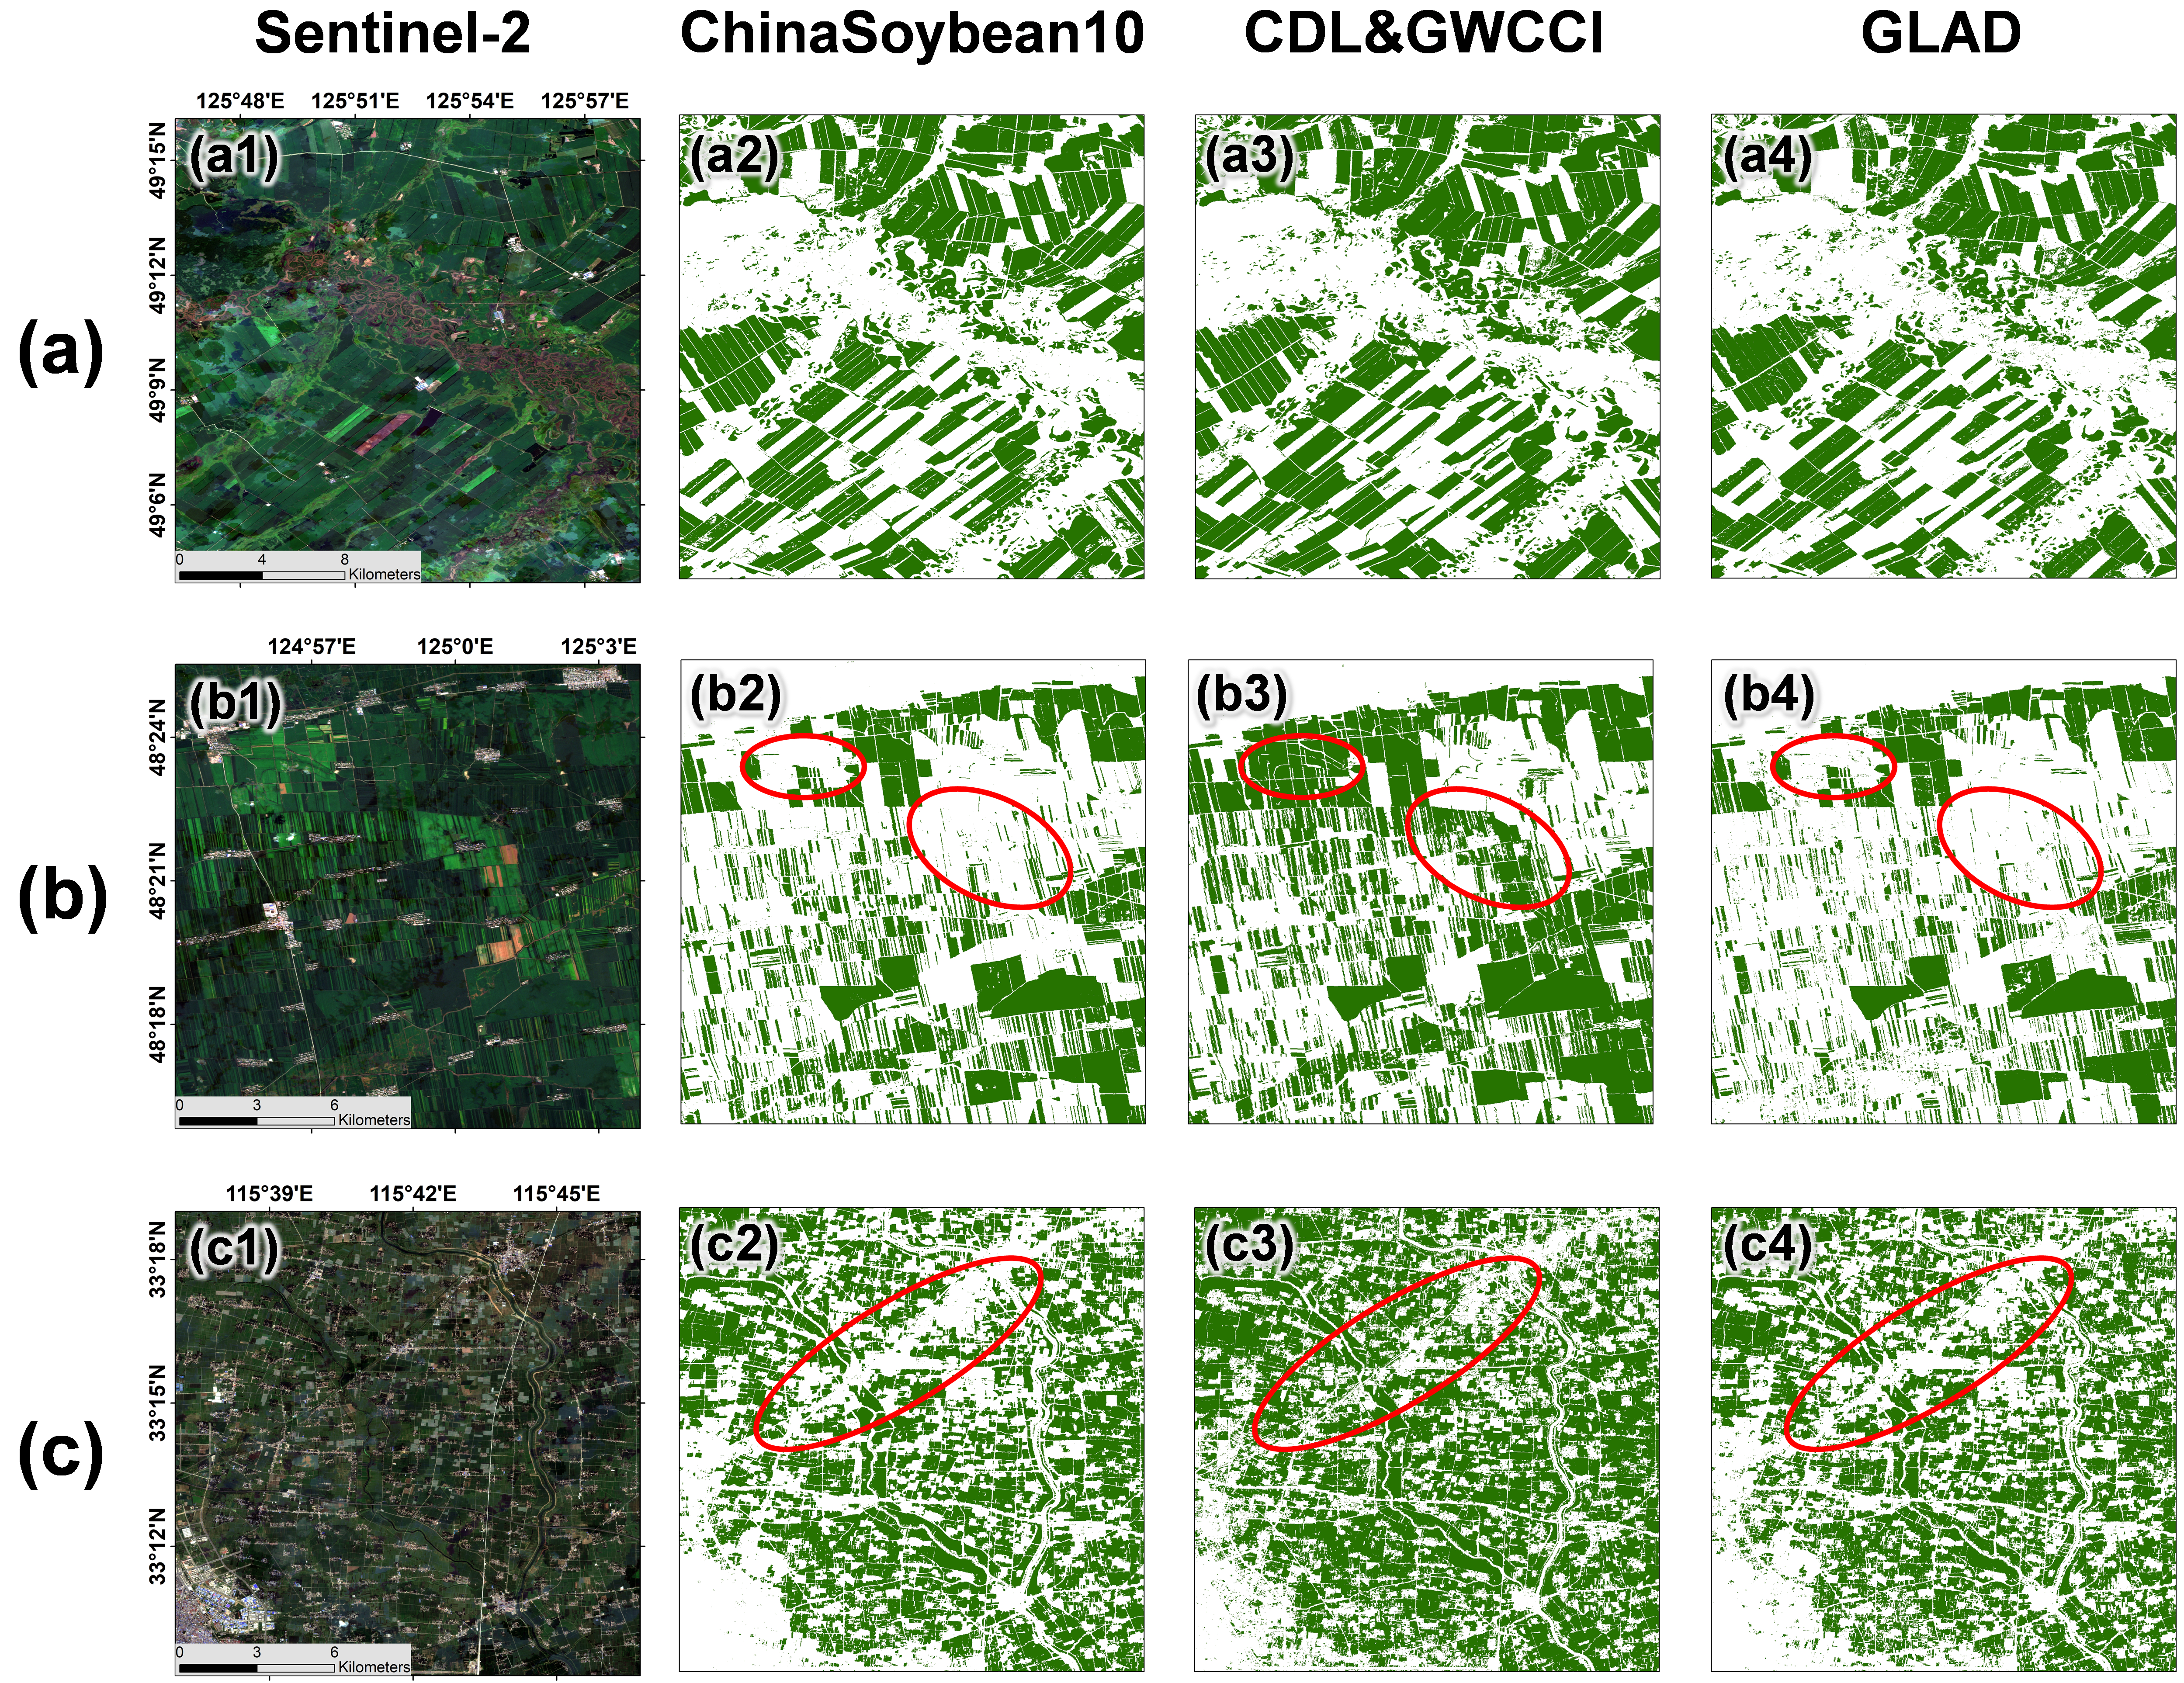
Figure 4 Visual comparison of our products with other mainstream products
Future outlook
Our work has created multi-year 10-meter resolution maps of soybean planting distribution in China, filling the data gap in this field. This data can be used to estimate soybean crop yields, analyze the spatial patterns of soybean cultivation, and thereby contribute to improving soybean production and management practices in China. This is of significant importance for ensuring global food security. In the future, we will focus on developing cost-effective and more accurate soybean mapping methods. We aim to produce soybean maps with longer time series and broader coverage, striving to achieve near real-time extraction and operationalization of soybean planting in major soybean-producing regions globally.
Follow the Topic
-
Scientific Data
A peer-reviewed, open-access journal for descriptions of datasets, and research that advances the sharing and reuse of scientific data.

Related Collections
With Collections, you can get published faster and increase your visibility.
Genomics in freshwater and marine science
Publishing Model: Open Access
Deadline: Jul 23, 2026
Genomes of endangered species
Publishing Model: Open Access
Deadline: Jul 01, 2026


Please sign in or register for FREE
If you are a registered user on Research Communities by Springer Nature, please sign in