How Do You Find Patterns in Biological “Noise”? A Journey into Low-Complexity Regions
Published in Protocols & Methods

If you zoom into a protein sequence, what you see is a long string of letters—amino acids arranged in a precise order. At first glance, it looks like well-organised code.
But look closer, and things get… messy.
You’ll start noticing stretches where the same few letters repeat again and again. Regions that look almost too simple compared to the rest of the sequence. For a long time, scientists weren’t quite sure what to make of these segments.
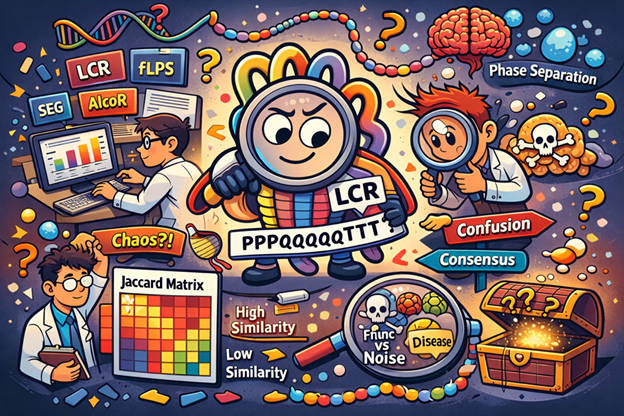
These are called low-complexity regions (LCRs)—and they’re far more important than they appear.
From “Junk” to Functional Gold
LCRs were once dismissed as evolutionary leftovers—quirks of DNA replication with little real function. But over time, that view has changed dramatically.
We now know that these regions:
- Help proteins interact with other molecules
- Contribute to structural flexibility
- Play roles in phase separation—a process essential for organising cellular components
- Are linked to diseases like Huntington’s, where repeat expansions disrupt normal function
In fact, nearly 20% of human proteins contain these regions.
So the real question is no longer “Do LCRs matter?”
It’s “How do we reliably find and study them?”
The Problem: Everyone Detects Them Differently
Here’s where things get tricky.
There isn’t just one way to detect LCRs—there are many computational tools, each built on a different idea of what “low complexity” actually means.
Some tools look for:
- Repetitive patterns (like tandem repeats)
- Compositional bias (too much of one amino acid)
- Statistical deviation from randomness
- Even visual self-similarity using dotplots
Naturally, they don’t always agree.
Run different tools on the same protein, and you might get completely different answers.
So which one is right?
Benchmarking the Chaos
This is the core problem my research addresses.
Instead of trusting a single method, I built a comprehensive benchmarking framework to compare multiple LCR detection tools across the entire human proteome (over 20,000 proteins).
The idea was simple:
Let’s not ask which tool is best—let’s understand how they differ.
To do this, I:
- Standardised outputs from different tools into a common format
- Compared them across multiple dimensions:
- Length of detected regions
- Coverage within proteins
- Amino acid composition
- Sequence complexity (via Shannon entropy)
- Analysed how much different tools agree with each other
What We Found (And Why It Matters)
The results were revealing.
1. There is no “one-size-fits-all” tool
Some tools are very sensitive, detecting large portions of proteins as low-complexity. Others are extremely strict, picking only the most obvious repeats.
This means:
The tool you choose directly shapes the biology you “see.”
2. Agreement between tools tells a story
When multiple tools detect the same region, something interesting happens:
- These regions tend to be longer
- More repetitive
- More compositionally pure
- And have lower entropy (i.e., less randomness)
In other words:
The more tools agree, the more “classical” the LCR becomes.
3. Low complexity isn’t black-and-white
One of the most important insights:
LCRs don’t exist as a strict category—they form a continuum.
Instead of a sharp boundary between “low” and “high” complexity, we see a gradual transition. Some regions sit in a grey area—part structured, part repetitive.
This challenges the idea that we can neatly classify sequences.
4. Different tools capture different biology
- Some methods are better at finding highly repetitive motifs
- Others capture subtle, compositionally biased regions
- Some focus on structure-like patterns, others on statistical anomalies
So rather than competing, these tools are actually:
Complementary lenses looking at the same biological landscape.
Why This Work Matters
If you’re studying proteins—whether in evolution, disease, or structural biology—LCRs are impossible to ignore.
But using the wrong detection approach can:
- Overestimate their presence
- Miss biologically relevant regions
- Or bias downstream analysis
This benchmarking framework provides:
- A unified way to compare tools
- Guidelines on which tools to use and when
- A deeper understanding of what “low complexity” actually means
The Bigger Picture
Science often progresses by refining definitions.
Low-complexity regions are a perfect example:
- Once ignored
- Then loosely defined
- Now understood as diverse, functionally important, and method-dependent
What looks like “simple repetition” at first glance turns out to be a rich and nuanced feature of biological sequences.
Final Thought
When we look at biological data, we often assume complexity is where the meaning lies.
But sometimes, it’s the simplest patterns—the repeats, the biases, the irregularities—that carry the deepest insights.
The challenge is not just detecting them.
It’s learning how to interpret them correctly.
Follow the Topic
-
Scientific Reports
An open access journal publishing original research from across all areas of the natural sciences, psychology, medicine and engineering.

Related Collections
With Collections, you can get published faster and increase your visibility.
Phytochemicals and health
Publishing Model: Open Access
Deadline: Jul 28, 2026
Infectious disease diagnostics
Publishing Model: Open Access
Deadline: Sep 23, 2026


Please sign in or register for FREE
If you are a registered user on Research Communities by Springer Nature, please sign in