When the Caribbean Sea changed its behaviour: 46 years of extreme waves and what they reveal about coastal risk
Published in Earth & Environment and Statistics


There is a paradox that obsessed me for months.
In the western Caribbean Sea, September —the peak month of hurricane activity— is also one of the months with the lowest mean wave height.
The most destructive cyclones pass through this region, yet the monthly average sea state is near its annual minimum.
How can that be?
The answer lies in the difference between the mean state of the sea and its extremes.
Hurricanes are episodic phenomena. They generate wave peaks that last hours or days and can dominate the tail of the distribution —the rare and extreme events— but contribute relatively little to the monthly average. The rest of the time, the western Caribbean is dominated by much more moderate conditions, mainly associated with trade winds and background swell.
That paradox was the starting point of a study just published in Theoretical and Applied Climatology.
I analysed 46 years of wave data, from 1979 to 2024, and what I found was more interesting than the initial paradox.
Three seas in one
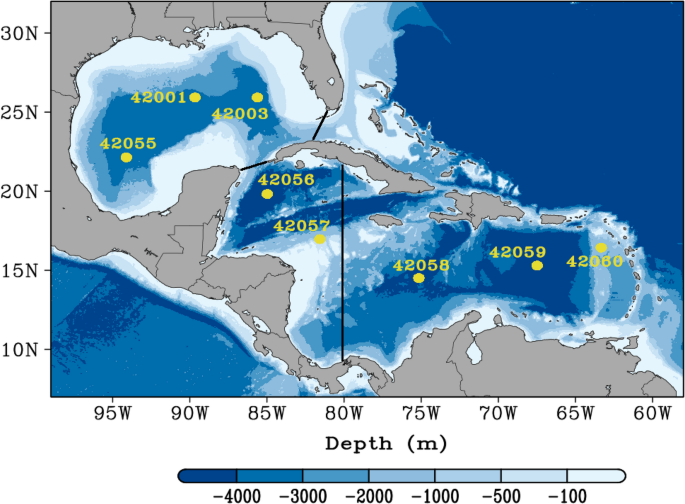
The Gulf of Mexico and the Caribbean Sea do not form a single wave regime.
The analysis identifies three physically distinct regions, with different dominant mechanisms and extreme behaviours:
The eastern Caribbean, where trade winds and the Caribbean Low-Level Jet provide relatively persistent forcing. It shows the highest mean wave height of the three regions (1.60 m), but also the lowest relative variability (coefficient of variation, CV = 0.38).
The western Caribbean, where tropical cyclones have a much greater episodic influence on extremes. Here, a significant part of extreme variability depends on the occurrence and track of these systems.
The Gulf of Mexico, where cold fronts and the so-called Nortes generate episodes of intense waves, especially during winter. It is the region with the highest relative variability (CV = 0.54) and the highest extremity index.
Three regions, three physical regimes, and three different ways of responding to climate variability.
The finding I did not expect
When I started the trend analysis, I expected to find a widespread increase in extreme waves.
But the results showed something much more specific: the change is not distributed uniformly in time or space.
During the cyclone season (August–October), the 99th percentile of significant wave height (Hs99) shows spatially extensive and statistically significant positive trends in the northwestern Caribbean.
In this region, the trend reaches +0.254 m per decade, with pointwise values of up to +0.606 m per decade. 33% of grid points show significant trends after correction for multiple comparisons.
The contrast with the cold-front season (November–January) is striking.
During that season, only 3.3% of grid points show statistically significant trends.
The result, therefore, does not point to a uniform change in the entire wave regime. The signal is concentrated particularly in the extremes of Hs during the cyclone season.
And that changes how we should look at the problem.
The 1995-1996 break
The Pettitt test identified a dominant regime shift around 1995-1996, especially in the northwestern Caribbean.
That period coincides in time with the transition of the Atlantic Multidecadal Oscillation (AMO) to its warm phase, as well as with documented changes in Atlantic cyclone activity.
Temporal coincidence alone does not prove causality. But it provides a coherent physical context for interpreting the observed change in the extreme wave regime.
To analyse it in more detail, I divided the record into two epochs:
Epoch 1: 1979-1995
Epoch 2: 1996-2024
And then a particularly marked difference appeared.
In a group of contiguous grid points in the northwestern Caribbean where the change is high and surrounded by equally high changes —what spatial analysis calls a "high-high" cluster—, the 50-year return level went from:
5.90 m → 9.81 m
while the estimated spatial mean increase was:
ΔTR50 = +4.23 ± 1.84 m
That is a substantial difference in the magnitude of the extremes estimated between the two epochs.
And here is the important part
A return period is not simply a way of saying that "something happens every 50 years".
It represents a statistical frequency associated with a given extreme level.
So when the 50-year return level changes, the statistical reference we use to characterise extreme events also changes.
A 50-year level estimated from one historical period does not necessarily represent the same extreme level under a different climate regime.
That is one of the central messages of this study.
It is not enough to ask how much the mean wave conditions have changed.
We also need to ask what is happening in the tail of the distribution.
What this means for coastal risk
This is where the results stop being purely statistical.
Extreme wave levels are fundamental information for the design and assessment of coastal infrastructure: ports, coastal defences, energy facilities, desalination plants, and other structures exposed to the sea.
If the statistics used to estimate those extremes come from a period that mixes different climate regimes, the design levels may not adequately represent the most recent extreme regime.
Therefore, one of the practical implications of this work is simple:
extreme value statistics should not necessarily be considered stationary in regions where the climate regime has changed.
Climate history matters.
And, for extremes, what matters especially is what happens in the most recent years of the record.
What comes next
This study focuses on significant wave height (Hs) and how its extremes have changed between the two epochs.
But an extreme sea state is not defined by its height alone. Its peak period (Tp) also matters, and so does the relationship between the two variables.
The next step in this research line is to analyse the joint structure of Hs and Tp using copulas, to see whether the intensification of Hs extremes is accompanied by changes in their relationship with peak period. That work is currently under review.
The question is not only whether extreme waves have become more intense. It is also whether the way Hs and Tp co-occur has changed, and what that implies for compound risk.
A personal note
I did this work from Cuba, with limited resources, using publicly available data and open statistical tools.
I did not have access to large computing clusters or a large research team.
But I did have access to something that, in scientific research, can be just as important: a question I could not let go of.
The question was simple:
Why can the peak month of hurricane activity also be one of the months with the lowest mean wave height?
The answer took me much further than I expected.
It led me to separate the mean from the extremes, to distinguish three wave regimes, to identify a shift around 1995-1996, and to examine how return levels change when the record is split into two climatically distinct epochs.
ERA5 data are public. Statistical tools are accessible. And scientific questions do not necessarily depend on the size of the budget.
Sometimes, what matters is asking the right question.
The full article is available in Theoretical and Applied Climatology.
DOI: 10.1007/s00704-026-06564-6
If you do not have institutional access and would like to read it, write to me and I will share it. If you have questions, comments, or are interested in extending this analysis to other basins, I would be glad to talk.
Axel Hidalgo-Mayo
Institute of Meteorology of Cuba
axel.hidalgom@gmail.com

Follow the Topic
-
Theoretical and Applied Climatology
Theoretical and Applied Climatology, founded in 1949, showcases latest and significant developments from global studies in climate, atmosphere, and meteorology. A successor to Meteorologische Zeitschrift, it carries forward the traditions of one of the world’s oldest meteorological journals.

Related Collections
With Collections, you can get published faster and increase your visibility.
Satellite-Enabled IoT Networks for Remote Environmental Monitoring
This topical collection focuses on the emerging role of satellite-enabled Internet of Things (IoT) networks in advancing remote environmental monitoring. Traditional ground-based monitoring systems often suffer from limited coverage, high infrastructure costs, and unreliable connectivity in remote or inaccessible regions such as forests, oceans, and polar areas. The integration of satellite communication with IoT technologies enables global-scale, real-time environmental data collection, supporting applications such as climate change monitoring, disaster prediction, biodiversity conservation, and smart agriculture.
Recent advancements in Low Earth Orbit (LEO) satellite constellations, nanosatellites, edge computing, and AI-driven analytics are transforming the feasibility and scalability of such systems. These technologies enable continuous, energy-efficient, and intelligent monitoring solutions capable of addressing environmental challenges worldwide.
This collection invites contributions on innovative architectures, algorithms, and applications, including hybrid satellite-terrestrial IoT systems, geospatial analytics, AIoT-based environmental prediction, UAV integration, and secure communication frameworks. The goal is to provide a platform for interdisciplinary research that supports sustainable environmental management and global resilience.
Publishing Model: Hybrid
Deadline: Dec 31, 2026
Climate Extremes and Urban Resilience: Integrating Physical Process, Adaptation Strategies, and Socio-Economic Impacts
The increasing frequency and intensity of climate extremes, coupled with rapid global urbanization, creates an urgent need for integrated research that bridges physical climate science with urban planning and socio-economic analysis. This collection addresses the critical knowledge gap between understanding extreme weather processes and implementing effective urban resilience strategies, providing a platform for interdisciplinary research that can inform evidence-based adaptation policies and practices. The collection will advance interdisciplinary collaboration between climate scientists, urban planners, engineers, and social scientists, fostering methodological innovations in coupled human-natural systems research. It will contribute to improved urban climate modelling capabilities, enhanced understanding of climate-society interactions, and development of transferable adaptation strategies. The research will also inform international climate assessment reports and support evidence-based policy development for urban climate resilience. This collection primarily addresses urban climatology and applied climatology, with significant contributions from mesoscale meteorology, climate extremes research, and climate impact assessment. It encompasses urban boundary layer dynamics, heat island effects, precipitation patterns in urban environments, and the modification of extreme weather events by urban morphology, while integrating these physical processes with adaptation science and climate services.
Publishing Model: Hybrid
Deadline: Dec 31, 2026