A hundred plus years of North American climate spatial models at the historical monthly time scale
Published in Research Data
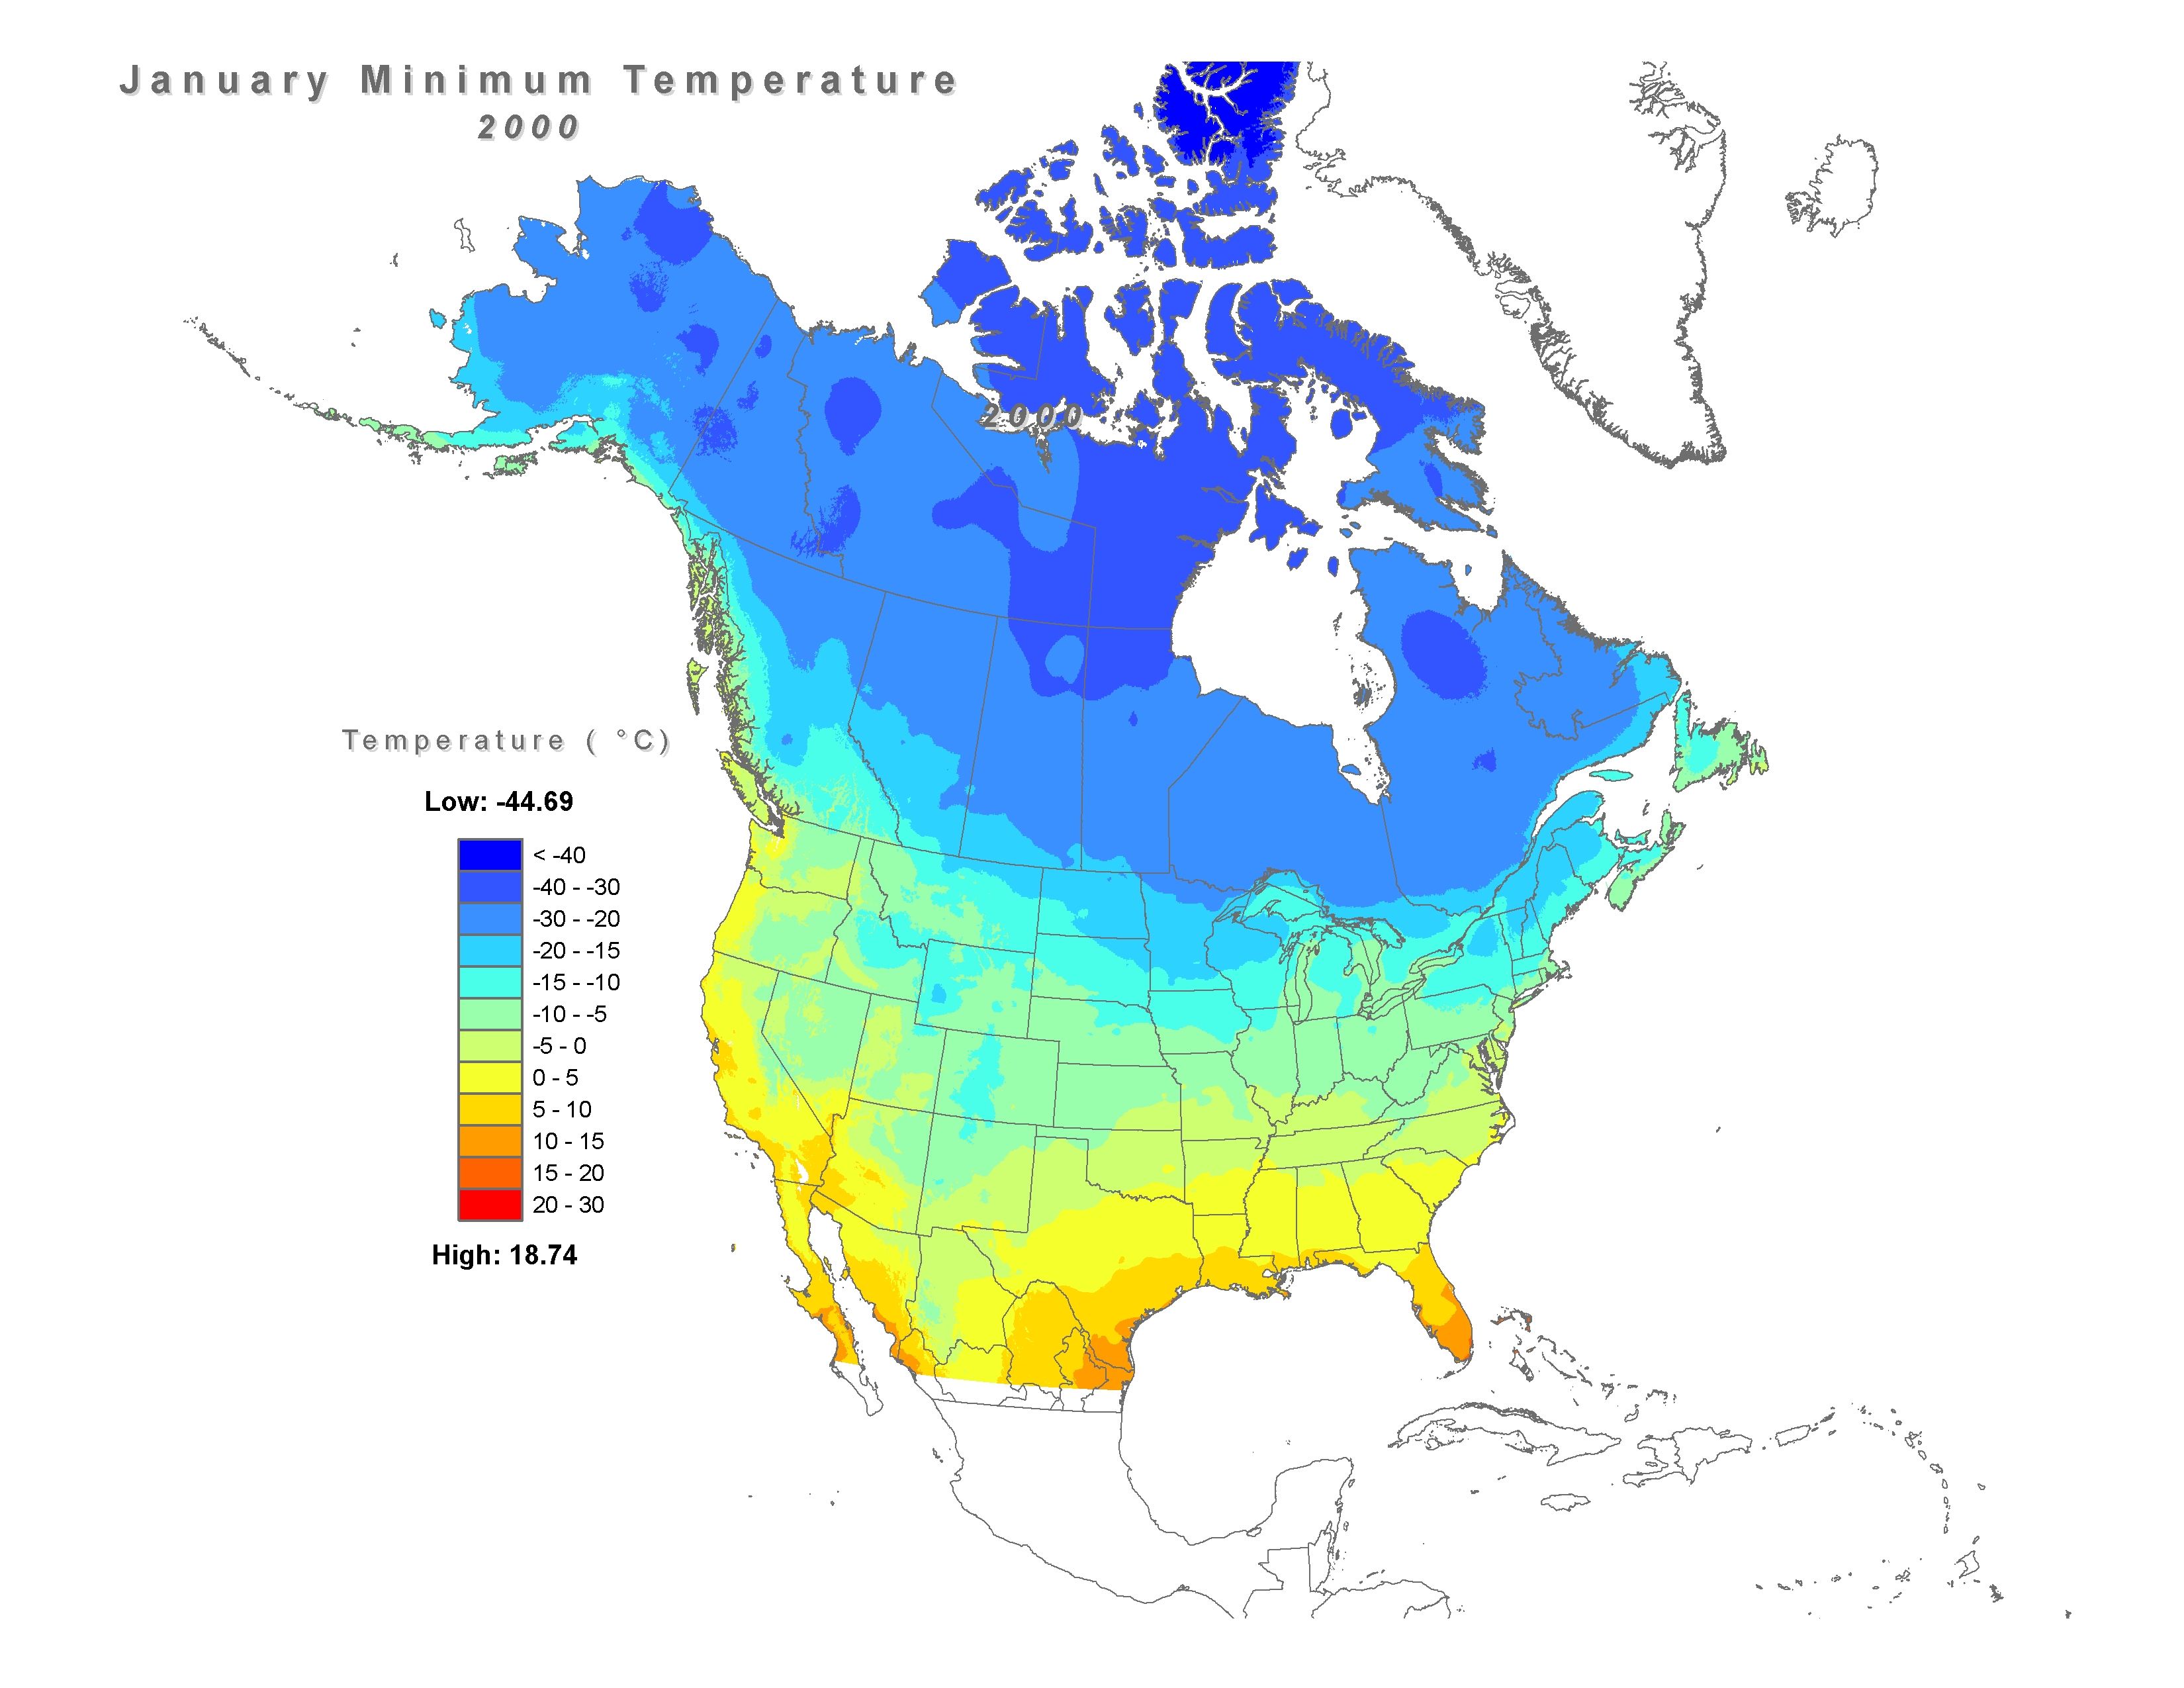
This paper introduces monthly grids of mean maximum/minimum temperature, and total precipitation generated between 1901 and 2016 using a 60 arc-second (approximately 2 km) Digital Elevation Model covering the continental US and Canada. These monthly historical spatial models cover the geographic area from -168° to -52° longitude, and from 25° to 85° latitude from 1950 to 2016, and -168° to -52° longitude, and from 25° to 60° latitude from 1901 to 1949 (See images below; TMIN 1950 and 2000). The models utilized the North American dataset version “j” from the National Oceanic and Atmospheric Administration’s (NOAA’s) National Centres for Environmental Information (NCEI). We report on improvements to model predictions compared to similar spatial models published in 2006 by Natural Resources Canada (NRCAN). In part, reductions in predictive error are due to commendable work by NOAA and other agencies to rescue, accumulate and restore historical temperature and precipitation records, as well as improved quality control processes. The models can be used by researchers and agencies to help assess the impacts of past climate on North American ecosystems (among other issues of human interest) and thus support climate adaption strategies.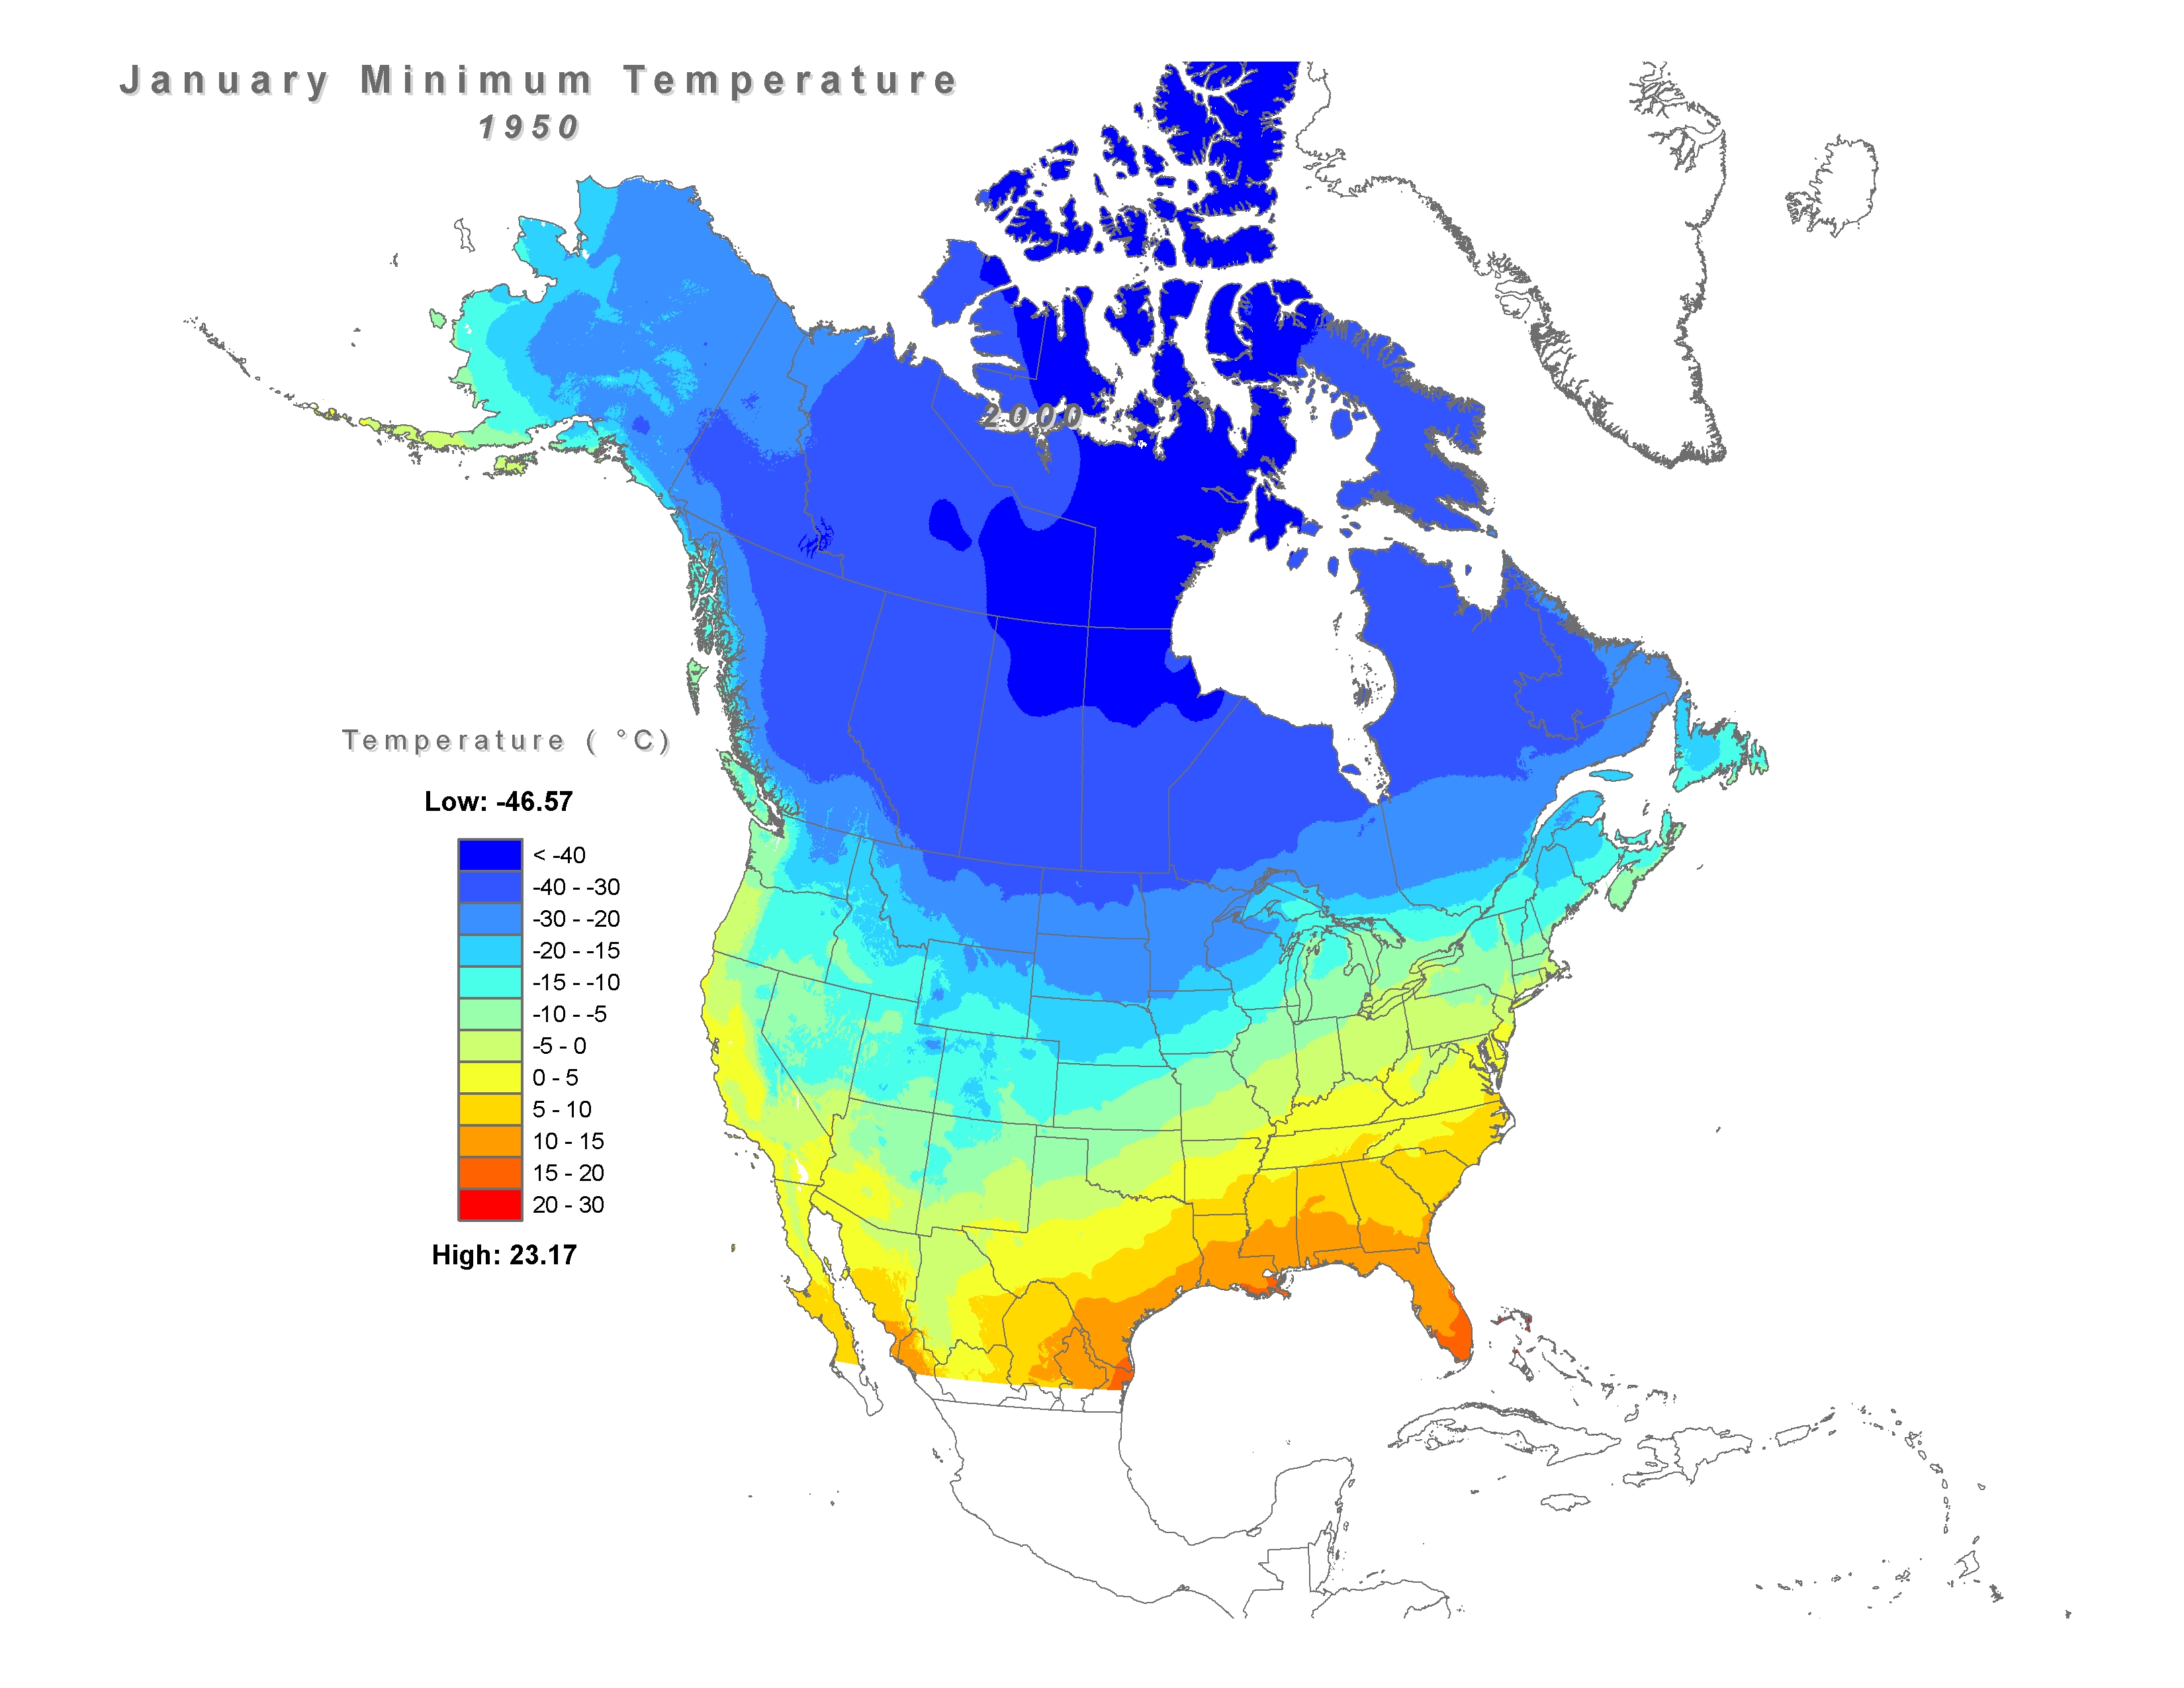

Follow the Topic
-
Scientific Data
A peer-reviewed, open-access journal for descriptions of datasets, and research that advances the sharing and reuse of scientific data.

Related Collections
With Collections, you can get published faster and increase your visibility.
Genomics in freshwater and marine science
Publishing Model: Open Access
Deadline: Jul 23, 2026
Computer vision in plant science and agriculture
Publishing Model: Open Access
Deadline: Jul 10, 2026


Please sign in or register for FREE
If you are a registered user on Research Communities by Springer Nature, please sign in