AmpliconSuite and AmpliconRepository: enabling ecDNA research at scale
Published in Cancer and Protocols & Methods
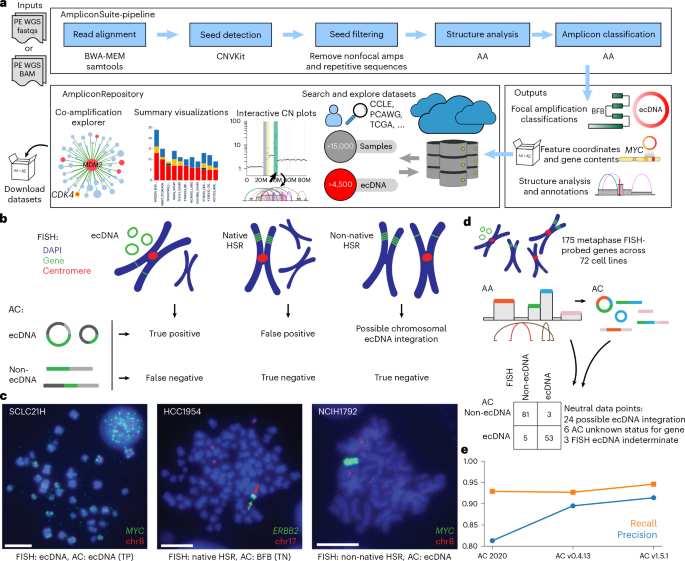

For researchers analyzing cancer genomes, an amplified oncogene often first appears as a peak in a copy-number profile. But the peak leaves important questions unanswered. Which genomic segments have been joined together? Are neighboring genes amplified together, or have distant regions been brought into the same structure? Does the amplification resemble extrachromosomal DNA (ecDNA), a breakage-fusion-bridge product, or another architecture?
These answers to those questions are important when investigating how tumors evolve and respond to treatment. They also require more than a gene-level copy number call. Our new study presents AmpliconSuite and AmpliconRepository: complementary tools for reconstructing focal amplifications from whole-genome sequencing and making the resulting structures easier to interpret and share. For patient-cohort studies, these are tools for investigating or generating biological hypotheses.
From a reconstruction to an interpretation
AmpliconArchitect[1], first released in 2019, provided the foundation. Starting from amplified regions, it combines copy-number estimates with sequencing evidence for rearranged junctions to build a copy-number-aware breakpoint graph. The graph describes genomic segments and their connections; reconstructed paths and cycles represent candidate amplified structures.
By keeping segment dosage and junction evidence together, the graph can represent structures obscured in a copy-number plot. Repeated segments and alternative paths also mean that a reconstruction need not provide one uniquely determined molecule.
The challenge was not only reconstructing these structures, but helping people interpret them. Users would send us outputs and ask whether their amplification was ecDNA. Answering consistently required translating structural patterns into explicit, reproducible criteria rather than relying on visual inspection alone.
AmpliconSuite-pipeline connects those steps. It accepts FASTQ, BAM or CRAM files from bulk whole genome sequencing, identifies candidate amplified regions, runs AmpliconArchitect, and applies AmpliconClassifier to distinguish ecDNA, breakage-fusion-bridge, complex non-cyclic and linear amplifications. Gene annotations and structural summaries connect the reconstruction back to the biological questions that motivated the analysis.
We also developed ecContext to examine the architecture and genomic background of predicted ecDNA. It considers features such as copy-number transitions, rearrangement patterns and how much amplification a dominant reconstructed cycle explains. A relatively simple circle in a simple genomic background suggests a different formation history from one embedded in extensive rearrangement. These patterns support excision-like or chromothripsis-associated classifications, though they are not direct observation of how a particular ecDNA formed. However, model systems created that can “launch” ecDNA provided a way to test those inferences against known formation mechanisms[2,3]. Across these models, ecContext correctly categorized all 11/11 excision-derived ecDNAs and 20/23 chromothripsis-derived ecDNAs, supporting the structural groupings.
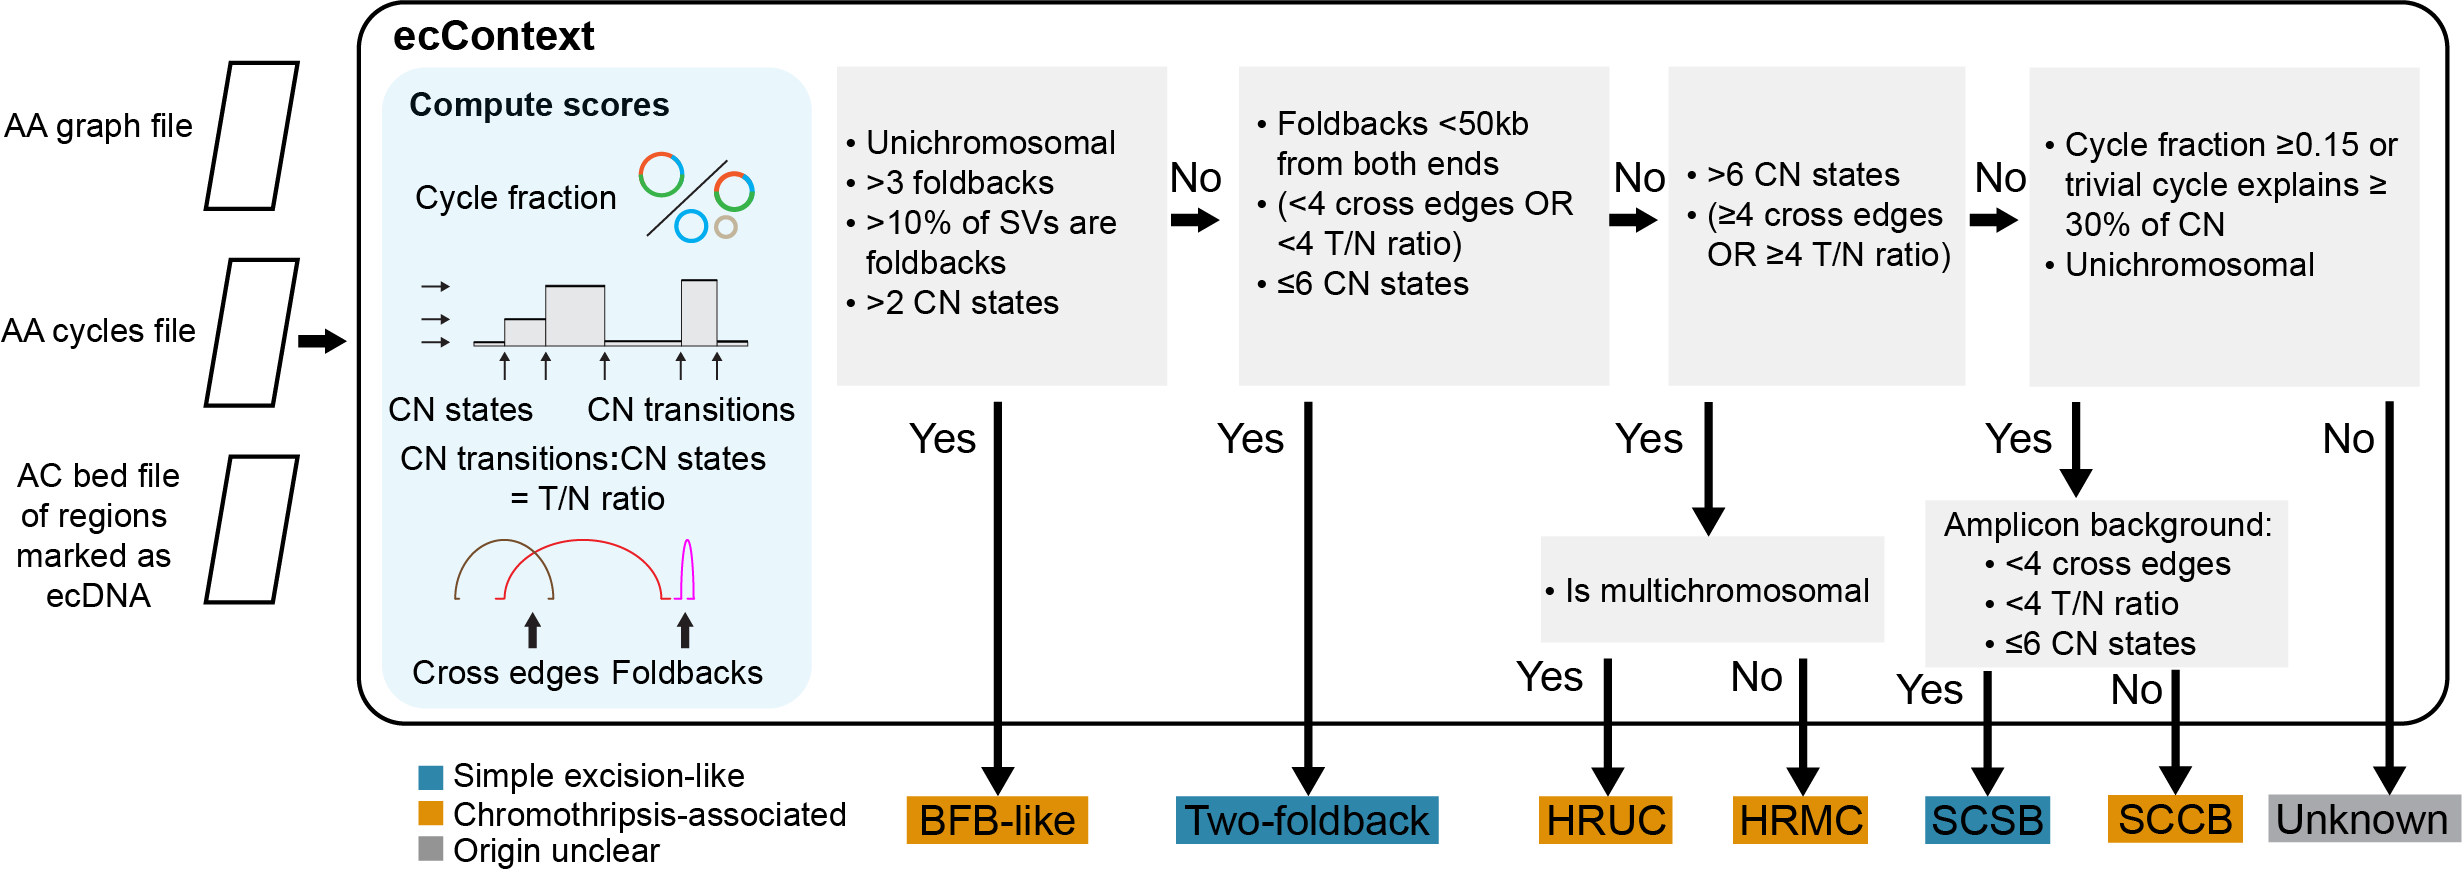
Figure 1: Decision diagram for ecContext, which takes the AA graph and cycles files plus the AC-called ecDNA regions BED file as input. ecContext computes scores from these inputs to predict ecDNA context: BFB-like, two-foldback, heavily rearranged unichromosomal (HRUC), heavily rearranged multichromosomal (HRMC), simple circular simple background (SCSB), simple circular complex background (SCCB), or unknown.
What bulk sequencing can, and cannot tell us
We turned to cell line models to help us validate our ecDNA prediction ability. Viewing metaphase chromosome spreads under the microscope remains one of the most reliable ways to determine if extrachromosomal DNA is present. We assembled metaphase FISH observations for 175 probed genes across 72 cancer cell lines with closely matching whole-genome sequencing. Independent image scoring and discussion of disagreements revealed an important complication: sequence architecture and physical location are related, but not interchangeable.
ecDNA and chromosomal amplification are not necessarily separate biological endpoints. ecDNA can become integrated into chromosomes, contributing to homogeneously staining regions (HSRs) chromosomal regions containing many amplified copies. Integration can preserve much of the amplified DNA’s rearrangement junctions, leaving a sequence architecture consistent with its circular origin.
This relationship has been recognized for decades. In the classic COLO320 studies[4,5], Alitalo, Varmus, Bishop and colleagues identified amplified MYC in both “double-minute” (a cytogenetically observed ecDNA)-bearing and HSR-bearing cultures; subsequent work supported a transition from MYC-bearing double minutes (DMs) to chromosomal HSRs. Whole genome sequencing of the DM and HSR versions of the line reveals conserved SVs and CN segment boundaries[6].
Later, Nathanson and colleagues showed that EGFR-bearing ecDNA could disappear during drug resistance and reappear after treatment withdrawal, while an EGFR-positive HSR-like chromosome remained as a possible reservoir. Similarly to COLO320, structural analyses of GBM39 subsequently demonstrated conserved amplicon architecture in extrachromosomal and chromosomal forms[8].
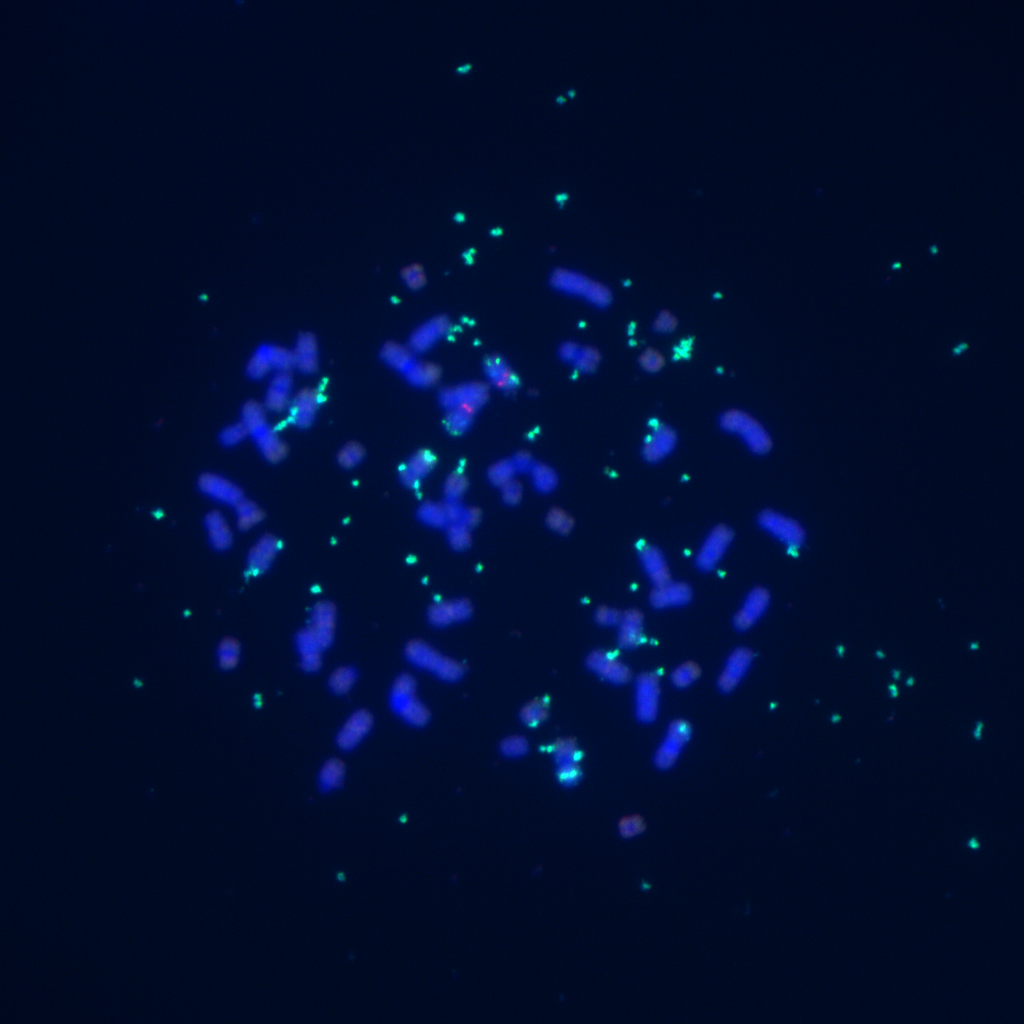
Our validation encountered this phenomenon in a number of samples. One interesting example was cell line CCF-STTG1. Sequencing supported a single CDK6-containing reconstructed cycle that accounted for the amplification, yet three of nineteen metaphase images also showed both CDK6 amplification on ecDNA and on a non-native chromosome as HSR. The reconstruction describes how amplified segments connect; it does not, by itself, establish where every amplified copy currently resides. Cytogenetics therefore remains an important complement to sequencing-based classification.
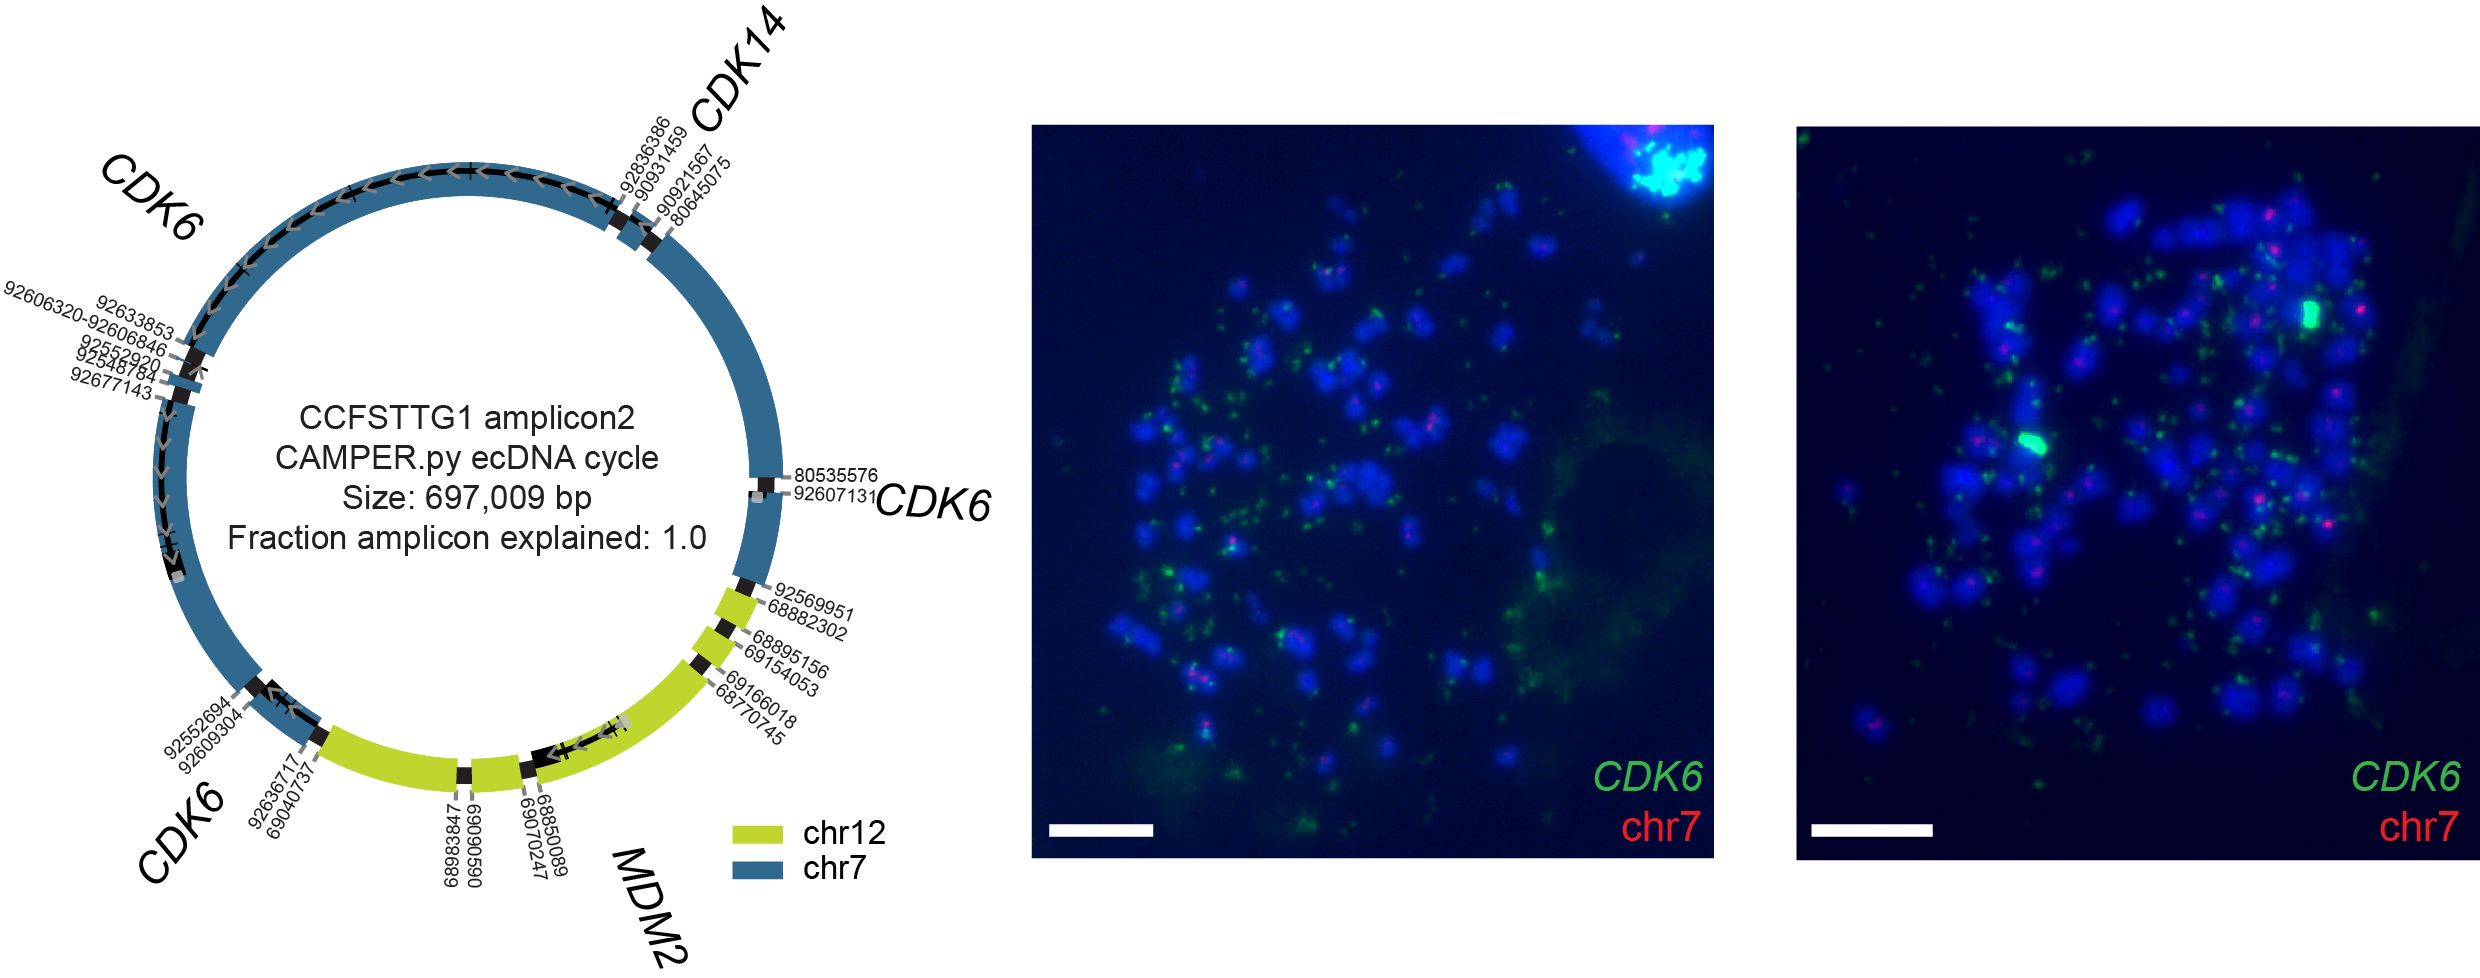
Figure 2: CycleViz diagram using AmpliconSuite’s CAMPER.py cycle extraction (longest cycle conforming to estimated segment multiplicities) showing a 697kbp ecDNA structure which fully explains all amplified segments and their multiplicities, suggesting no additional overlapping unexplained amplification. c) Representative metaphase FISH images for CCFSTTG1 showing CDK6 (green) as ecDNA (left) and a mix of ecDNA and non-native HSR (right; HSR does not co-locate with chr7 marker in red). Scale bars, 10μm. 19 FISH images collected.
This distinction shaped our benchmark. We treated non-native chromosomal amplifications with ecDNA predictions as neutral rather than straightforward errors, because integration can preserve the junctions used to infer circular architecture. These cases remain a limitation of bulk sequencing, not something a performance score resolves. Under the benchmark’s scoring rules, AmpliconClassifier achieved 0.91 precision and 0.95 recall; these values should be read alongside the neutral-case exclusions. The same caution applies to CDK4–MDM2 co-amplifications: an architecture consistent with ecDNA does not exclude a subsequent chromosomal integration, as discussed in the paper. That qualification is particularly important when interpreting a patient’s sequencing results without accompanying cytogenetic data.
A repository for asking the next question
Analyzing samples to find ecDNA in an individual study’s dataset is helpful, but a greater impact comes when those analyses are shared with the research community. Another researcher should be able to find it, inspect the evidence and compare it with their own samples without repeating the original analysis. That was the motivation for AmpliconRepository.org.
Uniquely, our platform is directly editable by the community. Researchers can contribute AmpliconSuite outputs in public or private projects. At the time of our study, it hosted results from more than 15,000 publicly available samples. Project summaries and interactive sample views let users move from a cohort overview to an individual amplification and its genomic context.
Crucially, the repository shares more than classification labels, bed files, or static images. Downloadable outputs include breakpoint graphs, reconstructed paths and cycles, gene annotations and amplification intervals. Researchers can examine the structure underlying a call and reuse those files in downstream analyses. This is particularly important when an unexpected architecture deserves closer scrutiny rather than automatic acceptance of its label.
Search and co-amplification exploration make the resource useful even before someone runs the pipeline. A researcher can find predicted ecDNA containing a gene of interest, inspect examples from published cohorts, or investigate whether two genes occur on the same reconstructed feature rather than merely in the same sample. We used shared results from 6,506 patient samples to investigate co-amplification patterns and ecDNA formation signatures—an example of analysis enabled by reusable reconstructions.
Since the work described in the paper, we have also added a programmatic API for searching across projects and retrieving results. Researchers can access it directly or point an AI assistant to ampliconrepository.org/llms.txt. The aim is to make finding relevant structures easier and simple to query.
An ecosystem shaped by its users
These tools grew through sustained exchanges between algorithm developers, research software engineers and experimental and clinical collaborators, supported by NCI’s Informatics Technology for Cancer Research program and Cancer Grand Challenges team eDyNAmiC. Questions arising in real analyses have repeatedly become standard tool features.
The ecosystem continues to develop. Beyond the paper’s short-read workflow, CoRAL long-read reconstructions can now be analyzed with newer AmpliconClassifier versions and shared through AmpliconRepository. We are also developing methods to recognize focal amplifications that appear embedded as, or within, neochromosomes.
Our goal is to help researchers move from detecting an amplified gene to examining its architecture, and ultimately to understanding the consequence of that specific amplification. We hope AmpliconSuite and AmpliconRepository make that progression easier, and we invite the community to contribute both results and questions which will shape what comes next.
References
-
Deshpande, V. et al. Exploring the landscape of focal amplifications in cancer using AmpliconArchitect. Nature Communications 10, 392 (2019). https://doi.org/10.1038/s41467-018-08200-y
-
Pradella, D. et al. Engineered extrachromosomal oncogene amplifications promote tumorigenesis. Nature 637, 955–964 (2025). https://doi.org/10.1038/s41586-024-08318-8
-
Shoshani, O. et al. Chromothripsis drives the evolution of gene amplification in cancer. Nature 591, 137–141 (2021). https://doi.org/10.1038/s41586-020-03064-z
-
Alitalo, K., Schwab, M., Lin, C. C., Varmus, H. E. & Bishop, J. M. Homogeneously staining chromosomal regions contain amplified copies of an abundantly expressed cellular oncogene (c-myc) in malignant neuroendocrine cells from a human colon carcinoma. Proceedings of the National Academy of Sciences USA 80, 1707–1711 (1983). https://doi.org/10.1073/pnas.80.6.1707
-
Lin, C. C. et al. Evolution of karyotypic abnormalities and C-MYC oncogene amplification in human colonic carcinoma cell lines. Chromosoma 92, 11–15 (1985). https://doi.org/10.1007/BF00327240
-
L’Abbate, A. et al. Genomic organization and evolution of double minutes/homogeneously staining regions with MYC amplification in human cancer. Nucleic Acids Research 42 (2014). https://doi.org/10.1093/nar/gku590
-
Nathanson, D. A. et al. Targeted therapy resistance mediated by dynamic regulation of extrachromosomal mutant EGFR DNA. Science 343, 72–76 (2014). https://doi.org/10.1126/science.1241328
-
Turner, K. M. et al. Extrachromosomal oncogene amplification drives tumour evolution and genetic heterogeneity. Nature 543, 122–125 (2017). https://doi.org/10.1038/nature21356

Follow the Topic
-
Nature Methods
This journal is a forum for the publication of novel methods and significant improvements to tried-and-tested basic research techniques in the life sciences.

Related Collections
With Collections, you can get published faster and increase your visibility.
Methods development in Cryo-ET and in situ structural determination
Publishing Model: Hybrid
Deadline: Oct 30, 2026