Projecting the future of seasonally open Arctic waters
Published in Sustainability
In September 2012, I was just starting grad school at the University of Colorado Boulder when the annual minimum daily Arctic sea ice extent demolished the previous record from 2007. That 2012 record of 3.39 million km2 on September 16 still stands (as of June 2021). It is a testament to both the remarkable changes wrought by global warming and the importance of summer weather patterns on the Arctic sea ice cover.
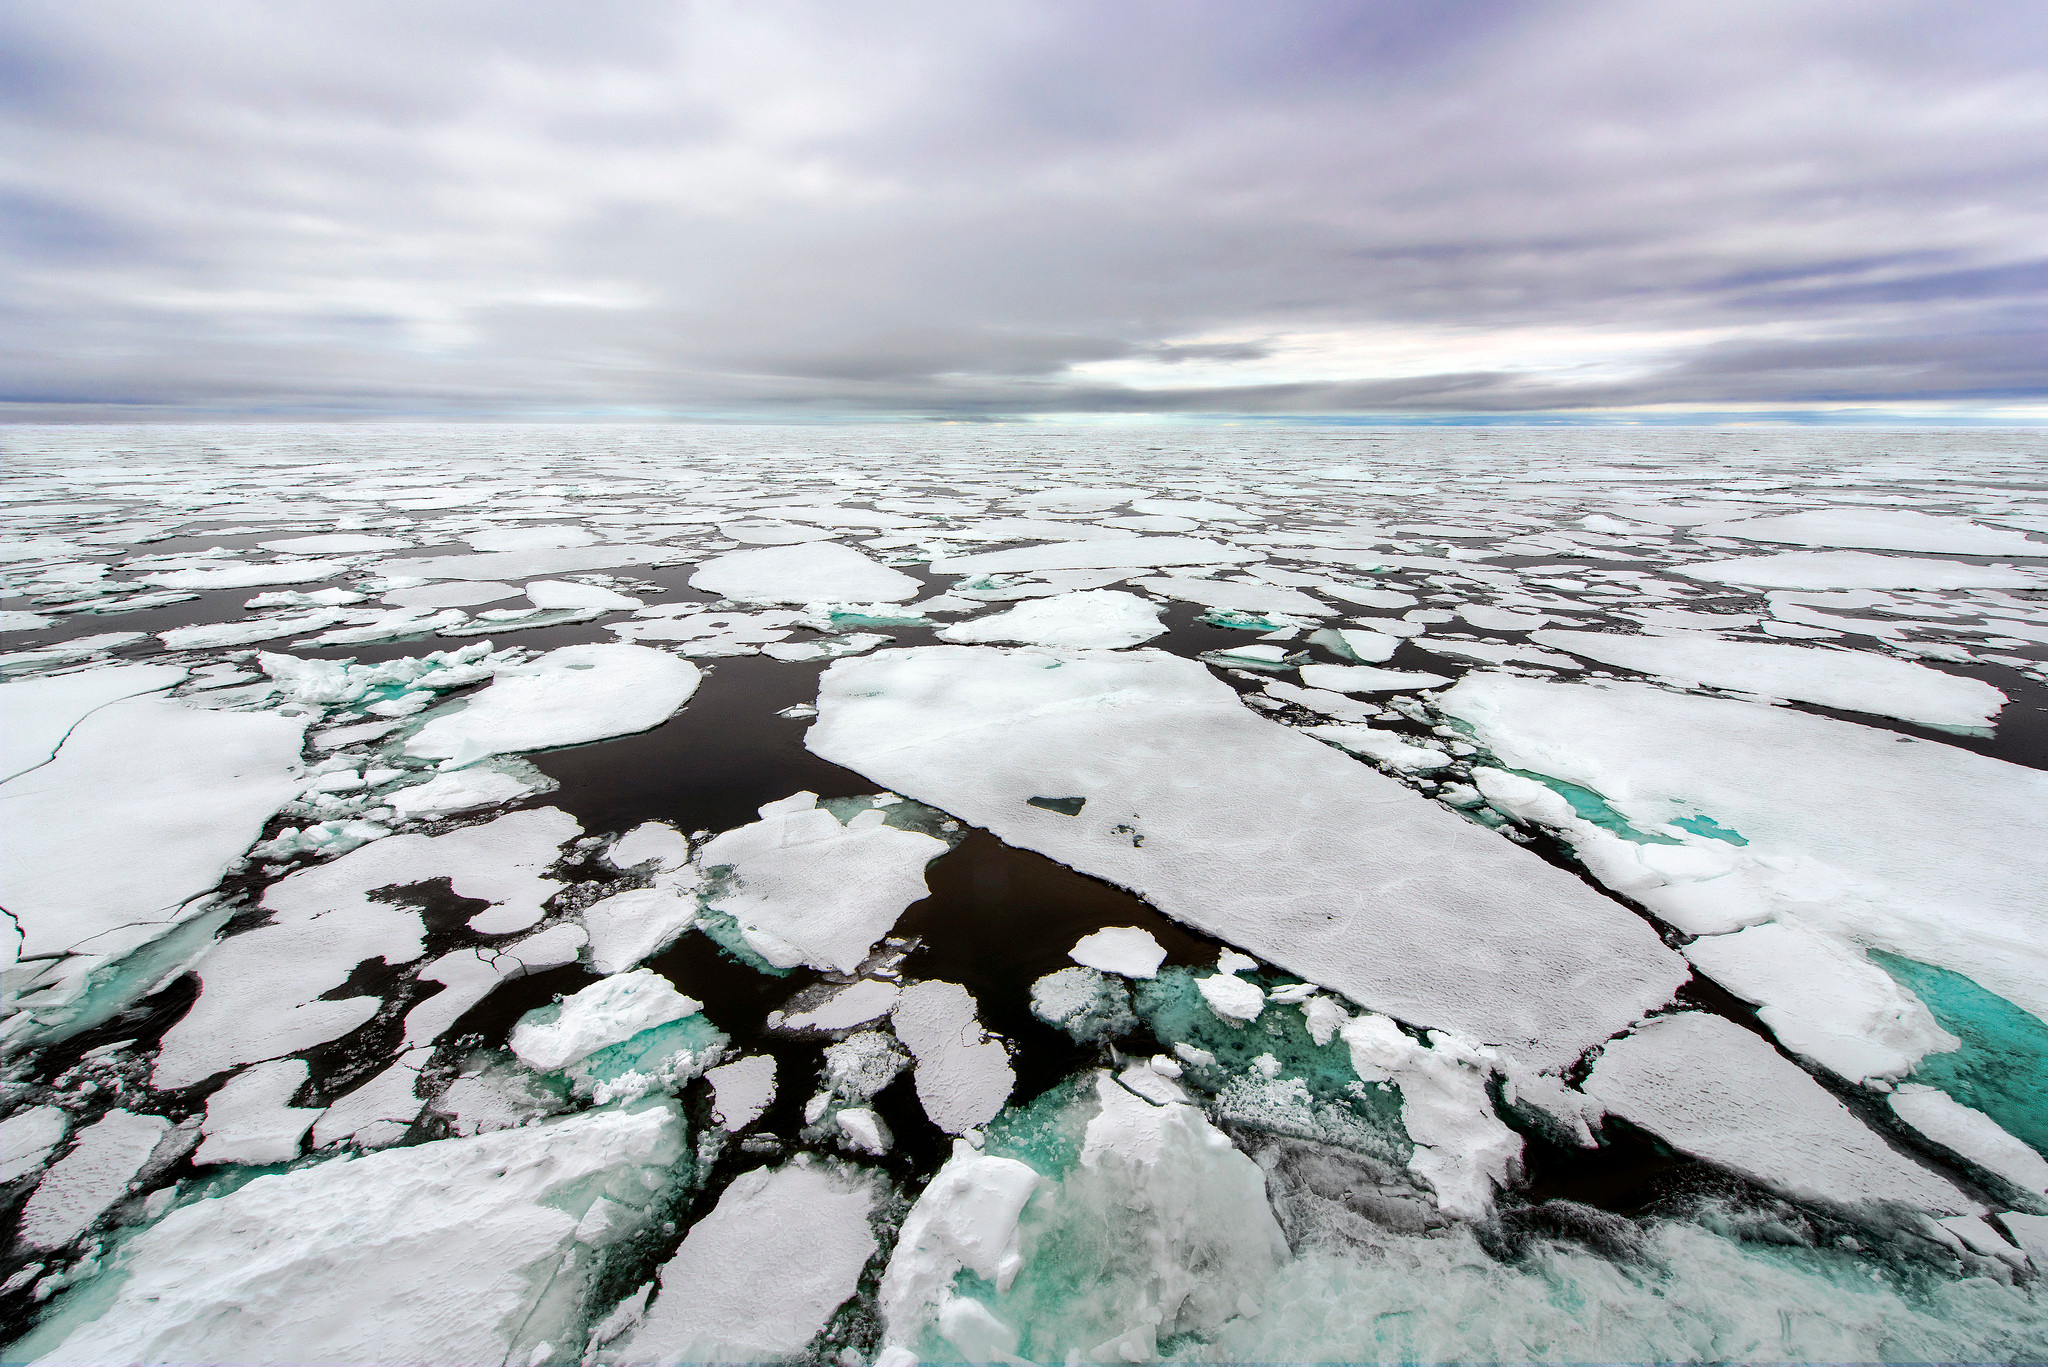
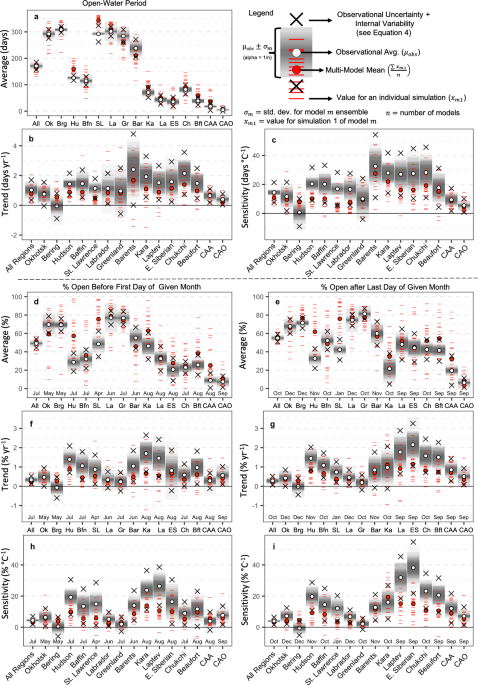
That number -- an annual minimum of 3.39 million km2 for pan-Arctic sea ice extent in September -- is useful for communicating about the overall picture of Arctic sea ice decline, but it masks both the regional variability of sea ice change and the dramatic seasonal cycle of sea ice growth in fall and winter and subsequent decline in spring and summer. For people working on the sea ice (e.g., for hunting and fishing) or waiting for the sea ice to break-up each spring (e.g., for marine shipping or resource extraction), knowing how long each area of the Arctic Ocean will be ice-covered in winter or open water in summer is more valuable than the pan-Arctic September sea ice extent. Recently, more researchers have focused on regional and seasonal aspects of Arctic sea ice extent (e.g., Bliss et al., 2019; Årthun et al., 2021). Our paper, just published in Communications Earth and Environment, is part of that push.
We examined the daily sea ice concentration from 22 climate models in Phase 6 of the Coupled Model Intercomparison Program (CMIP6) under historical conditions (1850-2015) and three projections of future greenhouse gas emissions: SSP1-2.6 (low emissions), SSP2-4.5 (medium emissions), and SSP5-8.5 (high emissions). In general, the more emissions, the more warming, and the more sea ice loss. Humans control which emissions scenario we follow. The models help us project how the climate system (and the length of open-water periods) respond.
Combining all model simulations and scenarios, this project involved the equivalent of 51,400 years of daily sea ice concentration data. I'm currently at the University of Manitoba in Winnipeg, Canada, which gives me access to cloud resources and ample data storage. However, I only moved here at the end of August 2020 (which was later than intended because of delays from the COVID-19 pandemic). For the first few months of this project, I worked from a home office in Ohio -- with no cloud access. Instead, I filled up two 4-TB external hard drives and used two more for back-ups. The cloud is great, but it has more barriers to access. External hard drives work anywhere with electricity. (Side note: It's weird to think of an external hard drive as "old reliable" technology.)
Anyway, I want to emphasize two take-home points from this paper:
1) Altogether, the length of the open-water period in Arctic waters (on average) increases by 1 month for every 1°C of global warming. We've already observed about 1°C of warming since 1850, so staying below that 2°C target means an average increase of another 1 month for the Arctic as a whole by 2100. That's one more month of accessibility for ocean vessels to travel and one less month for using sea ice as a platform for hunting and fishing. (But see the newly published paper for some regional/local variations in this average!)
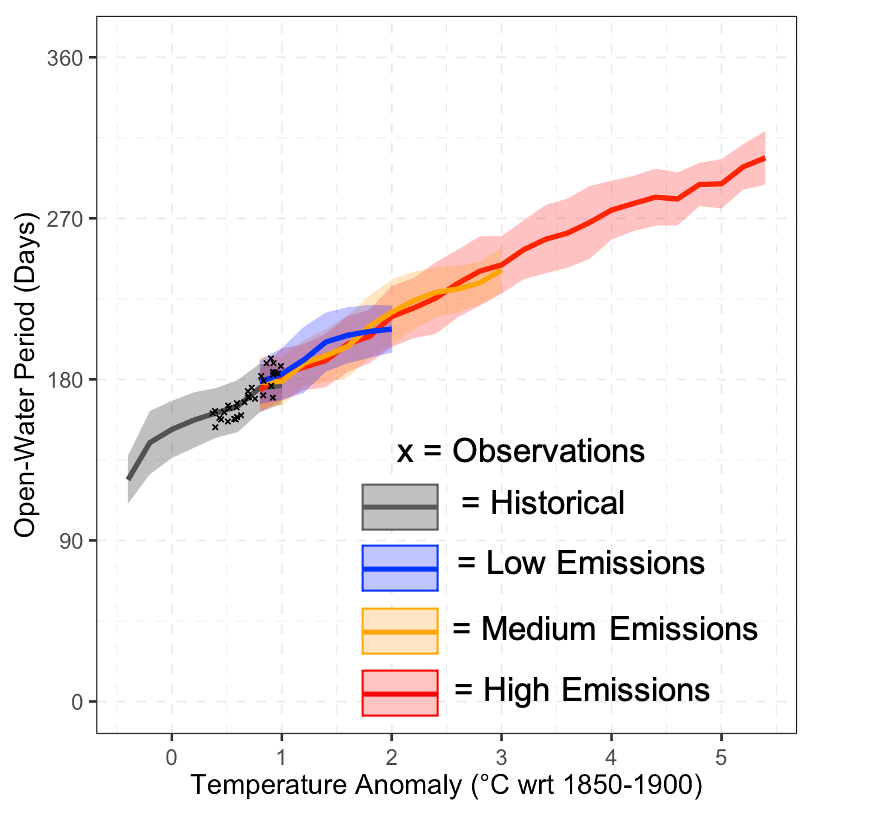
2) The length of the open-water period has a similar sensitivity to temperature in observations, historical simulations, or any of the emission-based projections. It's always about 1 month per 1°C of global warming overall. This makes the impact of human decisions on the open-water period easy to project. For example, if we limit warming to 3°C (instead of 2°C) we can expect the open-water period in the Arctic to be 3 months longer than in the mid-1800s (rather than 2 months longer). There's no threshold or tipping point here -- human decisions will dictate the length of seasonal open-water periods in the Arctic.
Follow the Topic
-
Communications Earth & Environment

An open access journal from Nature Portfolio that publishes high-quality research, reviews and commentary in the Earth, environmental and planetary sciences.
What are SDG Topics?
An introduction to Sustainable Development Goals (SDGs) Topics and their role in highlighting sustainable development research.
Continue reading announcementRelated Collections
With Collections, you can get published faster and increase your visibility.
Archaeology & Environment
Publishing Model: Hybrid
Deadline: Mar 31, 2026
Drought
Publishing Model: Hybrid
Deadline: Mar 31, 2026


Please sign in or register for FREE
If you are a registered user on Research Communities by Springer Nature, please sign in