Quantifying the shift of public export finance from fossil fuels to renewable energy
Published in Sustainability, Economics, and Law, Politics & International Studies
To reach the required scale and speed of the energy transition from fossil fuels to renewable energy, much research has been published on the role of public finance institutions, such as the World Bank or national development banks. However, one actor group has not received its due attention yet: public export credit agencies and export-import banks (here ECAs). In a nutshell, ECAs support exporters by issuing state-backed guarantees, thereby de-risking deals in overseas markets. Outside of Europe, ECAs also provide loans directly. Put simply, ECAs work as a public insurer or as a public bank.
Let us use an example to understand how ECAs work: Imagine vast quantities of gas are found in a politically or economically unstable country. To develop such resources, energy companies are dependent on numerous specific project components from specialized exporters all over the world: dredging services for clearing the seabed in offshore installations, engineering services to install the extraction facilities, liquefaction plants, and LNG tankers or pipelines for transport. Commercial banks that finance the exports of such deliveries can obtain ECA guarantees that mitigate against a variety of risks, e.g., repayment risks. In case the buyer (here the energy company) defaults, the bank can then claim compensation from the ECA (i.e., the state).
Historically, ECAs have existed since the 1920ies. In countries like the United States or the United Kingdom, ECAs played an important role in boosting domestic industrialization by ensuring international competitiveness, often tied to commercial and geopolitical goals abroad. In the energy sector, this notably involved the roll-out of fossil fuel infrastructure worldwide. However, today, ECAs also enhance the international financing of capital-intensive renewable energy assets, such as offshore wind farms.
For this study, we asked a simple question: how did ECA energy financing evolve over the past decade and what implications does this entail for public policies seeking to advance a rapid and just energy transition?
The key challenge to answering this question is that it is hard to get systematic export finance data for academics. Indeed, for this reason, a systematic understanding of how ECAs shape the energy transition has been missing. In our case, asking the right question at the right time helped: In early 2023, with the help of the German Federal Ministry for Economic Affairs and Climate Action, we reached out to TXF Limited and, for the first time, got access to their industry-leading database of export finance. As TXF and their clients were interested in a systematic assessment of where export finance stands concerning the energy transition, they provided us with granular data on ECA-supported financial transactions, self-reported by market participants.
Our analysis comes at a time when increasing uncertainty reigns in global markets; and hence demand for ECA products mitigating risks increases. First, the COVID-19 pandemic hit businesses, then Russia’s invasion of Ukraine re-shuffled the cards in global energy markets. Meanwhile, the impacts and risks of climate change grow so that urgent action is warranted. First steps in export finance policy include the OECD ban for ECA-supported coal-fired electricity generation and the launch of the Export Finance for Future (E3F) climate club by European countries committed to aligning export finance with the Paris Agreement. This becomes more important as the NGO Oil Change International, the only civil society actor which systematically observes ECA energy financing, published an accessible online database showing the extent to which ECAs support fossil fuels worldwide, an important additional data source that we used to triangulate our main results, where possible.
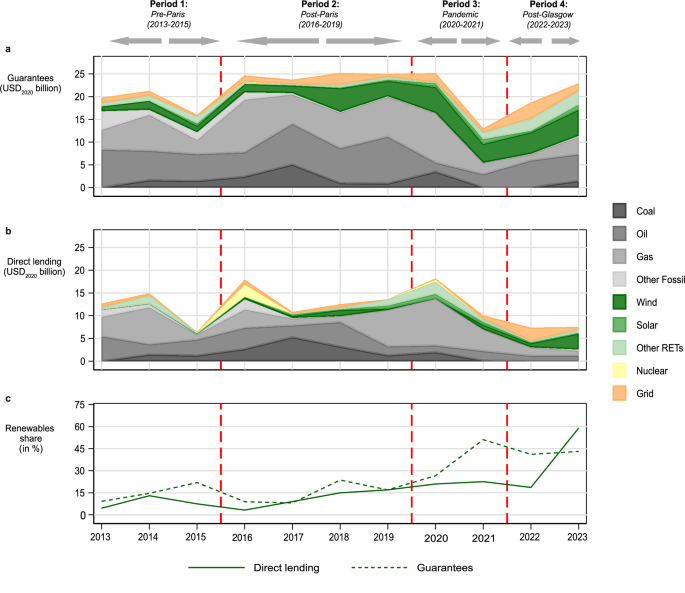
Against this dynamic background, we leveraged TXF data to quantify the long-term trends of ECA energy finance flows since 2013, covering public ECAs from 31 countries. Our analysis yielded several key findings. First and foremost, ECA portfolios are indeed shifting away from fossil fuels and towards renewables; even though far from a full exit. In 2013, the global share of renewables was below 10%; today, it has risen to around 40% in 2022-2023. This trend is largely driven by offshore wind, hydro, and more recently, green hydrogen financing by European ECAs that are members of the E3F coalition. Here a graph how portfolios of major ECA countries in the energy sector have evolved (see Figure 3 of our main article):

Despite this surge in renewables, however, oil and gas continue to draw the majority of ECA energy finance in most years. In addition, we find that the ‘greening’ of ECA portfolios is accompanied by a notable geographical shift of ECA energy finance away from developing countries. Renewable energy projects are more likely to be in high-income countries, which, as a result, attracted 70% of total ECA energy finance in 2022-23. By contrast, that share was only between 40-50% between 2013 and 2021. Such a shift raises equity issues for just transitions in the Global South, which should be considered in future ECA mandates and policies.
Finally, a critical implication of our study is the need for new policies, better international cooperation and more transparency. Within the OECD, in particular, restrictions and exclusions of oil and gas should be introduced in ‘The Arrangement’, the main supranational regulatory framework in public export finance. Furthermore, renewed policy coordination with non-OECD countries involved in export financing, especially China, is needed. Finally, offering improved conditions of renewable energy financing (and more transparency about it) could help contributing to and scaling up the new collective quantified goal on climate finance (NCQG) of at least USD 300 billion annually by 2035, negotiated at COP29 in Baku.
Follow the Topic
-
Nature Communications
An open access, multidisciplinary journal dedicated to publishing high-quality research in all areas of the biological, health, physical, chemical and Earth sciences.

What are SDG Topics?
An introduction to Sustainable Development Goals (SDGs) Topics and their role in highlighting sustainable development research.
Continue reading announcementRelated Collections
With Collections, you can get published faster and increase your visibility.
Women's Health
Publishing Model: Hybrid
Deadline: Ongoing
Biosensing
Publishing Model: Hybrid
Deadline: Jun 30, 2026

Please sign in or register for FREE
If you are a registered user on Research Communities by Springer Nature, please sign in