Teaching a Reactor to Make Invisible Heat Visible
Published in Chemistry and Mechanical Engineering
Making heat visible
A photochemical reactor is easy to recognise: a light source, a small transparent channel, and a liquid stream moving through it. At first glance, it seems like a story about light.
But in this project, the signal we cared about most was not visible at all. It was heat.
Our paper, Calorimetry informed visual digital model for continuous flow photobromination, began with a simple question: can the heat released during a reaction help us understand what is happening inside a flow photochemical reactor?
Heat is often treated as something to remove, especially in exothermic reactions. For us, it became a source of information. It could tell us whether the reaction was progressing gently or rapidly, whether the operating conditions were becoming too intense, and whether the process might need additional cooling before it could be scaled safely.
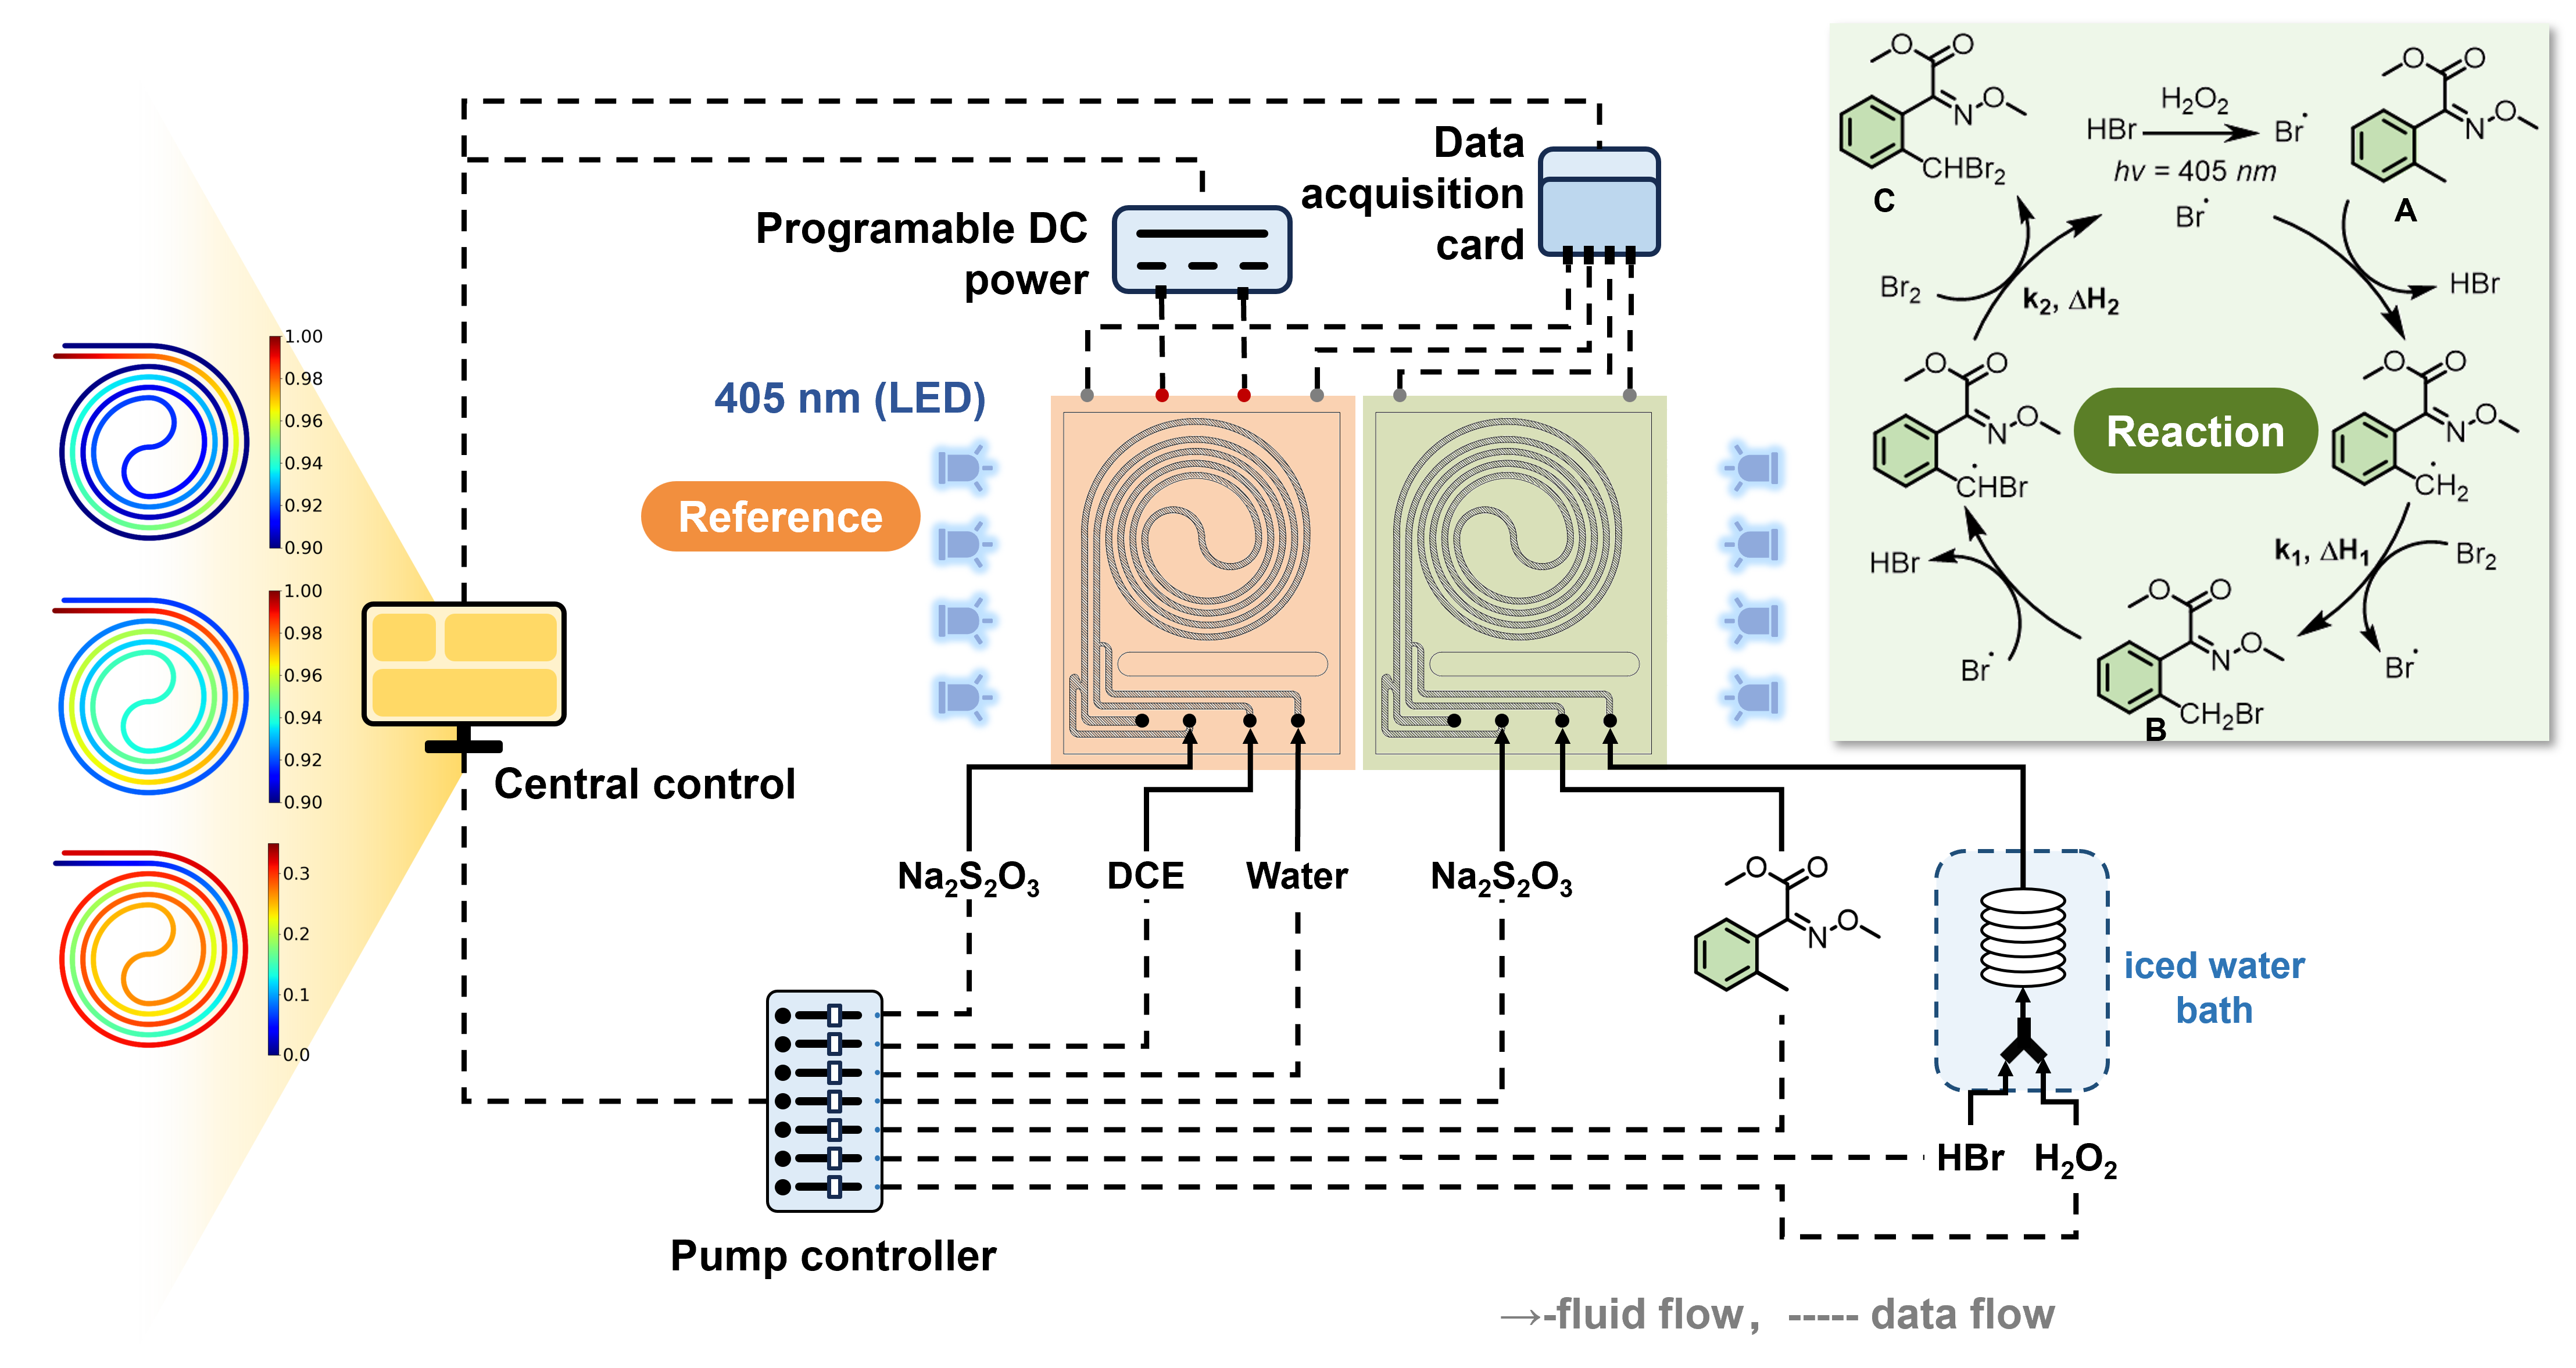
The reaction we studied was a continuous-flow photobromination. A solution of the starting material flows through a microreactor while being exposed to violet light. The desired product is a monobrominated compound, but further reaction can form an over-brominated by-product. The challenge is therefore not only to make the reaction happen, but to make it happen under conditions that are selective, predictable and thermally safe.
Listening to the hidden signal
In a conventional experiment, we often learn about a reaction by analysing the final sample. That tells us what came out of the reactor. In a flow reactor, however, we wanted to ask a more detailed question: what happens while the liquid is travelling through the channel? Where is the reaction most active? How much heat is released? And can that heat be linked to conversion and selectivity?
Answering these questions is difficult because a photochemical reactor produces several kinds of heat at once. The light source warms the system. The environment contributes small thermal disturbances. The chemical reaction itself releases heat. To use heat as a meaningful signal, we first had to separate the reaction heat from this background.
This is where our calorimeter came in. We used a Dynamic Tracking Referenced Continuous Calorimeter, or DTRCC, developed in our laboratory. A simple way to picture it is as a reactor with a reference twin. One module contains the real reaction. The other experiences similar light and thermal conditions, but acts as a reference. By comparing the two, the system can identify the heat released by chemistry more clearly.
This measurement was the first step toward making invisible heat visible. The calorimeter does not directly take a picture of the reactor. It records a heat signal. But when that signal is combined with kinetic modelling, it can be translated into a visual description of the process.
A one-day experimental campaign
Another important part of this story is speed. Once the platform and workflow were ready, the main data-collection campaign was completed in one long working day. From preparing the solutions to running the experiments and cleaning the instrument, the operation took roughly ten hours.
This does not mean that the whole project took one day. It certainly did not. The calorimeter had to be designed and built, the automation system had to be established, the experimental workflow had to be tested, and the model had to be developed afterwards. But the one-day campaign showed us that, with the right tools, kinetic data collection for a complex photochemical process can become much faster and more disciplined than a fully manual approach.
We also did not try every possible condition. Instead, we used a designed-experiment strategy to select a limited number of highly informative experiments. In the final campaign, 36 runs covered different temperatures, residence times and light intensities. At each condition, the calorimeter recorded the heat released by the reaction, while outlet samples were analysed by HPLC to measure conversion and selectivity.
These three pieces of information complemented each other. Heat told us how strongly the reaction was proceeding. Conversion told us how much starting material had reacted. Selectivity told us how much of the desired product was retained. Together, they gave us a more complete picture than any single measurement could provide.
The data also reminded us that a photochemical reactor is not governed by light alone. Temperature and residence time had strong effects on conversion and total heat release. Light intensity mattered, but it was not the only control knob. Our kinetic model further suggested that different steps in the reaction network responded differently to light. This is a useful lesson for process development: even inside a reactor illuminated by LEDs, heat, time and reaction pathway all matter.
From a heat curve to a reactor map
After collecting the data, the next challenge was translation. A heat signal is useful, but for many users it is still just a curve. We wanted to turn that curve into something more intuitive.
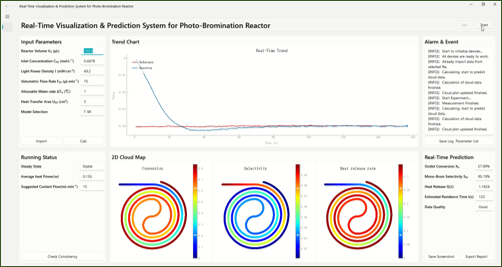
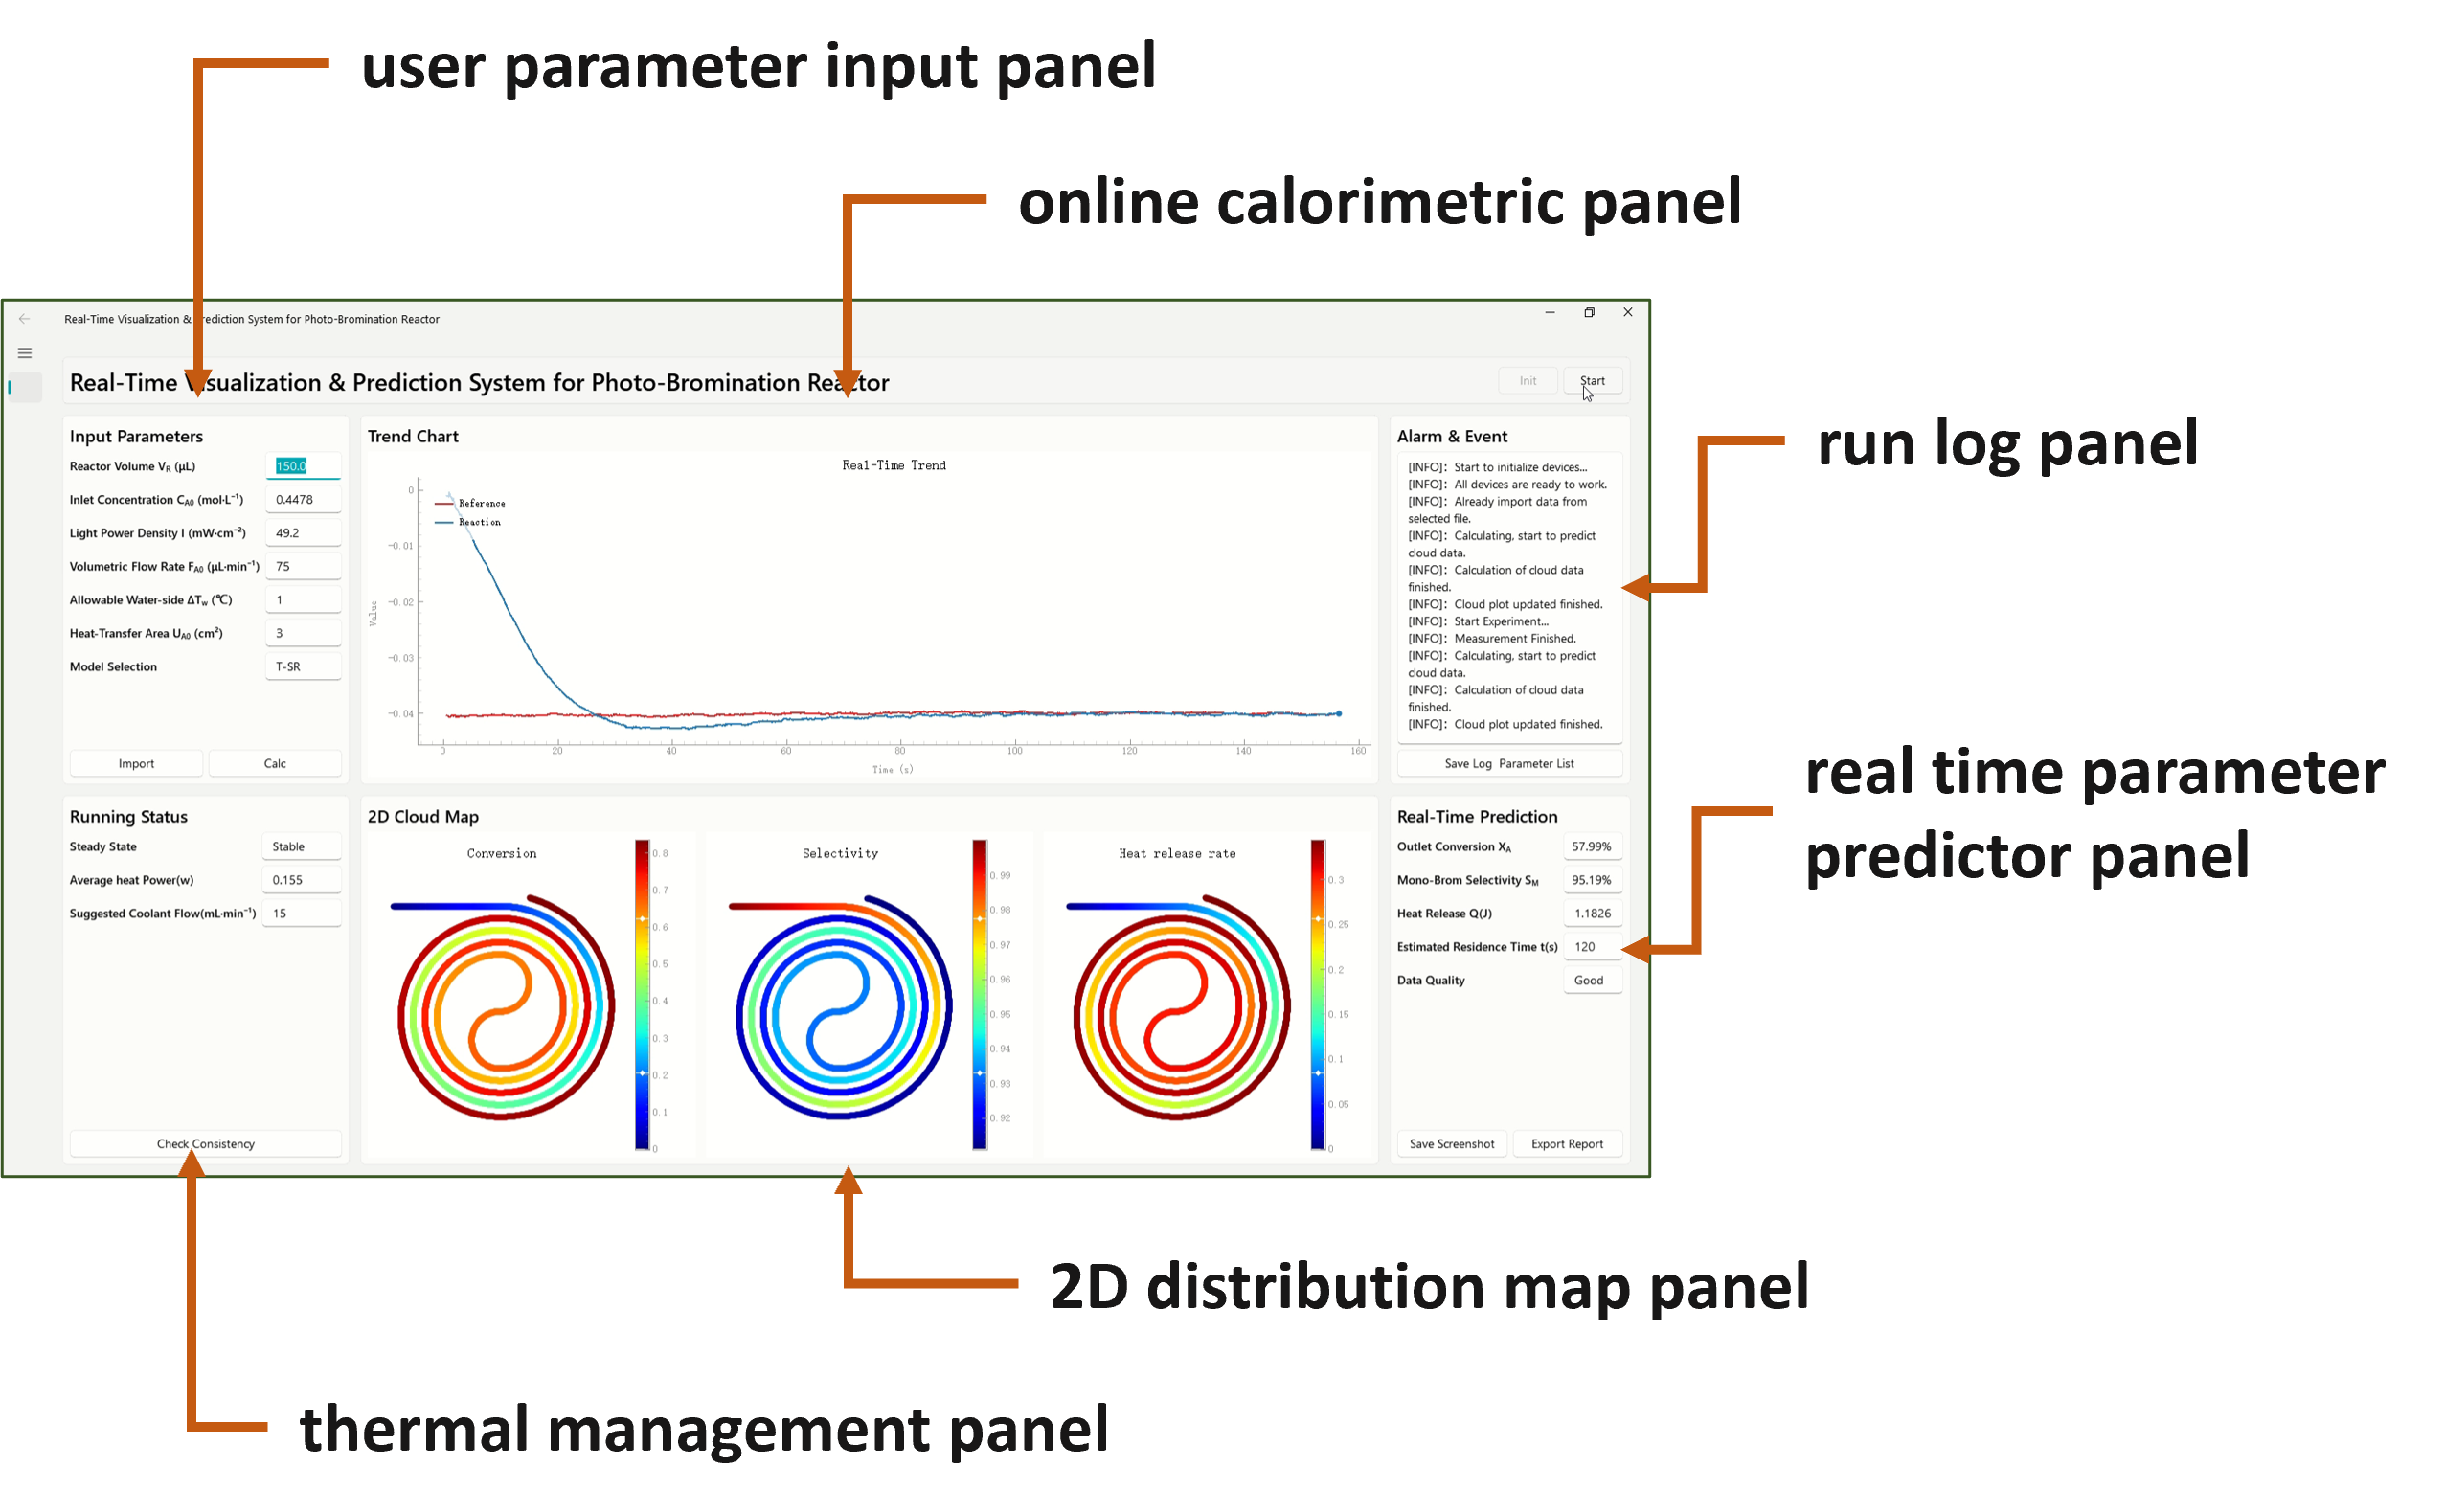
This led us to build a calorimetry-informed visual digital model. The model connects the measured heat signal with a kinetic description of the reaction. It then maps predicted conversion, product selectivity and heat-release rate inside the reactor.
In this sense, the model became a dashboard for the photochemical process. Instead of seeing only the final outlet result, we could generate a visual picture of how the reaction evolves along the flow path. The model could also provide thermal-management guidance, such as cooling requirements under different operating conditions.
This matters because a fixed model alone cannot tell whether a running reactor is still behaving as expected. Real-time calorimetry provides a physical check. If the measured heat signal changes, the model can use that information to update the prediction and highlight conditions that may need attention.
A workflow for faster process understanding
For us, the broader message of this work is not only about one photobromination reaction. It is about a workflow: design informative experiments, run them through an automated flow platform, collect real-time heat data, validate the chemistry with independent analysis, and turn the results into a visual and predictive model.
Exothermic photochemical reactions can be powerful, but their heat release must be understood if they are to be scaled safely and efficiently. By measuring heat and translating it into a visual model, we learned how to make the hidden thermal story of a photochemical reaction visible.


Please sign in or register for FREE
If you are a registered user on Research Communities by Springer Nature, please sign in