Why Prevalence Studies Are Harder Than They Look 🔍
Published in Social Sciences, Microbiology, and Research Data
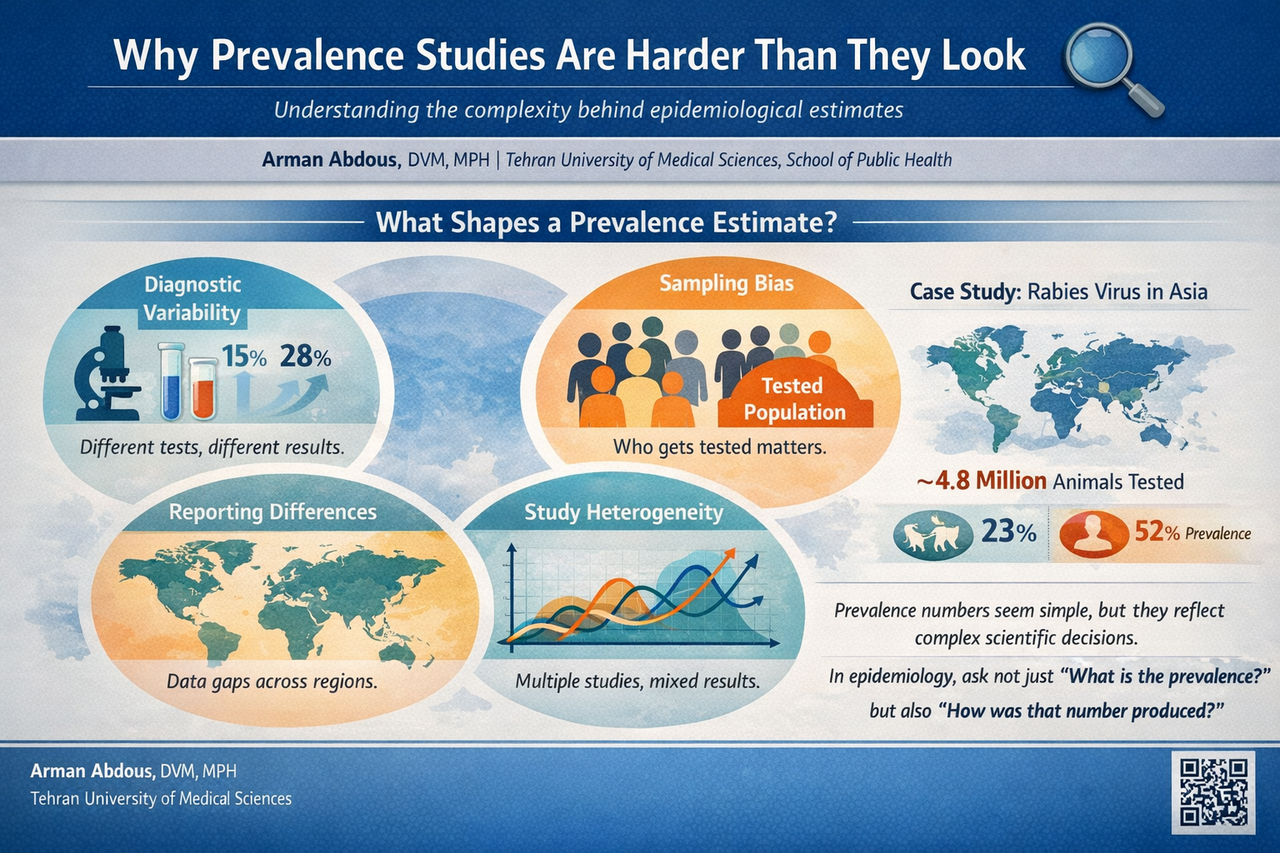
The seduction of a simple number 📊
Humans love simple numbers.
In epidemiology, prevalence seems to offer exactly that. It tells us what proportion of a population has a disease at a particular moment. It feels intuitive and easy to understand.
Yet when researchers start combining studies through meta-analysis, that simple number becomes a mosaic built from many different pieces.
Each study may involve different regions, time periods, diagnostic technologies, and surveillance systems. When these studies are pooled together, the final prevalence estimate becomes less like a measurement and more like a carefully assembled portrait.
In our rabies meta-analysis, we observed extremely high variability between studies. Statistical measures such as the I² statistic approached 100 percent. This level of heterogeneity signals that studies were capturing very different realities across the continent.
Still, when the results are reported as a single pooled prevalence, all that diversity can suddenly appear neatly compressed into one tidy statistic.
Diagnostics shape the numbers 🧪
One of the most fascinating lessons from prevalence studies is how much the results depend on how we detect the disease.
Rabies can be diagnosed through several laboratory techniques. Some studies rely on the direct fluorescent antibody test, which has long been considered the gold standard. Others use molecular tools such as reverse transcription PCR, which can detect viral genetic material even when samples are degraded.
These tools are powerful, but they are not identical.
Different tests can detect infections with different sensitivity levels. This means that two studies investigating the same disease may report different prevalence values simply because their diagnostic methods differ.
When those studies are later combined in a meta-analysis, the numbers begin to reflect not only the disease itself but also the technology used to find it.
Who gets tested matters 👥
Another subtle but important factor is who actually gets tested.
In many infectious disease studies, samples are collected from individuals already suspected of infection. Animals that show symptoms may be sent for testing. Patients who present with suspected exposure may undergo diagnostic investigation.
These groups are not random samples of the population.
They represent individuals who are already more likely to be infected.
As a result, prevalence calculated from tested populations often reflects the proportion of positive results among suspected cases rather than the true prevalence within the broader community.
In our rabies analysis, millions of animals and hundreds of thousands of human samples were examined across Asia. However, the circumstances under which these samples were collected varied greatly. Wildlife monitoring programs, hospital diagnostics, and targeted surveillance efforts all contributed data.
Each context shaped the numbers in its own way.
The geography of data 🌍
Epidemiological data are deeply influenced by geography and infrastructure.
Some countries maintain strong surveillance systems with routine laboratory diagnostics and systematic reporting. Others face limited resources, fewer diagnostic facilities, and gaps in data collection.
This uneven landscape can make prevalence comparisons tricky.
A country reporting fewer cases might truly have lower disease burden. On the other hand, it might simply have fewer diagnostic laboratories or weaker surveillance systems.
When researchers assemble global or regional datasets, these differences become part of the analytical puzzle.
Understanding the context behind the numbers becomes just as important as the numbers themselves.
Heterogeneity is not the enemy 📈
When researchers conduct meta-analyses, they often measure heterogeneity to understand how similar or different the included studies are.
High heterogeneity sometimes makes readers uneasy. It can feel like the data are messy or inconsistent.
In reality, heterogeneity often reflects the real world.
Different ecosystems, animal populations, public health systems, and diagnostic practices create natural variation in epidemiological data. Statistical models such as random effects approaches allow researchers to account for this diversity.
The goal is not to eliminate variation but to understand it.
Precision can be deceptive 🎯
One of the most intriguing aspects of meta-analysis is the appearance of extraordinary precision.
A pooled estimate might read:
23.0% with a confidence interval of 22.7 to 23.4 percent.
It looks beautifully exact.
However, confidence intervals capture statistical uncertainty within the model. They do not fully capture differences in surveillance systems, diagnostic approaches, or reporting practices.
In other words, the mathematics may be precise, but the real world behind the data is far more complex.
Recognizing this distinction helps us interpret epidemiological results more thoughtfully.
Why this matters for public health 🩺
Despite all these challenges, prevalence studies remain incredibly valuable.
They allow researchers to detect patterns, identify high-risk regions, and evaluate disease control efforts. Public health policies, vaccination campaigns, and surveillance strategies often rely on these numbers.
But responsible interpretation requires curiosity about how the numbers were produced.
When we ask deeper questions about study design, sampling methods, and diagnostic tools, we gain a clearer picture of disease dynamics.
Rabies offers a powerful example. Although it remains entirely preventable through vaccination and post-exposure prophylaxis, it still causes tens of thousands of deaths each year. Understanding the true burden of this disease requires strong surveillance systems and harmonized diagnostic approaches across countries.
Final thoughts 💡
Prevalence statistics may look simple, but they are built from layers of scientific decision-making.
Diagnostic methods, sampling strategies, surveillance systems, and regional differences all shape the numbers that appear in epidemiological studies.
Recognizing this complexity does not weaken the value of prevalence research. On the contrary, it deepens our understanding of what those numbers truly represent.
In epidemiology, perhaps the most interesting question is not only:
“What is the prevalence?”
But also:
“What story lies behind that number?”
Reference
Shams, F., Jokar, M., Djalali, E., Abdous, A., Rahnama, M., Rahmanian, V., Kanankege, K. S. T., & Seuberlich, T. (2025).
Incidence and prevalence of rabies virus infections in tested humans and animals in Asia: A systematic review and meta-analysis study.
One Health, 20, 101102. https://doi.org/10.1016/j.onehlt.2025.101102
I am a veterinary researcher with a strong interest in clinical sciences, veterinary epidemiology, and public health. My experience includes working with clinical data, conducting literature-based research, and contributing to systematic reviews and analytical studies related to animal health and disease. I am particularly interested in the intersection of clinical veterinary practice and population-level health, with a focus on improving diagnostic, therapeutic, and preventive approaches. I enjoy engaging with the scientific community through research, peer discussion, and continuous learning, and I am keen to contribute to collaborative and interdisciplinary research initiatives.

Please sign in or register for FREE
If you are a registered user on Research Communities by Springer Nature, please sign in