Dense Crowd Dynamics and Pedestrian Trajectories: A Multiscale Field Dataset from the Festival of Lights in Lyon
Published in Social Sciences, Research Data, and Sustainability

Lights, Rain, and Data: What We Learned by Watching Thousands Walk Through a Festival
Imagine you're walking through a vibrant festival, surrounded by art installations, music, and glowing lights. You’re one of hundreds—or even thousands—of people moving through the space, unaware that above you, researchers are quietly capturing something extraordinary: how people move, flow, and interact in a crowd.
This is exactly what happened during the Festival of Lights in Lyon, and we’ve just published the results of that effort in Scientific Data: 👉 Read the paper
But this isn't just a story about data. It’s also a story about open science, technology, and how we can better understand public spaces—not by building walls around knowledge, but by breaking them down.

Why Study Crowds at a Festival?
Crowds are fascinating. They can move like water through a channel, flow smoothly—or get stuck. Understanding crowd behavior isn't just an academic exercise—it’s crucial for public safety, urban design, and even planning emergency evacuations. But studying real crowds is hard. Especially in a public, dense, uncontrolled, and dynamic setting like a festival.
That’s exactly why this project matters.
We set out to capture real-world pedestrian movement during the Festival of Lights in Lyon, one of Europe’s most popular light festivals, with thousands of visitors roaming the streets every night with densities of up to 4 pedestrians per square meter. The goal? Create reliable, open data that others could use, whether they’re researchers, engineers, city planners, or curious minds.
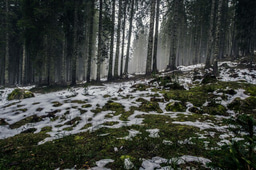
A Peek Behind the Scenes: Cold, Rainy, and Worth It
This project wouldn’t have been possible without the incredible work of a team from three universities and a research center who spent nights in the cold, rain, and shadows of Lyon, setting up equipment, recording videos, and patiently watching the crowds go by.
Watch the fieldwork in action:
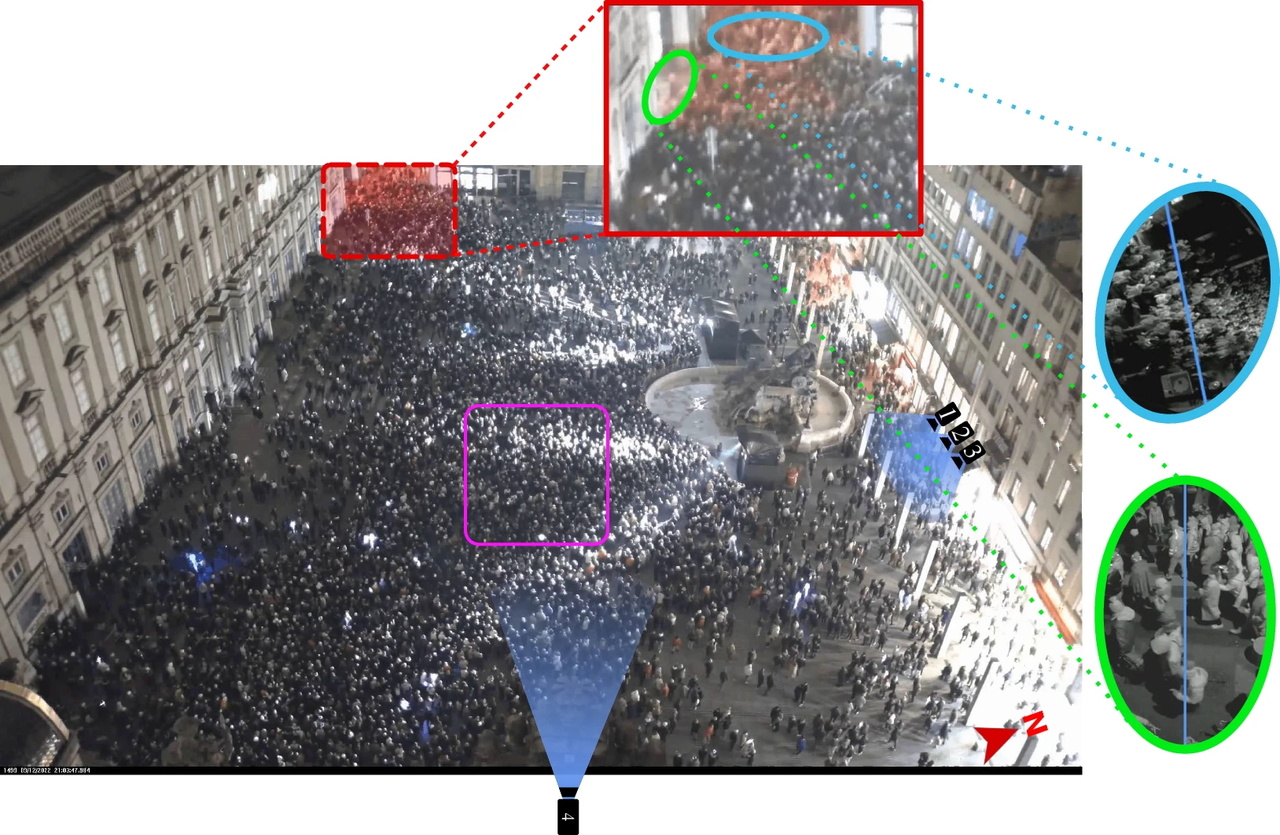
We identified places with interesting pedestrian dynamics at high density levels where we installed our equipment. Yet, filming people without interrupting them is tricky. We had to carefully choose camera angles and locations to stay unobtrusive, respect privacy, and still get accurate data. We could also use some of the video from Lyon's wide-angle HD cameras to obtain large-scale dynamics.
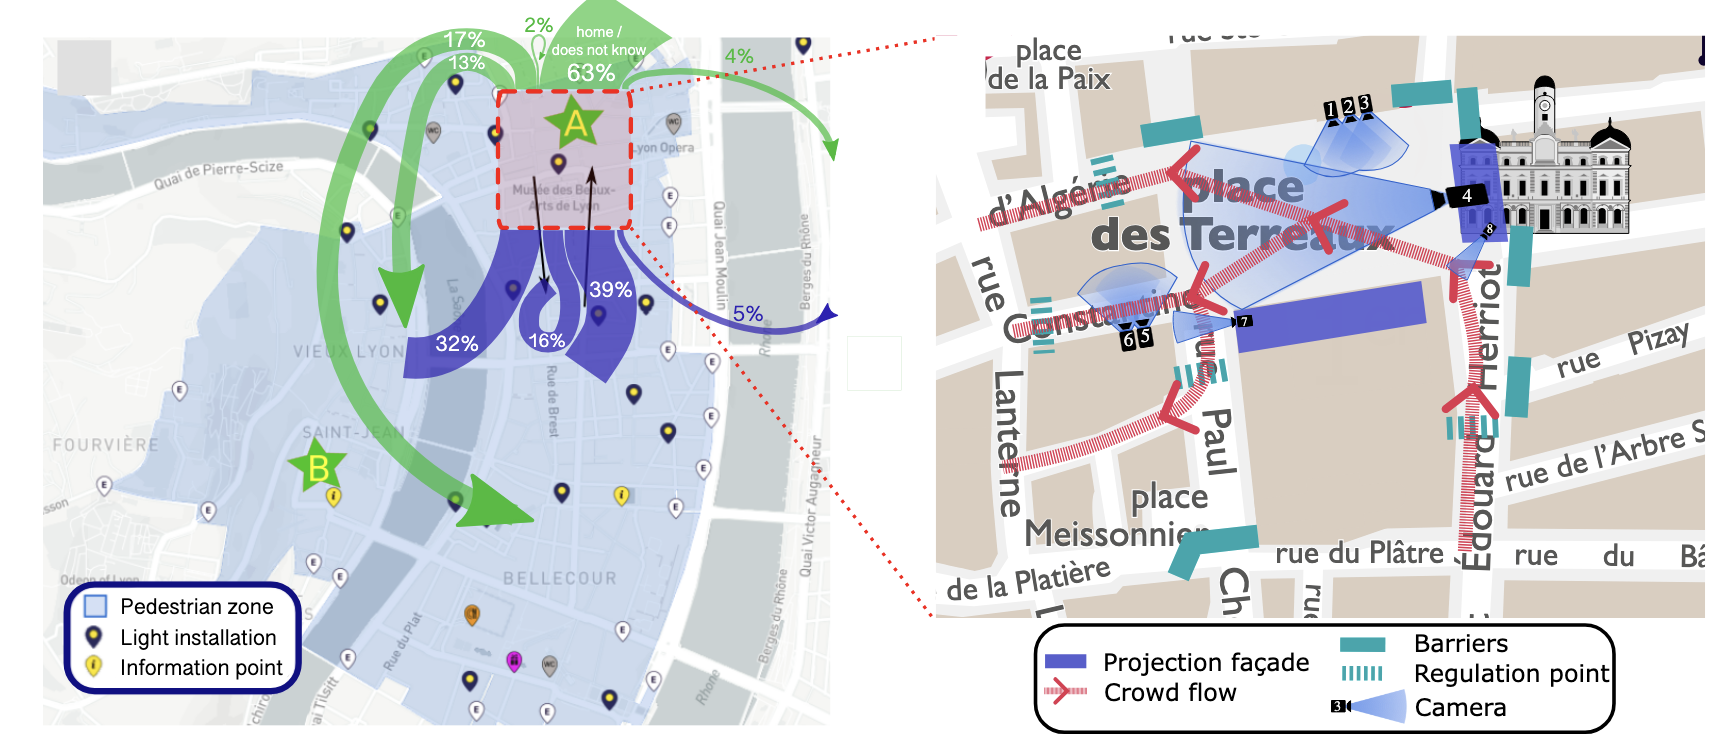
After filming, we used Petrack, an open-source software tool, to extract individual trajectories—basically, to track how each person moved across time and space in the videos. We also surveyed participants during the festival to find out their destinations and the composition of pedestrian groups, or to allow us to anonymously use their smartphone's GPS connection to find out their trajectories. We also asked students to attend the festival and record instances of contact in the most crowded areas, and used wide-angle cameras to measure entry and exit rates on a large scale in the festival's main squares. All these measurements enabled us to create a multi-scale database of pedestrian dynamics at the Lyon Festival of Lights.

Behind the Scenes: Balconies, Chalk, and World Cup Chaos
Science doesn’t always happen in a lab. Sometimes, it happens on a balcony—with a chalk grid in the street below and a camera strapped on with nylon ties.
In December 2021, during the Festival of Lights, we were looking for a good spot to film pedestrians in natural flow conditions. That meant height, visibility, and ideally a private space. We posted an ad in a local student Facebook group in Lyon, asking for help. A few students responded, and we were lucky enough to be offered a flat on the 2nd floor of a building in Victor-Hugo street, complete with a balcony that overlooked the street.
We didn’t take any chances. We even consulted a PhD student in law from Sorbonne University to confirm that filming people in public spaces from a private flat was legally sound. Once everything was cleared, we set up a TomTom Bandit camera on an articulated arm, secured with nylon straps to the balcony railing.
To calibrate the camera, we used chalk to draw a grid directly on the street and filmed ourselves walking across it. This helped us translate movements on the ground into accurate, real-world coordinates. That first evening was a modest success—lower density (under 1 person per square meter), but a valuable learning experience. We found higher densities at hotspots like Place des Terreaux and Place Saint-Jean, with as many as 4 pedestrians per square meter.
Unfortunately, due to ongoing COVID restrictions and lockdowns, the 2021 edition of the festival was more subdued than usual. High-density crowd flows were harder to come by.
So we tried again.
In 2022, we came back stronger - and yes, it was expensive. We rented Airbnb apartments overlooking Place des Terreaux, which turned out to be the best decision of the campaign. From there, we could record large, natural crowds in dense conditions - just what we needed.

But this time, the tricky part wasn’t COVID. It was the World Cup. France was playing their semifinal match during the festival, and we feared the crowd would stay home glued to their screens. But thankfully, once the game ended, the crowd returned, and we were able to carry out a high-density data collection session under nearly perfect observation conditions (well it was still cold and rainy).
Sometimes fieldwork requires creative logistics and a little luck. This project had both.
From Pixels to Patterns: What the Data Tells Us
We didn’t just record videos—we turned them into a dataset that captures how thousands of people moved over time. That means we can answer questions like:
- How do people avoid collisions in a crowd?
- What happens when a sidewalk gets too narrow?
- How do groups (like families) move compared to individuals?
The beauty of this dataset is that it’s real. It comes from uncontrolled, natural behavior - not simulations, not lab experiments. That's rare. And that makes it valuable.
Explore the data yourself with our web app: Interactive madras-app
How We Analyzed the Data: Power of Open Source
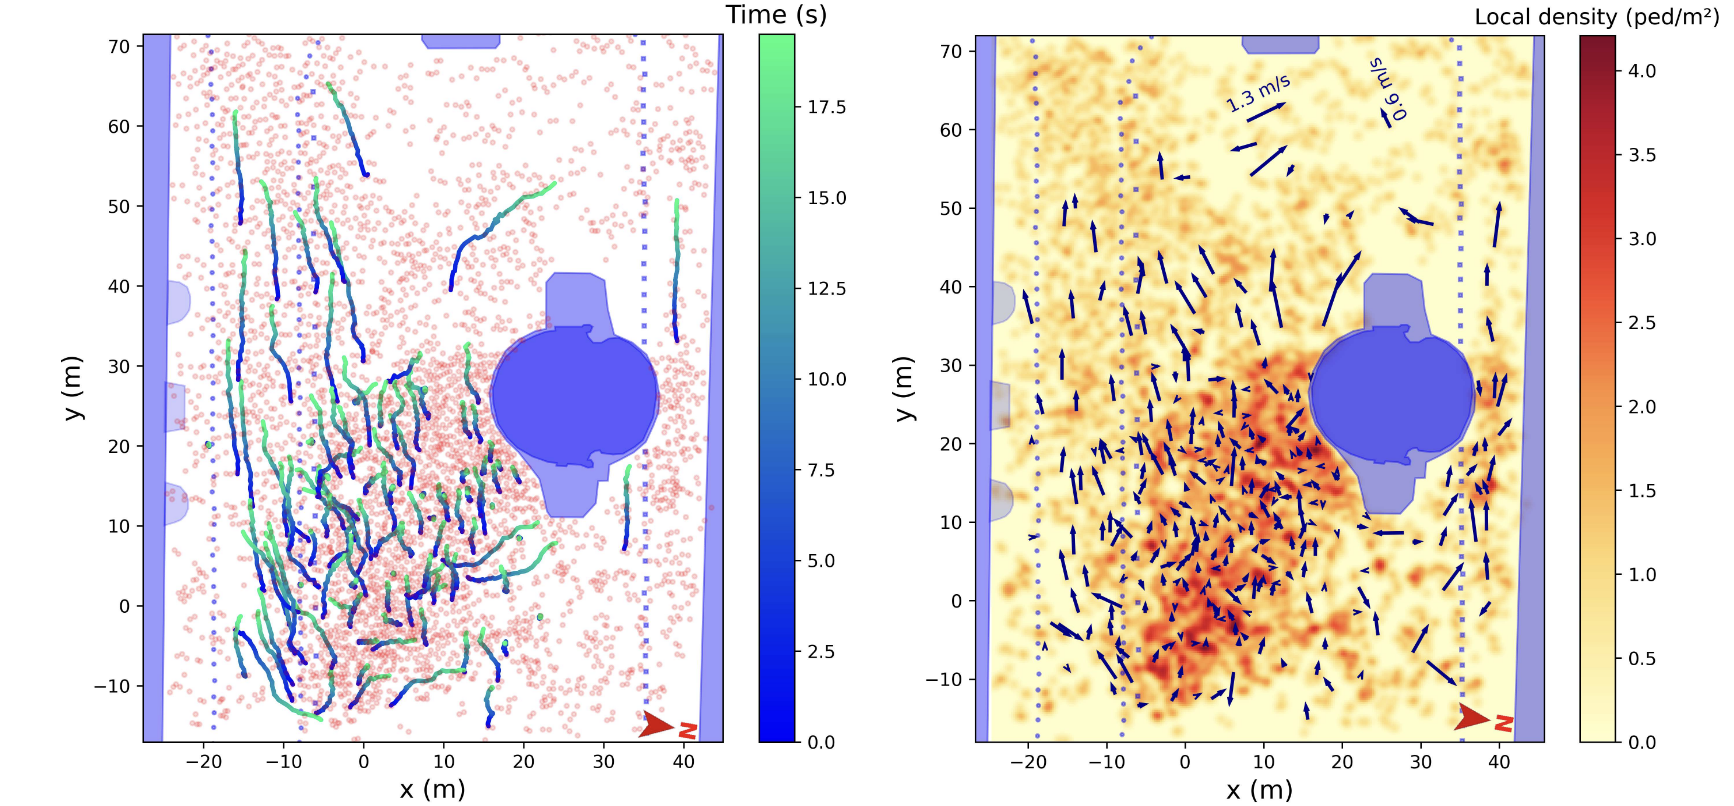
For our analysis, we used an open-source Python library called PedPy and other openly released home-made Python scripts. It helped us compute useful quantities like:
- Density: How many people are in a certain area at a given time?
- Speed: How fast do people move?
- Flow: How many people pass through a specific location?
All of these help us understand and predict pedestrian behavior—which is critical for designing safe and comfortable public spaces.
Open Data + Open Tools = Open Possibilities
This project is more than a dataset. It’s a proof of concept: when we publish our data and our tools and our methods, we make it possible for others to build on top of our work.
We've made available several resources including video recordings that have been thoroughly documented and described, processed trajectory datasets complete with detailed metadata, interactive visualizations that you can access directly in your browser. We also offer open-source tools designed for analysis and tracking purposes.
We hope this work sparks new ideas—not just for researchers, but for anyone interested in how pedestrians move through the world.
Why This Matters—For Everyone
Crowds aren't abstract—they're you, me, and everyone at the next concert, train station, or city square. Understanding them helps us:
- Build safer infrastructure
- Plan better public events
- Design inclusive urban spaces
But that understanding needs to be shared. If we keep our findings locked behind paywalls or closed software, we limit progress.
By embracing open access and open source, we’re saying:
Knowledge should be shared. Tools should be accessible. And science should be for everyone.
Links and references
📖 Read the full paper
🎥 Watch the fieldwork: YouTube playlist
🗺 Try the app
📂 Download the data
Follow the Topic
-
Scientific Data
A peer-reviewed, open-access journal for descriptions of datasets, and research that advances the sharing and reuse of scientific data.

What are SDG Topics?
An introduction to Sustainable Development Goals (SDGs) Topics and their role in highlighting sustainable development research.
Continue reading announcementRelated Collections
With Collections, you can get published faster and increase your visibility.
Genomics in freshwater and marine science
Publishing Model: Open Access
Deadline: Jul 23, 2026
Genomes of endangered species
Publishing Model: Open Access
Deadline: Jul 01, 2026
Please sign in or register for FREE
If you are a registered user on Research Communities by Springer Nature, please sign in