New global estimates for water footprints of crops
Published in Earth & Environment, Agricultural & Food Science, and Economics

Why these data are needed?
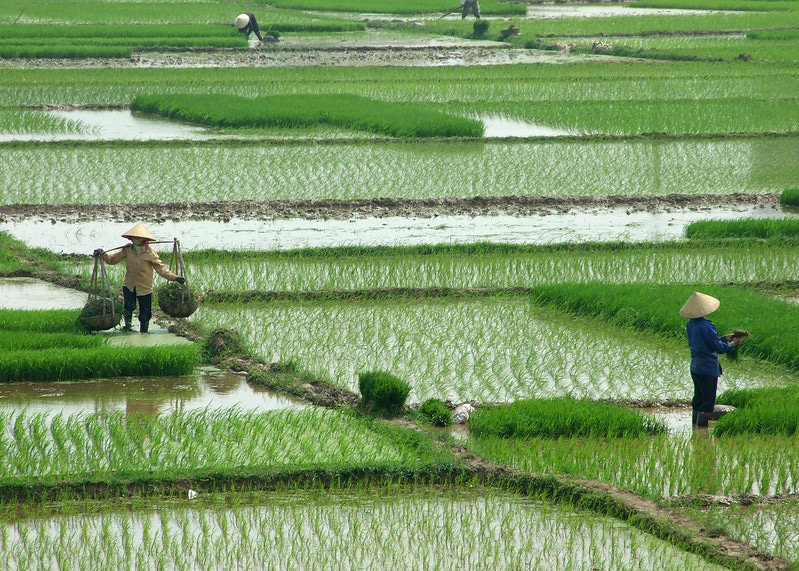
Every crop needs water. But how much? This question can be answered by calculating water footprints. This metric tells how much green water (from precipitation) and blue water (from groundwater and surface water) is consumed in order to produce a tonne of a crop. For example, 1 tonne of rice consumes 560 m3 of green water and 350 m3 of blue water on average. Understanding the water footprints of crops is essential for sustainable agriculture, as it enables us to manage water resources more efficiently and effectively, especially considering that many regions experience water scarcity.

Global water footprints of most crops were first estimated back in 2011. These estimates provided average values around the year 2000 and enabled hundreds of follow-up studies on various topics, including water management, environmental impact assessments, and environmental economics. Perhaps, the most well-known study is “The water footprint of humanity” (2012) which demonstrated the dominant role of crop production in global human water consumption.
Many years have passed since then. Crop production experienced many changes. First signs of climate change emerged. However, no new major update of water footprints was on the horizon. This is where the current study comes in. It provides fresh estimates for water footprints of 175 individual crops from 1990 to 2019 using the best available input data and methods.
Challenges in estimating water footprints
Estimating global water footprints of crops is not an easy task. First, you need to develop a crop model able to calculate water footprints. Second, you need a supercomputer to run it. Then, you need more than 1TB of data storage for inputs and outputs, including the backups of both (highly recommend doing this). Finally, you need many hours to process and analyse the results. It took nearly two years starting from the collection of input data to finally publishing the dataset in the Scientific Data journal.

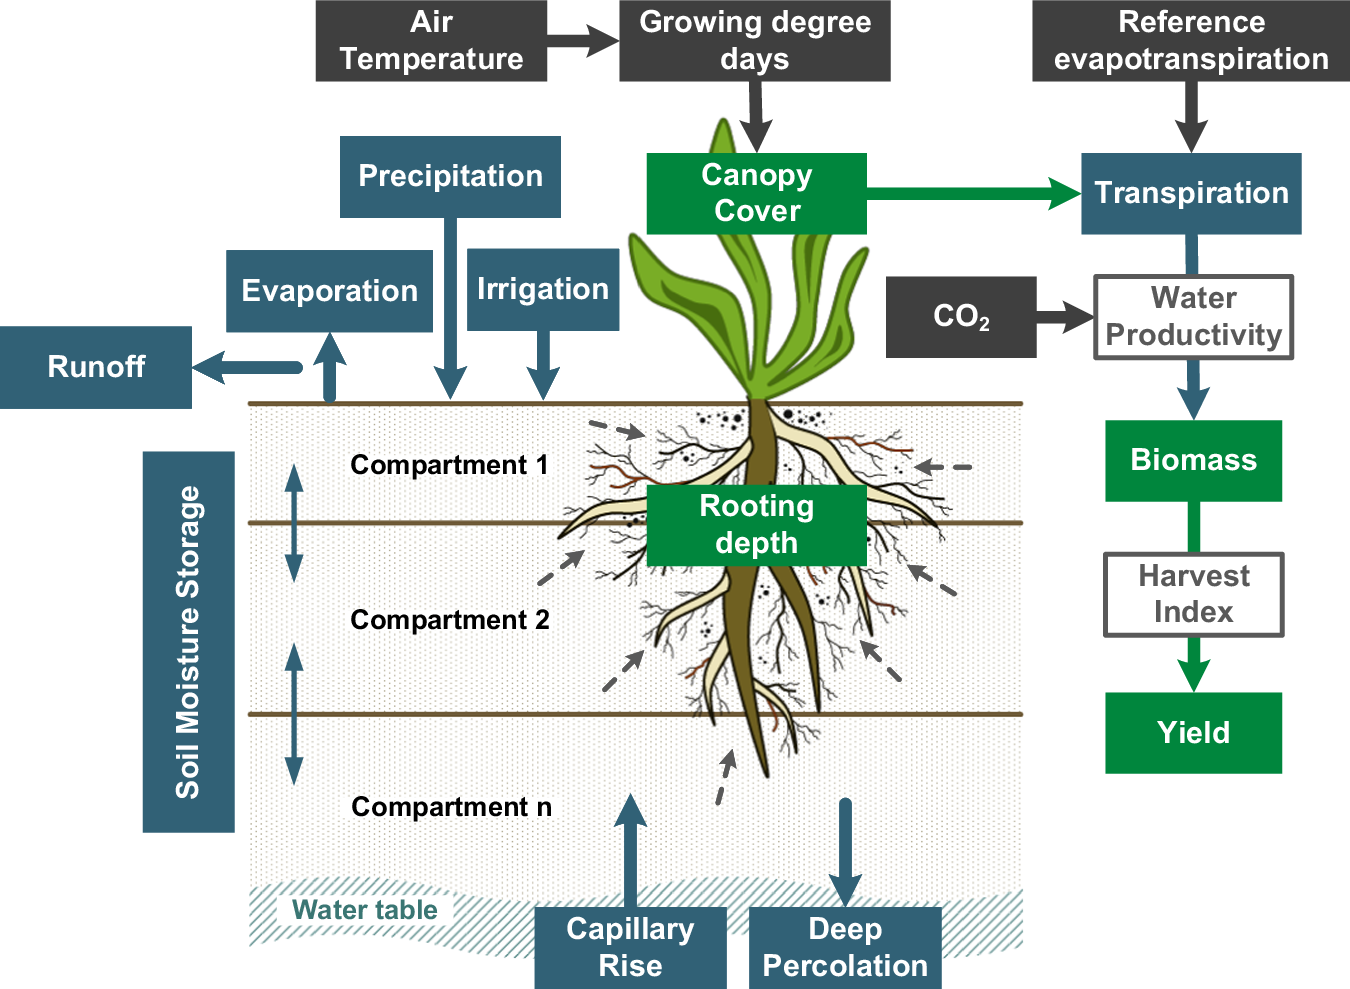
Perhaps, the most challenging part was the crop model development. It all started in 2019 with transforming FAO’s AquaCrop into a global gridded crop model ACEA. In short, this model divides the planet into 10 x 10 km grid cells and then calculates for each grid cell how much of a crop is harvested and how much green and blue water is consumed during the crop's growing season (through soil evaporation and transpiration).

The first big challenge for ACEA came in 2021 when it joined the ensemble of other global gridded crop models to provide future crop yield projections of multiple crops for the IPCC AR6 report. Around the same time, ACEA was applied to simulate global water footprints of maize (corn) over a 30-year period. Accomplishing those two tasks required a lot of programming, data analysis, and effort. As a lead developer, I spent numerous days and nights trying to fix bugs in the code or understand why the model gave the wrong results. Eventually, the confidence in ACEA’s performance and outputs reached the level needed for the next big challenge—the simulation of water footprints of 175 crops from 1990 to 2019.
New chapter in Water Footprint studies
This dataset opens a new chapter in water footprint studies. Provided data can offer insights into spatial and temporal patterns of agricultural water consumption and can serve as inputs for further virtual water trade studies, life cycle and water footprint assessments.
Currently, I am using this dataset to analyse the main trends in crop water productivity and water consumption. Spoiler alert: both water productivity and consumption are increasing in response to multiple socio-economic changes. More details will be available later this year, so stay tuned :)
The dataset is openly available at: doi.org/10.4121/7b45bcc6-686b-404d-a910-13c87156716a
ACEA source code at: doi.org/10.5281/zenodo.10510934
Follow the Topic
-
Scientific Data

A peer-reviewed, open-access journal for descriptions of datasets, and research that advances the sharing and reuse of scientific data.
Related Collections
With Collections, you can get published faster and increase your visibility.
Data for crop management
Publishing Model: Open Access
Deadline: Apr 17, 2026
Data to support drug discovery
Publishing Model: Open Access
Deadline: Apr 22, 2026


Please sign in or register for FREE
If you are a registered user on Research Communities by Springer Nature, please sign in