Piecing together the past: building a 200-year global sea-level database
Published in Earth & Environment

Why do we need long-term sea-level data?
Sea-level rise is one of the biggest challenges our planet faces today, largely driven by human-caused climate change. Predicting how much sea level will rise this century and beyond is really difficult because we don’t fully know how different processes (like melting ice or warming oceans) contributed to past changes or indeed how they will contribute in the future. Long-term sea-level data (last few centuries) enables us to understand which changes are driven by human-caused climate change and natural variability, what processes may be dominant, and how these changes vary across the world. This knowledge helps us make better forecasts of future sea-level rise, which are important to protect vulnerable coastal communities.
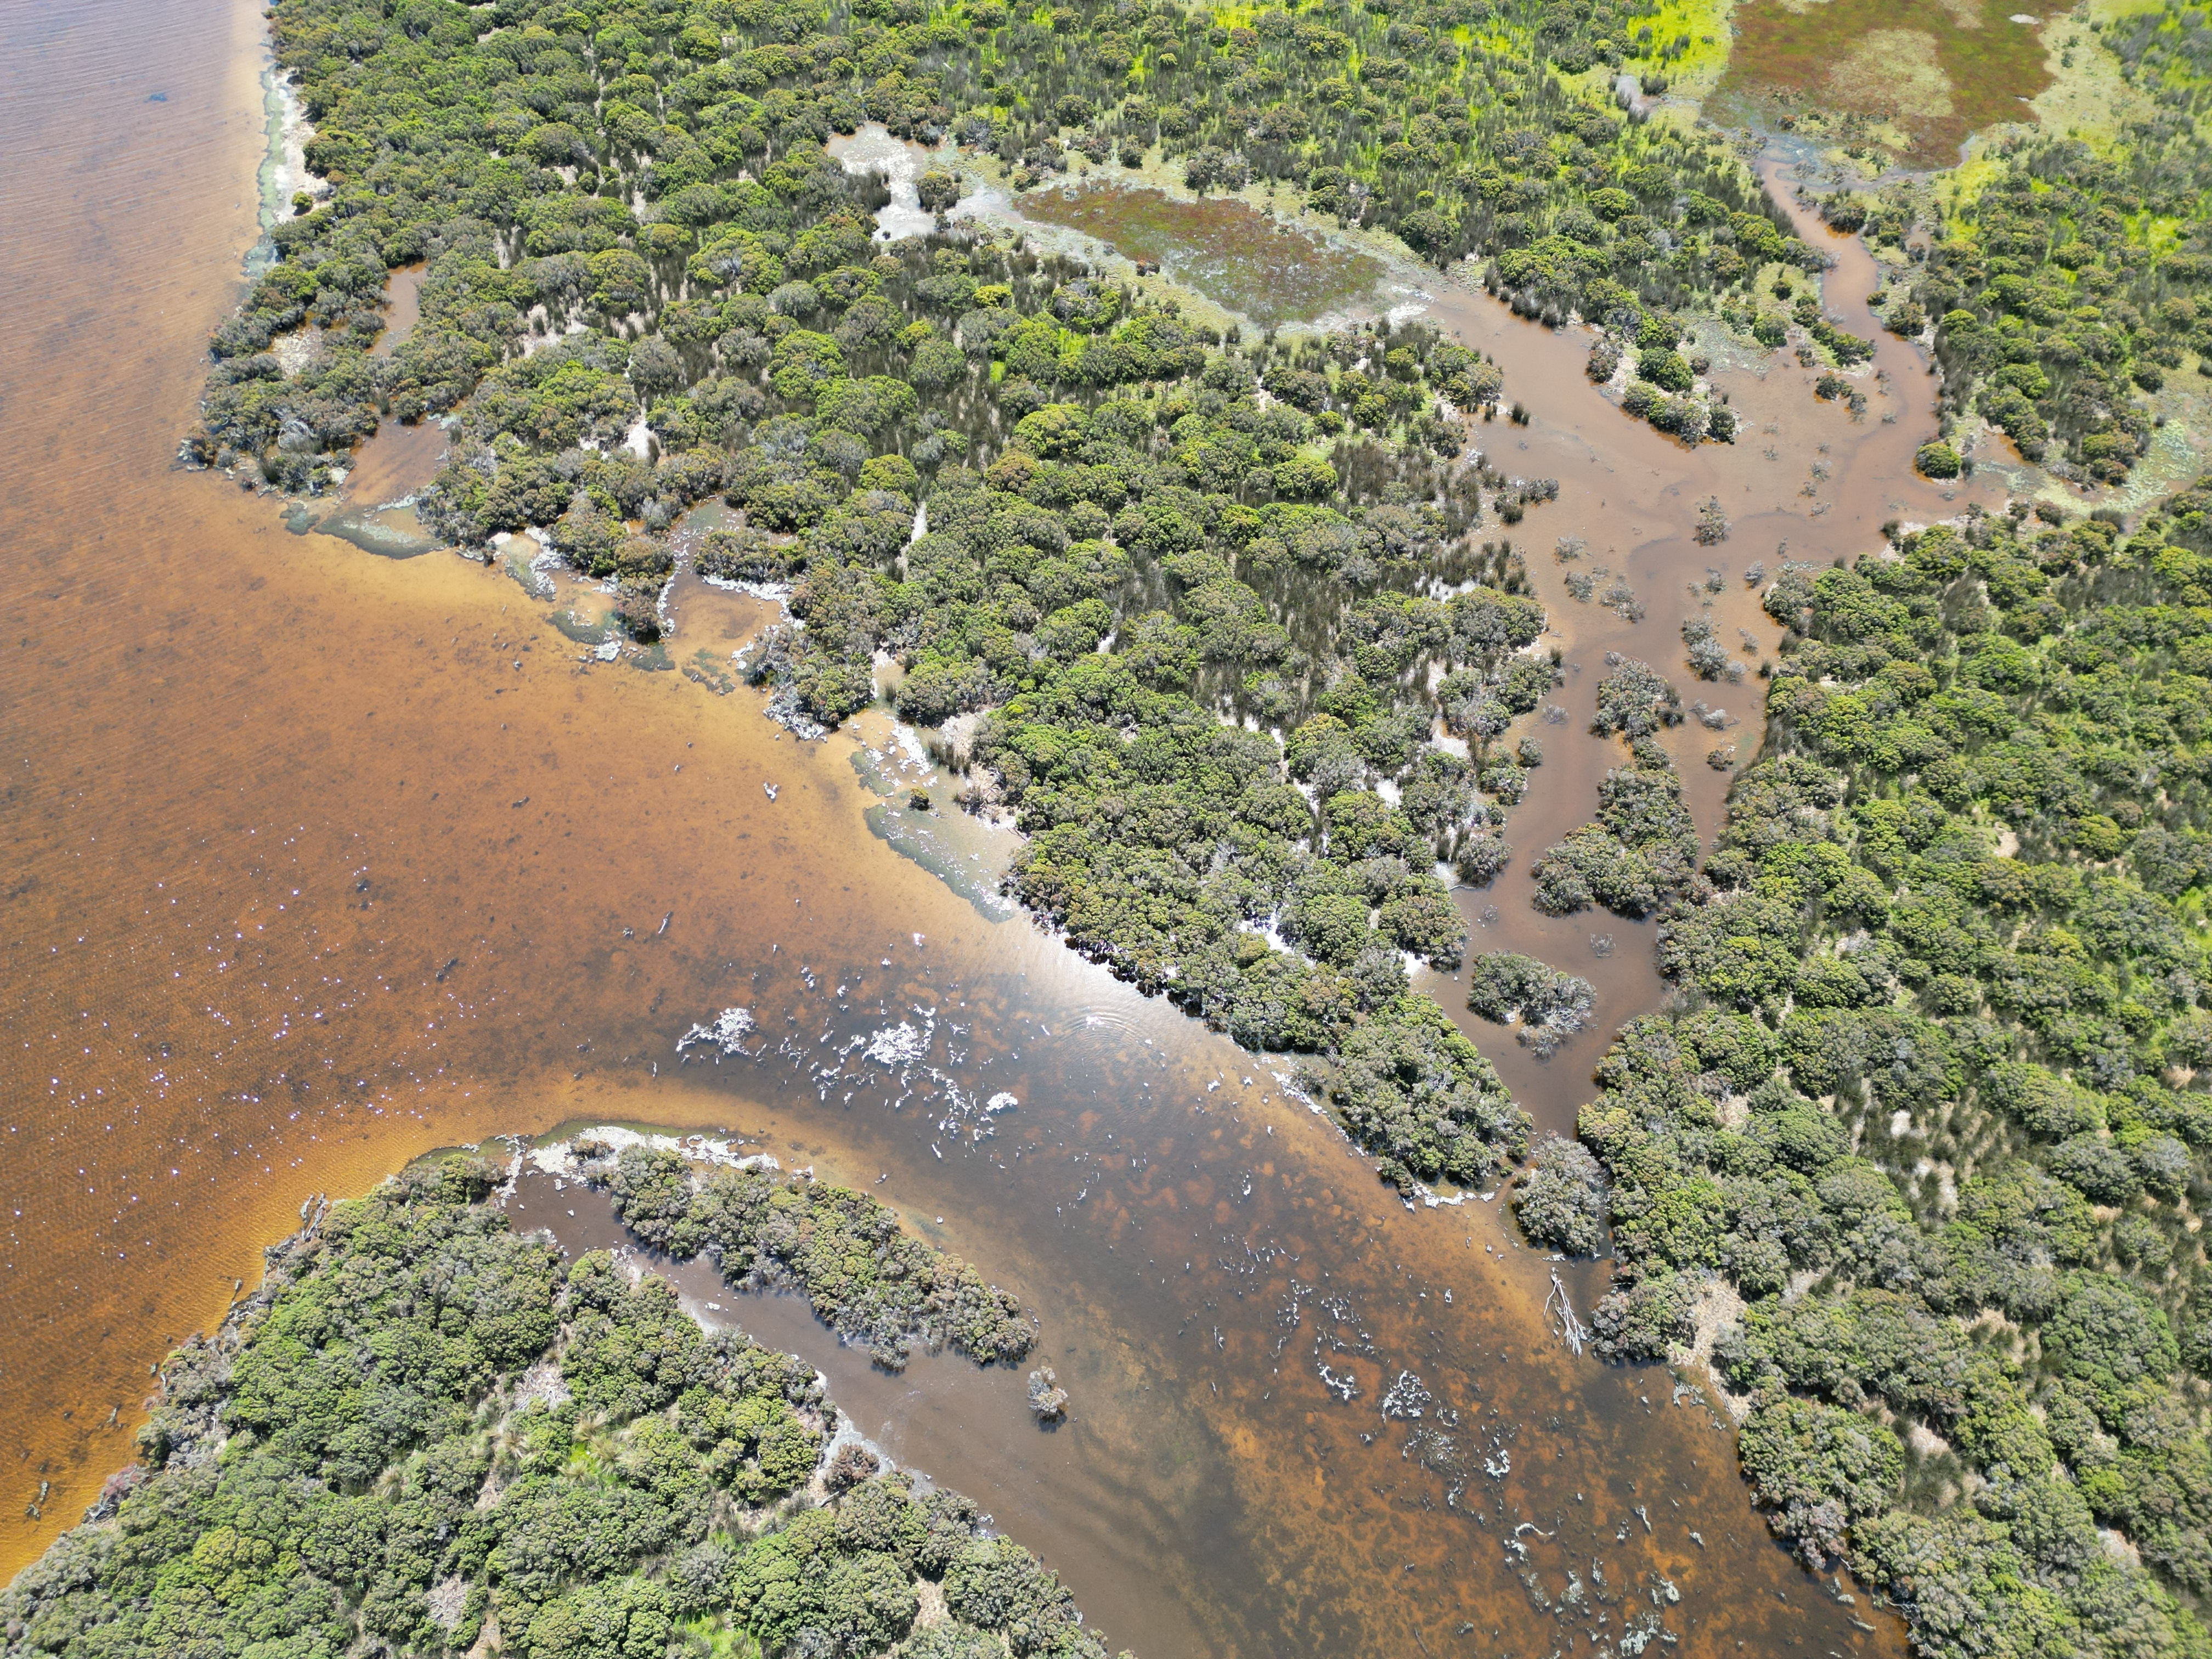
But, to track how sea level has changed across different places before ~1950 we cannot rely only on direct measurements; they are too short (satellites) or located in clusters (tide gauges). Instead, we turn to geological and biological proxies such as coral microatolls and microscopic organisms that live in intertidal environments like salt marshes that track changes in sea level. When carefully dated, they allow us to reconstruct sea-level changes over hundreds-to-thousands of years.

Creating sea-level databases
Sea-level reconstructions are typically carried out at individual sites. Each observation within a reconstruction is a single data point that includes a location, an estimate of past sea level, and the age of that estimate (with uncertainties). By combining site-based reconstructions into a global database, we can identify patterns that scale from local changes to global sea-level trends. As data availability and modelling techniques have improved, there is now the opportunity to revisit and refine age models within existing datasets to improve consistency across individual reconstructions. This helps us better line up events across different locations and compare proxy data with instrumental measurements and models. However, making these improvements depends on having access to the original raw data. This can be challenging, especially for older studies, where sharing data was not standard practice like it is today.
Behind this work
It’s worth recognising (if not immediately obvious) that behind every database, including this one, are years of data collection, countless conversations, careful decision-making, and acts of generosity from researchers who have tracked down and shared older files not originally designed for reuse. They represent the collective effort of a research community, and I am very grateful to all those who contributed data to this project.
The idea for this work emerged when we recognised that numerous sea-level reconstructions in existing global databases were based on older age models, often using now outdated modelling techniques or calibration curves. Without access to the raw, original data, estimates were essentially static. We saw an opportunity to revisit these records using more recent models to improve consistency and accuracy across datasets. At the same time, there has been growing interest within the sea-level community in better understanding changes in underrepresented regions such as the western Pacific and South Atlantic. These areas remain relatively data-poor compared to the North Atlantic, yet evidence suggests that rates of sea-level change in some locations are exceeding the global average. As a result, these areas are critical for improving spatial coverage and refining global sea-level reconstructions. Additionally, many reconstructions from these regions have been published since the last major global sea-level database was compiled in 2021. This made it clear that a new, centralised database incorporating these more recent Southern Hemisphere records, and providing access to raw age data, would be a valuable resource for the community.
Bringing the database (P-1800SLD) to life proved more complicated than we first expected. In a lot of cases we were working with data that were collected more than a decade ago, requiring us to trace the original files, contact authors to cast their memory back, and piece together data from old spreadsheets, notes and publications. To make a database robust, it needs good, detailed information: where the data came from, when it was collected, how it was dated, and what the uncertainties are etc. It highlighted just how much scientific knowledge depends on careful data management and good filing systems (thankfully contributors were very organised)! It took around four years (on and off) to collate and update (where needed) age estimates for 41 sites. We focused on sites that allow us to investigate interannual sea-level variability since ~1800 CE and that could be meaningfully compared with nearby instrumental records - capturing both long-term trends and short-term variability.
We see this iteration of the database as a first step forward. Here, we update the ages of proxy data, but recent improvements in modelling mean that the vertical component of these sea-level estimates could also be further refined. Exploring this would be an important next step to improve the accuracy and precision of these reconstructions. In addition, expanding spatial coverage in the Southern Hemisphere and the (sub)tropics will help improve our understanding of past global sea-level change. Extending reconstructions across the entire Common Era (last 2000 years) would also provide a crucial longer-term context for understanding recent sea-level change. These updates would again likely require several years of work and people willing to take on the task! This project builds on the work of countless researchers who generated the original datasets and laid the foundations for this research. It has tested my persistence (and indeed at times my patience) but has also been a reminder that scientific progress does not happen in isolation, instead relying on shared knowledge, openness and collective effort.
What we found
Most sites reconstructed past sea levels using tiny fossils called foraminifera. These microscopic organisms are found almost everywhere in both temperate and tropical environments and are relatively easy and inexpensive to analyse, making them very useful indicators of past sea level. Almost all the ages of the reconstructions were determined using a combination of dating techniques, often based on naturally occurring radioactive isotopes. On average, the data show we can work out past sea level over the last 200 years within a range of about 22 cm, and when it occurred to within about ±20 years. For most sites, the updated ages we calculated closely matched the original published estimates. This is likely because many records are anchored by clear markers in the sediment (often left behind by known human activities) that act as ‘checkpoints’. However, we found that some reconstructions, particularly those dated using lead-210 methods, benefitted significantly from new statistical methods, improving confidence in age estimates.
One of the key outcomes of this work is that all raw data are now openly available, this means that users are not limited to a single modelling approach and can reanalyse the data where needed (including pre-1800). Overall, the database shows that sea level has not changed in the same way everywhere over the last 200 years. Instead, different parts of the world have their own sea-level history, shaped by local processes like melting land-based ice, ocean warming and the movement of the land itself.
Do proxy data exhibit the same trends as direct sea-level data on short and long-term timescales?
We compared our proxy reconstructions in P-1800SLD with nearby tide-gauge records. Tide gauges provide high-resolution measurements of sea level, often recorded hourly or even more frequently. However, they capture short-term variability that is not directly comparable to geological/biological proxies, which smooth variability over time and include additional uncertainties. To make a fair comparison, we averaged tide-gauge data over the same time window represented by each proxy observation. This comparison showed that proxy records capture both long-term trends and much of the year-to-year variability in sea level. While they are not perfect “geological tide gauges”, they provide a reliable extension of sea-level records back in time, helping us address some of the big questions about past, and crucially, future sea-level change.
Evolving Norms
The use of scientific databases is changing. Rather than being static archives of data or a template one must fill in to meet open access criteria, modern databases are becoming interactive tools with user-friendly interfaces that let researchers engage directly with data through visualisation and exploration. The HOLSEA data hub (https://holsea-datahub-alpha.vercel.app/) is a great example of how collaboration can shape and strengthen resources for the benefit of science. It brings sea-level records together into a single, standardised resource, allowing users to explore trends, visualise changes in sea level over time and download datasets ready for analysis. The power of databases lies in their role as a shared resource that is inherently dynamic, shaped by new data, tools, and perspectives. However, a word of caution - once you create one, you’re in it for the long run!
I am a sea-level scientist who studies how and why sea level has changed through time. Fundamentally I am interested in how understanding past sea-level trends helps us better anticipate future changes.
My research combines geological and instrumental records to understand patterns of sea-level variability across different regions and timescales, and how the processes driving these changes - such as melting ice sheets and glaciers and warming oceans - evolve over time.
Follow the Topic
-
Scientific Data
A peer-reviewed, open-access journal for descriptions of datasets, and research that advances the sharing and reuse of scientific data.

Related Collections
With Collections, you can get published faster and increase your visibility.
Computer vision in plant science and agriculture
Publishing Model: Open Access
Deadline: Oct 10, 2026
Wearable and Computer Vision Data for Health and Behaviour Research
Publishing Model: Open Access
Deadline: Aug 08, 2026


Please sign in or register for FREE
If you are a registered user on Research Communities by Springer Nature, please sign in