The Networked Population: Why Understanding Connections is Key to Global Health (Introducing SEEDNet)
Published in Social Sciences, Earth & Environment, and Physics
Rethinking Population Health: Why Networks Matter
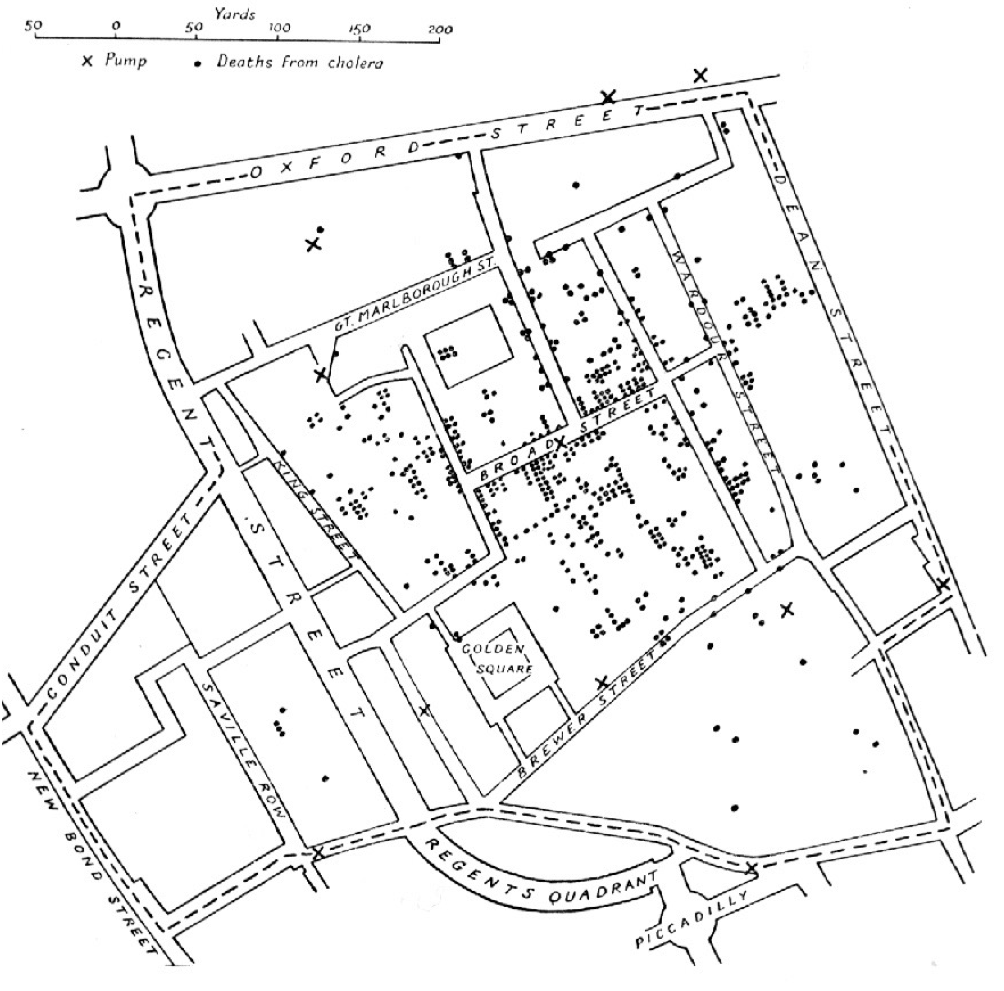
For decades, epidemiologists have worked tirelessly to understand and improve population health. Traditionally, this often involved treating populations as collections of individuals, grouped by characteristics like geography, income, or education. Mapping disease outbreaks based purely on where cases occur was how epidemiology was born, when Dr. John Snow produced the famous cholera map from 1854, which showed cases clustered around water pumps in London. While groundbreaking at the time, this approach primarily focused on location rather than the underlying interactions that facilitate spread.
But what if we're missing something fundamental? What if populations are better understood not as static lists of individuals or arbitrary geographical units, but as complex systems?
Populations as Complex Systems
Complex systems are those where the overall behaviour, known as emergent behavior, is more than just the sum of its parts. The interactions between the individual units create properties that cannot be understood by studying the units in isolation. Examples include neurons in a brain, individuals in a society, or cars in traffic.
In the context of population health, this means recognizing that health-related factors – not just infectious diseases, but also ideas, behaviors, and beliefs – can spread through a network. This concept, sometimes called social contagion, applies to everything from smoking habits to recycling practices, healthy behaviours, and even rumors.
A key hypothesis in this network-based view is that health indicators measure quantities that are transmitted through a network (signal passing). The strength of this transmission is thought to be proportional to the number of contacts within and between communities (which are the nodes in this network representation). These contacts depend on factors like the size of the community (more people, more interactions) and their proximity, which reduces the effort needed to interact. Interactions between communities also depend on their size and proximity (like travel time or attraction/repulsion).
Viewing populations this way highlights the limitations of traditional reductionist approaches that simplify complex systems by artificially partitioning them or assuming components are independent. Grouping people arbitrarily, such as solely by linear distance or administrative boundaries, might not capture the true community structure that emerges from actual transmission chains based on activities and settings.
To study populations through the lens of network science, we need network representations of populations. This is where SEEDNet (Settlement-level Epidemiological Estimates Database for Network Analysis) comes in. SEEDNet is a multi-country public library specifically designed to provide network representations of populations. Our core goal was to develop a reliable pipeline to produce these representations, particularly focusing on low- and middle-income countries (LMICs) where the data gaps are major barriers to decision-making and development.
In the SEEDNet framework, the nodes of the network are defined as population settlements. The connections, or edges, between these settlements are defined by factors like existing physical paths (e.g. roads), the distance between these nodes, and models that characterize these interactions, such as gravity or maximum entropy, for example. The edges that connect the settlements are being finalized and will be available in our library soon.
Addressing the Limitations of Traditional Methods for small area estimates.
Current methods for producing small-area estimates (SAEs) of health indicators often face challenges, especially in LMICs. Many rely on combining data from national health surveys (like Demographic and Health Surveys - DHS) with data from various external covariate sources. While useful, this injects uncertainty into the estimates and makes it difficult to compare results consistently across different countries or over time, as the input data sources and methods vary. Furthermore, these methods are often computationally intensive, partly because they estimate indicators for all areas of a grid, including vast uninhabited regions.
SEEDNet addresses these limitations with a novel approach that is covariate-free and focuses specifically on populated areas. Our team wanted to study populations as networks, but a library of datasets suitable for complete representations of populations as networks, with a reasonable and controllable (or at least quantifiable) uncertainty did not exist.
This is an important point and a key reason behind SEEDNet’s covariate-free nature. Because we would not be able to quantify the amount of error that would seep into the network features if we built it using varied non-standardized sources, we would not be able to assess if the variation in immunization rates, in the choice to deliver a baby in a facility or at home, or in the practice of breastfeeding was due to differences in network dynamics, or in data quality or uncertainty of underlying sources/inputs.
SEEDNet was built with the goal of studying populations as networks. It fills a data gap and major barrier to the study of population dynamics through network methods; the lack of standardized small area estimates of health indicators in LMICs that is aggregated at a functional unit level (the settlement), and that minimizes the sources of variability and error in the estimates.
How SEEDNet Works: A Covariate-Free Approach
In addition to being covariate-free, SEEDNet prioritizes simplicity, open-source tools and data, standardized inputs, scalability and automation.
- Settlement Identification: Instead of arbitrary geographical units or gridded surfaces, SEEDNet uses global high-resolution datasets like the Global Human Settlement Layers (GHSL) to identify the boundaries of population settlements of all sizes. The focus on settlements allows for dramatically more efficient estimation (computation) by focusing only on inhabited areas of the planet.
- Data Sources: The primary data sources are georeferenced national surveys, such as DHS, which are standardized across countries and over time. It is important to note that these can be easily replaced or enriched by other georeferenced sources if they are available.
- Estimating Health Indicators: SEEDNet currently employs Local Inverse Distance Weighting (LIDW) to estimate the value of a health indicator for an area based on the known values from nearby survey clusters. The influence of distant points is reduced, and the method leverages the spatial sample of the survey clusters to produce high-resolution base maps of indicators. Crucially, estimates are only made for areas within the identified settlement boundaries.
- Aggregation to Settlements: The final settlement-level estimate is derived by averaging the values of all the pixels within a settlement's boundaries from the high-resolution map of indicators for settled areas.
- Handling Large Settlements: Recognizing that very large settlements might encompass multiple functional communities, the datasets incorporate partitioning these large settlements into smaller units centred around population peaks.
|
|
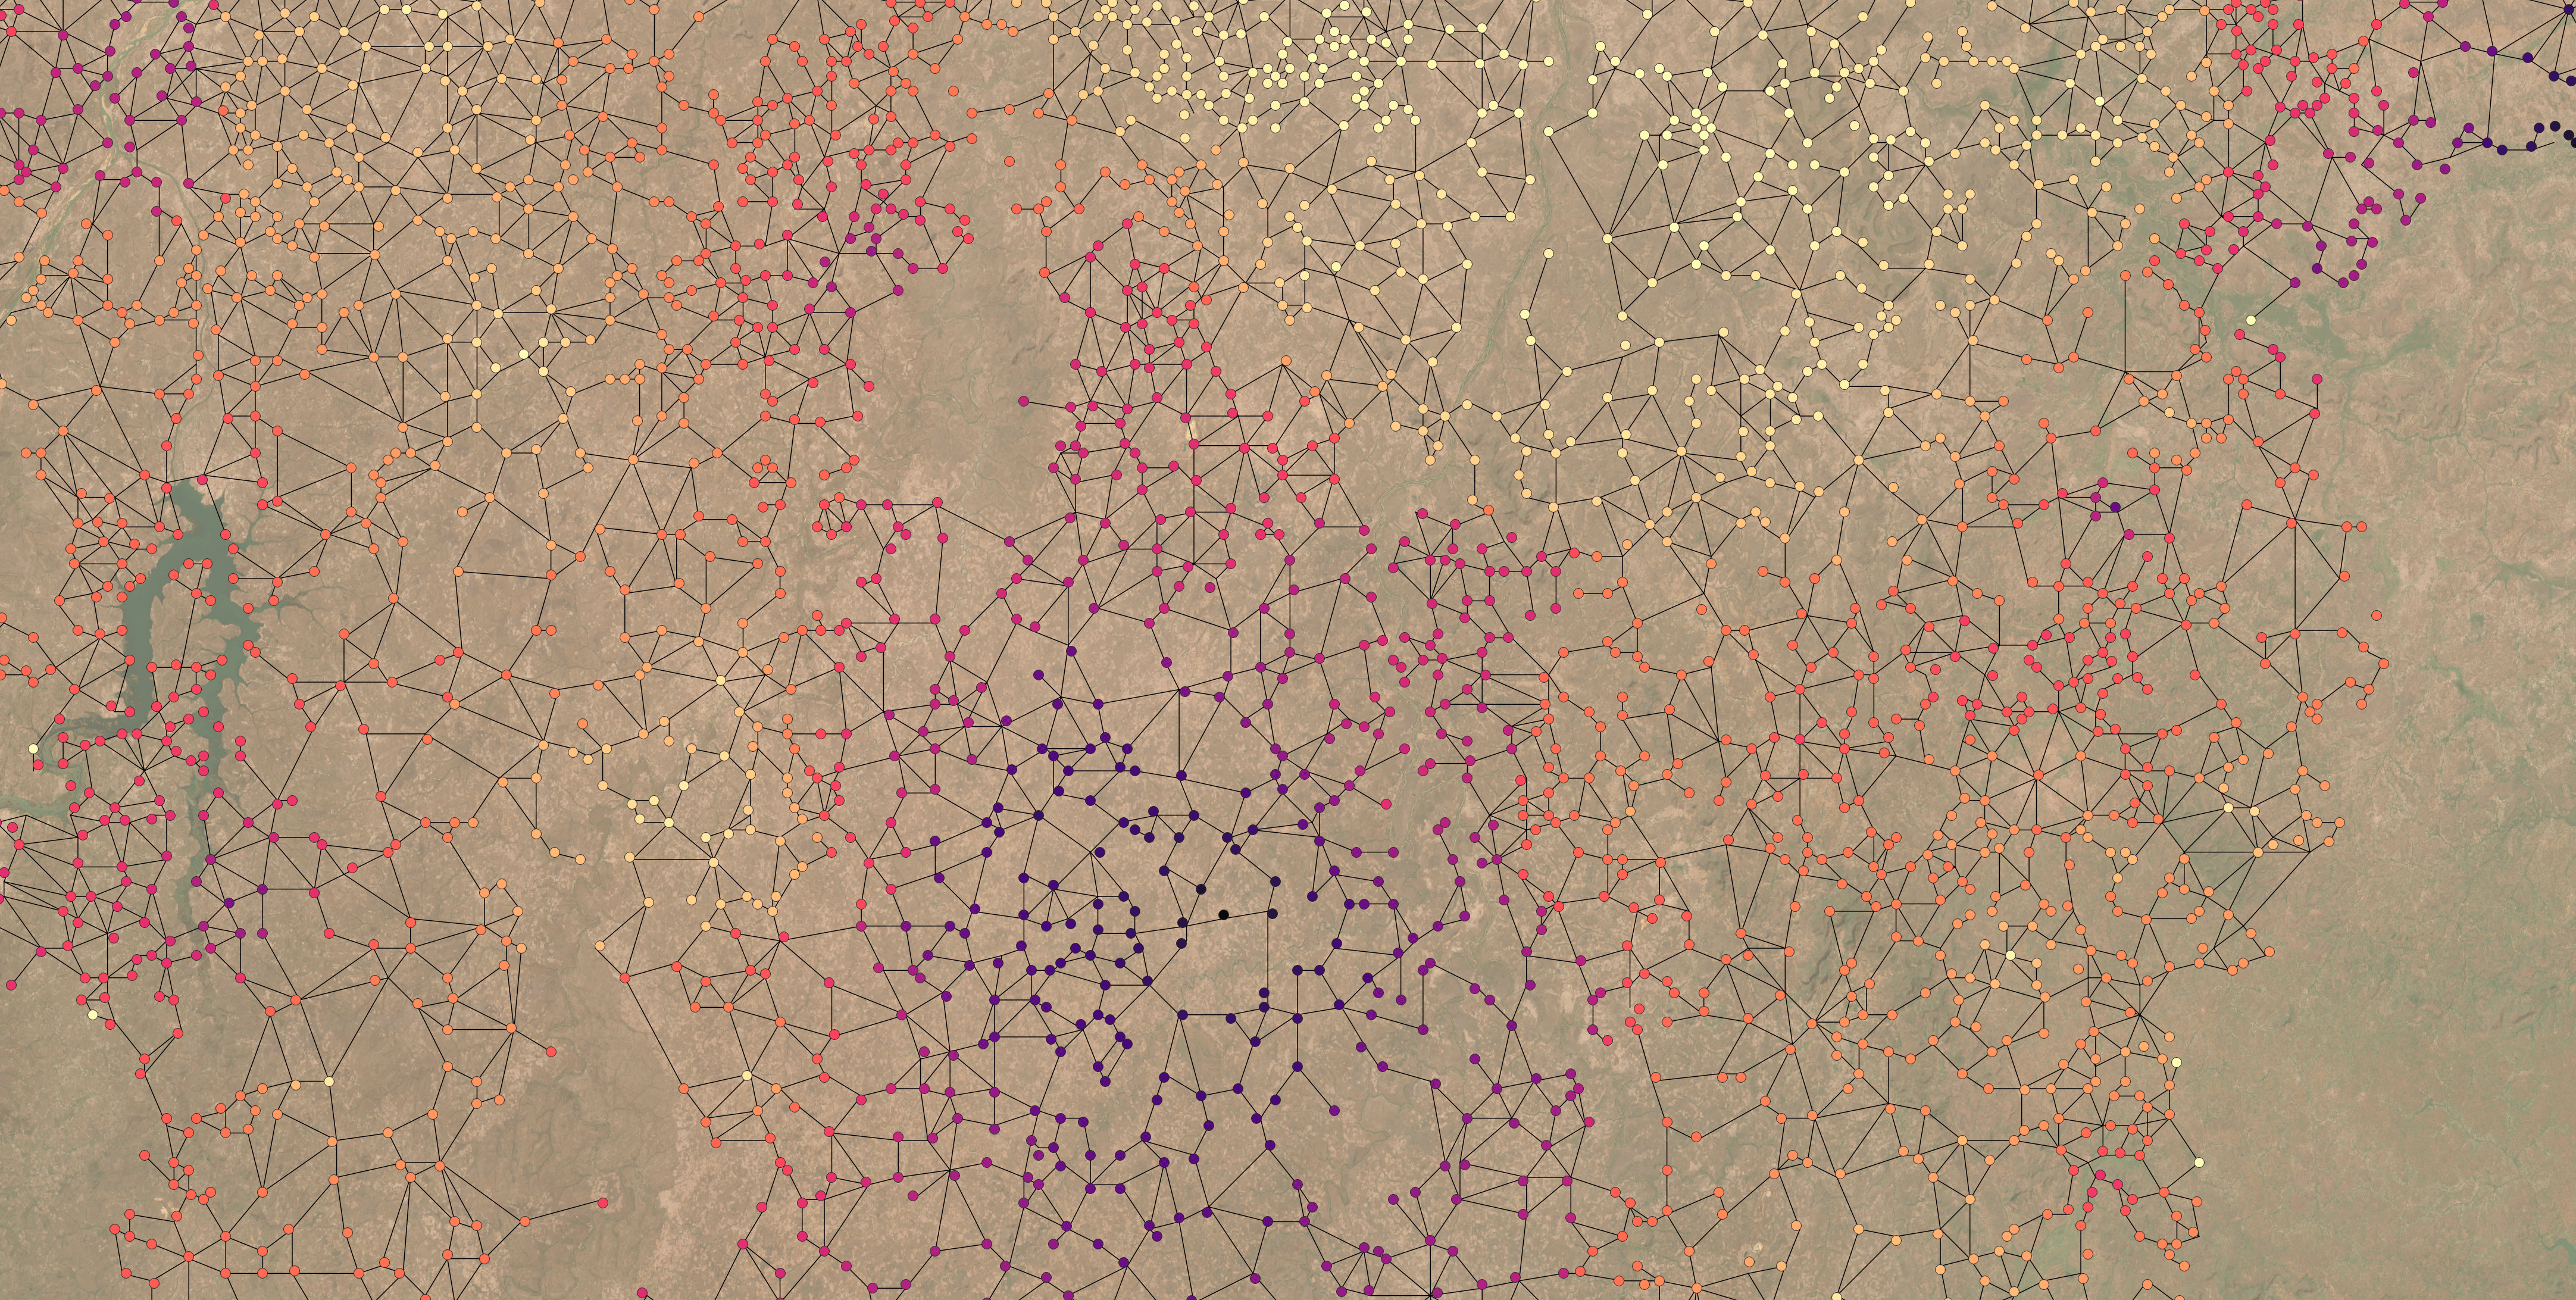
| Figure 1 - Red settlements contain at least one overlapping survey sampling unit. Blue settlements represent the remaining settlements. SEEDNet uses the information from the observed settlements (covered by national health surveys) to reconstruct the complete network, including unobserved settlements. (Côte d'Ivoire, 2021) |

This covariate-free approach simplifies the process, uses harmonized data inputs, and intentionally reduces sources of variability, making the estimates more comparable across settings. The process is designed to be automated and significantly faster than methods requiring extensive covariate data and model fitting for each region or country. It also eliminates the need to gather, clean, and integrate dozens of potentially inconsistent external datasets for each country, thereby reducing sources of unquantifiable uncertainty and improving comparability across countries.
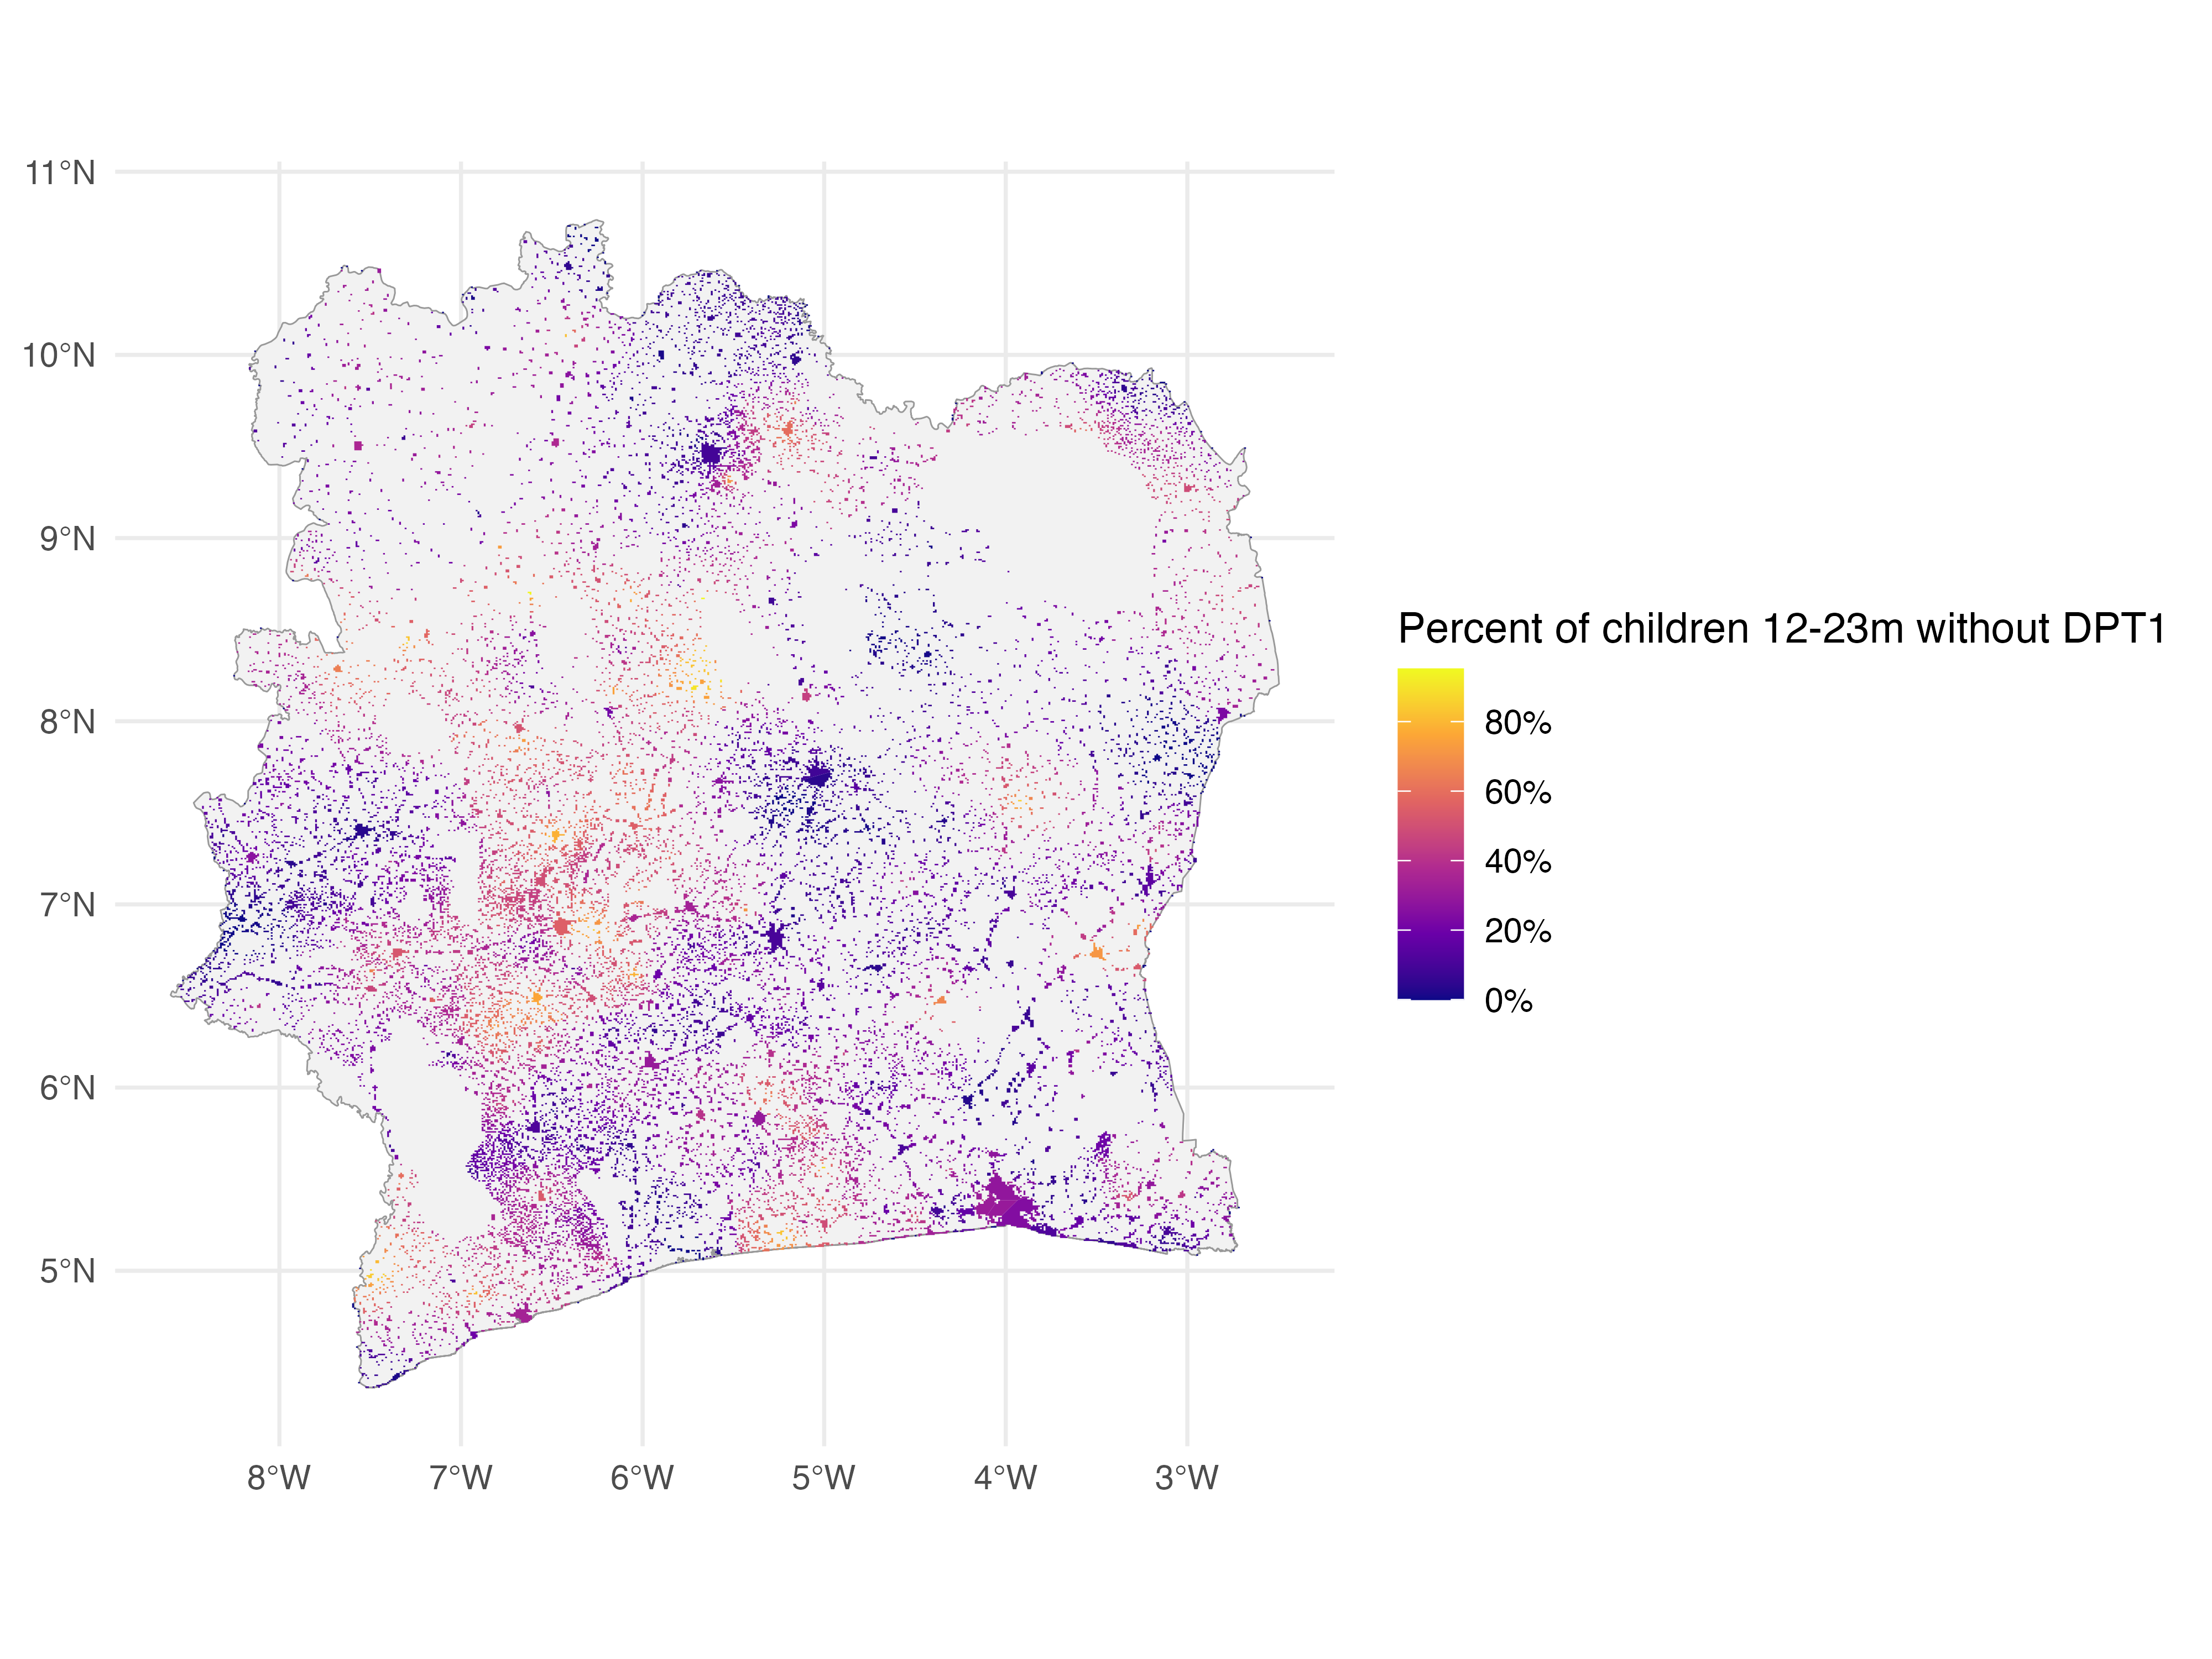 |
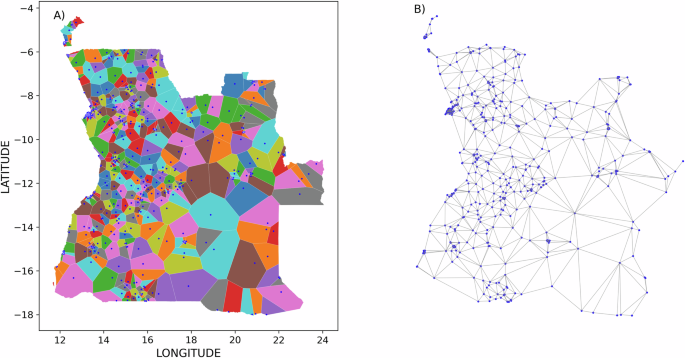
| Figure 2 - SEEDNet includes estimates for various health indicators. Here we show the estimates of zero-dose children for all settlements in Côte d'Ivoire. Zero-dose children are children 12-23 months who have not received the first dose of diphtheria-tetanus-pertussis vaccine (DTP1). Each polygon corresponds to a settlement. Côte d'Ivoire, 2021. |
Why is this such a step forward for researchers who want to study populations as networks?
SEEDNet reduces the monumental task of finding, cleaning, standardizing covariates across 50+ countries and across time and brings forward a library of node representations that sidesteps the previous complexity while reducing sources of error.
Crucially, our choice of settlements as the unit of analysis is intentional and a key feature of the database.
Settlements are meaningful functional geographic units (villages, towns, neighborhoods, cities) that represent communities, the places where people live and interact, where health issues cluster and spread. The settlements are the units that make SEEDNet a representation of the real-world, human geography and social structures. SEEDNet does not use arbitrary units of aggregation, grid cells or administrative regions because human interaction does not happen within those units. In addition, we mapped settlements of all sizes, from the smallest rural hamlet to the largest city and for each of them we estimate a series of health indicators. It is important to note that the validation results are strongest at the defined settlement level.
SEEDNet is also flexible, allowing researchers to re-aggregate the settlements into geographic regions, health administration areas, or as needed for specific projects. Our library will keep growing as we add more indicators and countries.
What is next for SEEDNet
SEEDNet gives us an unprecedented standardized view of health across settlements as nodes in a network. What happens when we map the edges, the real-world connections, the movement, the interactions between the people that live in these settlements? How could combining the connectivity data with SEEDNet health data transform our understanding of how disease spread or how health information or access diffuses through a population? What completely new questions about health equity and system dynamics could we start asking now that this kind of settlement level data is within reach?
SEEDNet tackles the biggest roadblock for applying Network Science Methods to population health in LMICs: the lack of suitable data. It provides the foundational data, giving researchers access to large-scale multi-country harmonized and validated data sets, where settlements are nodes, and key health and infrastructure indicators are the node attributes.
We spent years curating and analyzing data to arrive at a method and set of data products that lower the barrier to entry for network scientists, epidemiologists, population health researchers, and geographers to start asking questions about how the network structure of the underlying population and the connections between these settlements affect human health.
Additional insights about how these settlements are linked, how the availability of roads, migration patterns, and social ties influence population health, can be studied using the SEEDNet datasets.
We hope that this library enables us to move beyond simply mapping where health problems occur to start modelling how they might spread, how access to resources is shaped by the network structure of communities, and opens a whole new set of research questions informed by network signal transmission dynamics:
- How does the network structure and dynamics explain health inequalities and variations in disease transmission?
- How do connectivity and interactions affect health outcomes?
- Where are the critical links and the bottlenecks in the health system?
- How resilient are communities based on their network position?
SEEDNet provides the standardized base layer needed to explore these complex dynamics across different settings. It is envisioned to be a catalyst for accelerating research, through harmonized settlement-level data, empowering a community of scientists to apply network thinking to pressing Global Health challenges.
The complete and most up-to-date library can be accessed through the Borealis Canada Dataverse. Currently, it includes 153 national surveys covering 58 countries.
Scaling and The History Behind SEEDNet
The inspiration for this work can be traced back to examining urban scaling theory, which demonstrates that various urban indicators are correlated with population size. When we came across the work of Geoffrey West and Luis Bettencourt on urban scaling in 2018, we were fascinated and decided to explore whether the theory could extend to health indicators across different settlement sizes in low- and middle-income countries.
Initially, we used older data from some Demographic and Health Surveys (DHS) that had collected information about the village or town size in a proof-of-principle study. However, we quickly ran into limitations with these older surveys, such as a limited number of countries and a lack of geocoding, plus the fact that these surveys were nearly 20 years old. While newer DHS surveys included geocoding, they presented a different challenge: limited information on the population size of communities from which the sampling units were drawn, adding complexity. This early exploratory phase was a side project, fueled by scientific curiosity, but constrained by lack of funding and the limited tools available to traditional epidemiologists.
But even while working under these constraints, we were able to observe scaling of health indicators in those few surveys. Scaling is a hallmark of fractality, a characteristic of networks, and it led us to an applied hypothesis rooted in network topology:
Health indicators are quantities that are transmitted through a network.
The force of this transmission is proportional to the number of contacts both within and between communities (which are nodes in the network).
Contacts are a function of the community's size and the proximity between individuals, while interactions between communities depend on their size and proximity (travel time and attraction/repulsion).
To study how this transmission happens, a network representation of these populations was needed. These representations should show where the nodes (communities) are, their size, and gives some information to quantify the 'effort' required for interactions. Characterizing each node involves understanding its population size (as it relates to the within-node interactions) and density (a proxy for interaction effort).
A key challenge in building these representations using data like the DHS is the lack of open information about the location of enumeration areas (the sampling base) for most countries, so the process involved creating a network layer based on DHS clusters and using it to estimate health indicators for population settlements identified through other open sources of data. This network-based approach was found to be faster and more suitable for automated tasks compared to traditional spatial generalized linear models (GLM) that require multiple covariate sources and country-specific model fitting.
The SEEDNet project was developed so our team could study population health through network science methods, but as we progressed, it became also an initiative to create an open-source data library providing settlement-level estimates of health, demographic, and environmental indicators across multiple low and middle-income countries (LMICs) that could be a resource for a much broader community interested in similar questions. It was developed to address limitations in traditional data aggregation methods and facilitate network-science and epidemiological research, and to become a hub for collaborative work across these and many other disciplines.
SEEDNet utilizes a novel, covariate-free approach based on Demographic and Health Surveys (DHS) data and the Global Human Settlement Layer (GHSL). The core methodology involves defining settlements as minimal aggregation units and, currently, employing a Local Inverse Distance Weighting (LIDW) interpolation technique to estimate indicator values at a high spatial resolution (1 km² pixels), which are then aggregated to the settlement level. Validation results presented in the manuscript published today in Nature Scientific Data show that this method performs well, particularly for indicators measured with higher precision, providing valuable fine-scale data for various research and policy applications.
Soon we will add the edges that connect the settlements to the public SEEDNet library, and will work to further refine the estimates through network-based modelling approaches that consider the connection between nodes and their size.
For more details, please read our paper on Nature Scientific Data.
https://www.nature.com/articles/s41597-025-05143-0
You can access the complete SEEDNet library in the Borealis Dataverse.
Follow the Topic
-
Scientific Data
A peer-reviewed, open-access journal for descriptions of datasets, and research that advances the sharing and reuse of scientific data.

Related Collections
With Collections, you can get published faster and increase your visibility.
Genomics in freshwater and marine science
Publishing Model: Open Access
Deadline: Jul 23, 2026
Genomes of endangered species
Publishing Model: Open Access
Deadline: Jul 01, 2026


Please sign in or register for FREE
If you are a registered user on Research Communities by Springer Nature, please sign in
Love this work!
Thank you!