Unlocking Scientific Data Hidden in Charts: Behind the Development of ChartRecover
Published in Computational Sciences and Mechanical Engineering
Scientific charts are one of the most information-rich components of modern research papers. Every year, millions of charts are published across disciplines ranging from materials science and chemistry to biology and medicine. These charts often contain valuable experimental measurements that cannot be found anywhere else in the article.
However, despite the rapid development of artificial intelligence and scientific databases, most of these data remain effectively inaccessible to machines. Researchers can read a chart and immediately understand the trends it presents, but extracting the underlying numerical values often requires tedious manual work. Existing tools typically depend on human interaction and become impractical when processing thousands of charts at scale.
Our motivation for developing ChartRecover originated from this challenge. As we worked on large-scale scientific data collection and AI-ready database construction, we repeatedly encountered valuable experimental results that existed only as images embedded in publications. We realized that unlocking these hidden data resources could significantly accelerate data-driven scientific discovery.
The Challenge We Did Not Expect
When we first set out to automate chart extraction, we assumed that identifying the numbers on the axes would be the easy part. We thought that once an optical character recognition (OCR) system read the tick labels, we could simply map those text boxes to their corresponding numerical values.
However, we quickly hit an unexpected roadblock. We found that even small visual offsets between the text labels and the actual tick marks produced massive errors in the recovered data coordinates. Because of variations in font sizes, line spacing, and general layout, the visual center of a text label rarely aligns perfectly with the physical tick mark. If we directly used the text's center point as our anchor, those tiny pixel deviations amplified into significant systematic mapping errors when calculating the final scientific values. This seemingly minor detail—the slight misalignment of text—became one of the biggest obstacles to achieving high-fidelity data extraction.
Building ChartRecover
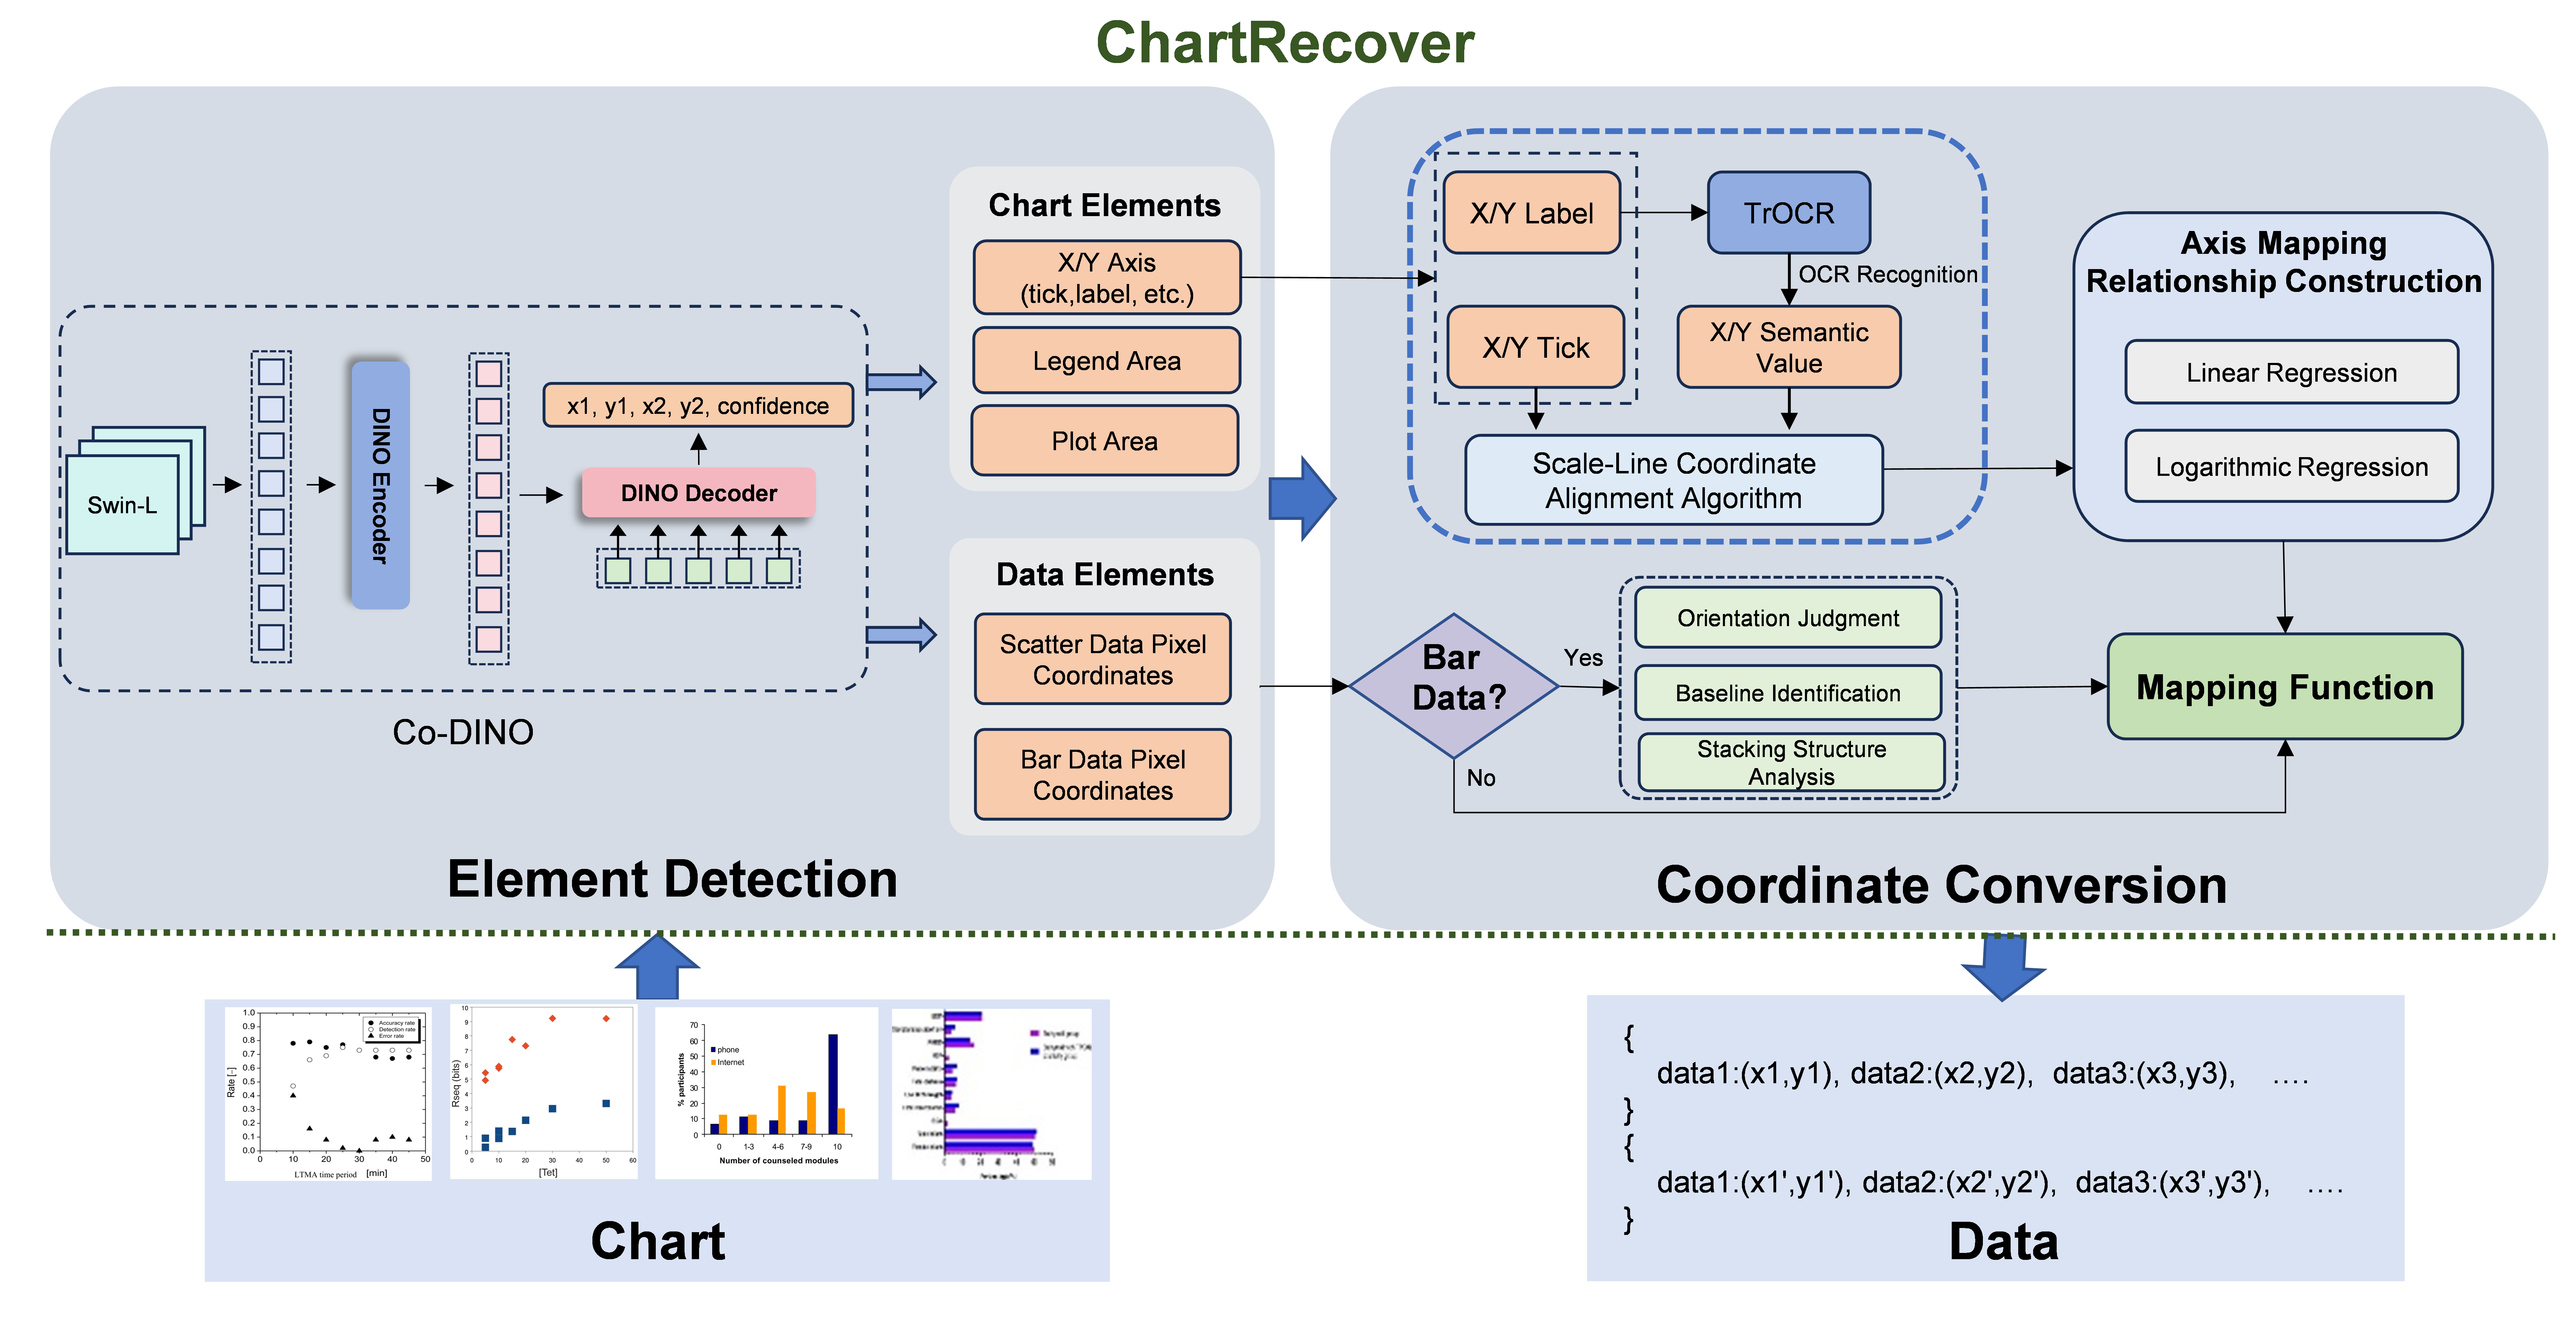
To solve these issues, we developed ChartRecover(https://www.nature.com/articles/s44172-026-00691-8), an end-to-end framework designed to interpret charts much like a human researcher does, but at machine speed. We built the system around three core capabilities:
- Element Detection: Instead of relying on rigid, pre-programmed templates, our system uses an object detection architecture to intuitively identify common chart components. It robustly detects axes, tick marks, legends, and the actual data points across a wide variety of visual styles and complex layouts.
- Coordinate Recovery: To overcome the text deviation problem, we introduced a specialized algorithm that precisely associates the semantic meaning of the tick text with the exact physical pixel coordinates of the tick mark. By treating the physical tick mark as the true anchor, we successfully eliminated the impact of text rendering offsets, establishing a highly accurate mapping between the image pixels and the real-world numerical scales.
- Adaptive Parsing: In the real world, charts are messy and diverse. Bar charts, for instance, can be horizontal or vertical, and their data can be independent or stacked. We engineered ChartRecover to systematically analyze the geometric overlap and boundaries of these structures. This allows the system to automatically distinguish between stacked and non-stacked data geometries, establishing accurate baselines regardless of the journal's unique plotting conventions.
From charts to Scientific Knowledge
By transforming static images into machine-readable numbers, ChartRecover opens entirely new possibilities for building large-scale, AI-ready scientific databases.
Historically, building databases for materials science, chemistry, or biomedical research required researchers to manually interact with extraction tools—a process completely unsuited for large-scale scenarios. Now, researchers can automatically recover absolute measurement data directly from visual plots. This structured data can immediately support advanced downstream applications, such as large-scale structure-property relationship mining. By making this data accessible, we can accelerate the screening of new catalysts, the discovery of novel battery materials, and the construction of comprehensive scientific knowledge graphs.
Looking Ahead
More broadly, we hope this work contributes to a future in which scientific charts become as searchable and reusable as scientific text. Unlocking the vast amount of empirical evidence currently trapped inside published charts could significantly expand the resources available for AI-driven scientific discovery.
As the shift toward automated, high-quality data accumulation continues, tools like ChartRecover will be at the forefront of facilitating the broader reuse of global scientific data. Ultimately, by making the data behind the charts accessible to everyone, we can enhance research transparency, improve automated scientific verification, and ensure that no valuable experimental result is left behind simply because it was published as an image.
Follow the Topic
-
Communications Engineering
A selective open access journal from Nature Portfolio publishing high-quality research, reviews and commentary in all areas of engineering.
Related Collections
With Collections, you can get published faster and increase your visibility.
Generative AI for mechanical engineering design and optimization
Publishing Model: Open Access
Deadline: Dec 31, 2026
Engineering Solutions in Wind Energy Systems: Design, Efficiency, and Sustainability
Publishing Model: Open Access
Deadline: Sep 30, 2026


Please sign in or register for FREE
If you are a registered user on Research Communities by Springer Nature, please sign in