Waiting in line for a check-up: evaluating access to NHS dental services in England
Published in Social Sciences, Earth & Environment, and General & Internal Medicine


Introduction
Access to dental care in England has been a key issue for many years with National Health Service (NHS) dentistry seen as overstretched and underfunded1, with the problem further exacerbated by the COVID-19 pandemic. This, coupled with the increasing number of dentists moving to private dentistry, has led to some patients suffering dental problems for extensive periods of time and, according to the mainstream media, resorting to performing so-called ‘DIY’ dentistry in an attempt to address their own discomfort.2 Dental access is a complex issue with many interconnected components relating to the supply and demand of NHS dentistry. These factors impact overall patient access to varying degrees with variations evident in different areas across England. This paper presents a methodology which combines these various components in the form of the Public Dental Access Index (PDAI) and provides a geographical analysis of its results to offer an overall picture of access to NHS dental care across local authorities in England. The paper is wholly transparent in how the index is developed, thus facilitating reproduction and updatability. The research also presents the results of the index by the mapping the output and consequently highlighting regions which require further improvements to patient access.
How we created the PDAI
The development of the PDAI follows a process inspired by the guide to composite indicator development set out by the Organisation for Economic Co-operation and Development to ensure a robust index is created3. The paper provides a comprehensive overview of this process, which is also overviewed in this blog in more accessible and non-expert language.
Selecting the data and spatial scale:
The PDAI uses six variables which are publicly available, facilitating the reproducibility and updatability of the index should newer data becomes available. These variables have been categorised into two groups, supply and demand. The supply variables include the number of dentists and contracted Units of Dental Activity (UDAs). The demand variables include the income deprivation scores (a component from the Index of Multiple Deprivation) and the number of households with no car access. Two more variables which are used in the PDAI include the number of delivered UDAs and the appointment success rates, both of which share supply and demand characteristics. To formulate the index, these six variables were aggregated at a local authority level to create an access score per geographical region. The local authority scale was selected given its granularity suitability to make targeted interventions for each Integrated Care Board, as well as enabling the index to be compared to other established indices for the purposes of validation.
Standardisation:
To standardise all variables, we used the total population and number of households as denominators (as applicable) obtained from the 2021 census.
Multicollinearity:
We conducted a test for multicollinearity to determine any pair of variables which had particularly high correlation and thus may be contributing the same (or a very similar) dimension to the index. In this research, no such variables exhibited overly high correlation and thus no compounding effects were evident.
Skewness:
Skewness was also considered as this can often impact the overall index score. Car ownership was the only variable which had been identified to be heavily skewed (due to cities such as London being more reliant on public transport), however, due to its importance in access to dental care, as evidenced in the literature, the variable was not excluded. A decision was also taken not to implement any kind of transformation, thus retaining the original characteristics of the data and maintaining the ease of replication of the index.
Polarity:
The polarity (or directionality) of the variables was also addressed ensuring consistent meaning across all component variables, in this sense all variables needed to operate in the same direction with a higher score indicating greater access to dental care.
Generating the index score:
Once each of the statistical operations noted above had been conducted, each of the variables were normalised using the Min-Max normalisation method, ensuring all variables were re-scaled on a uniform 0-1 numerical scale (the lowest value in a dataset being assigned the value 0, and the highest value 1). The Public Dental Access Score was then generated through summing the six component variables before applying further normalisation to the end result to create a final 0-100 scale of dental access, with 0 denoting least access and 100 greatest access. The authors believe this 0 to 100 scale makes interpretation of the index easy to understand.
What we found
The results of the research are interesting. Initially, we explored the spatial variation in each of the six component variables across England (see Figure 1), prior to aggregation into the index. The supply variables reflect higher proportions allocated to the South-East (excluding the number of contracted UDAs) with the opposite results being shown in both the South-West as well as the North of England. Local authorities in the East of England show low proportions across all variables. Further spatial variation can be found in the demand variables with appointment success rates being higher in areas such as Cheshire, the Midlands, as well as South and West Yorkshire. Higher Income deprivation scores and proportion of households with no car ownership can be found in areas across the North of England as well as in certain local authorities located around Birmingham and within London.
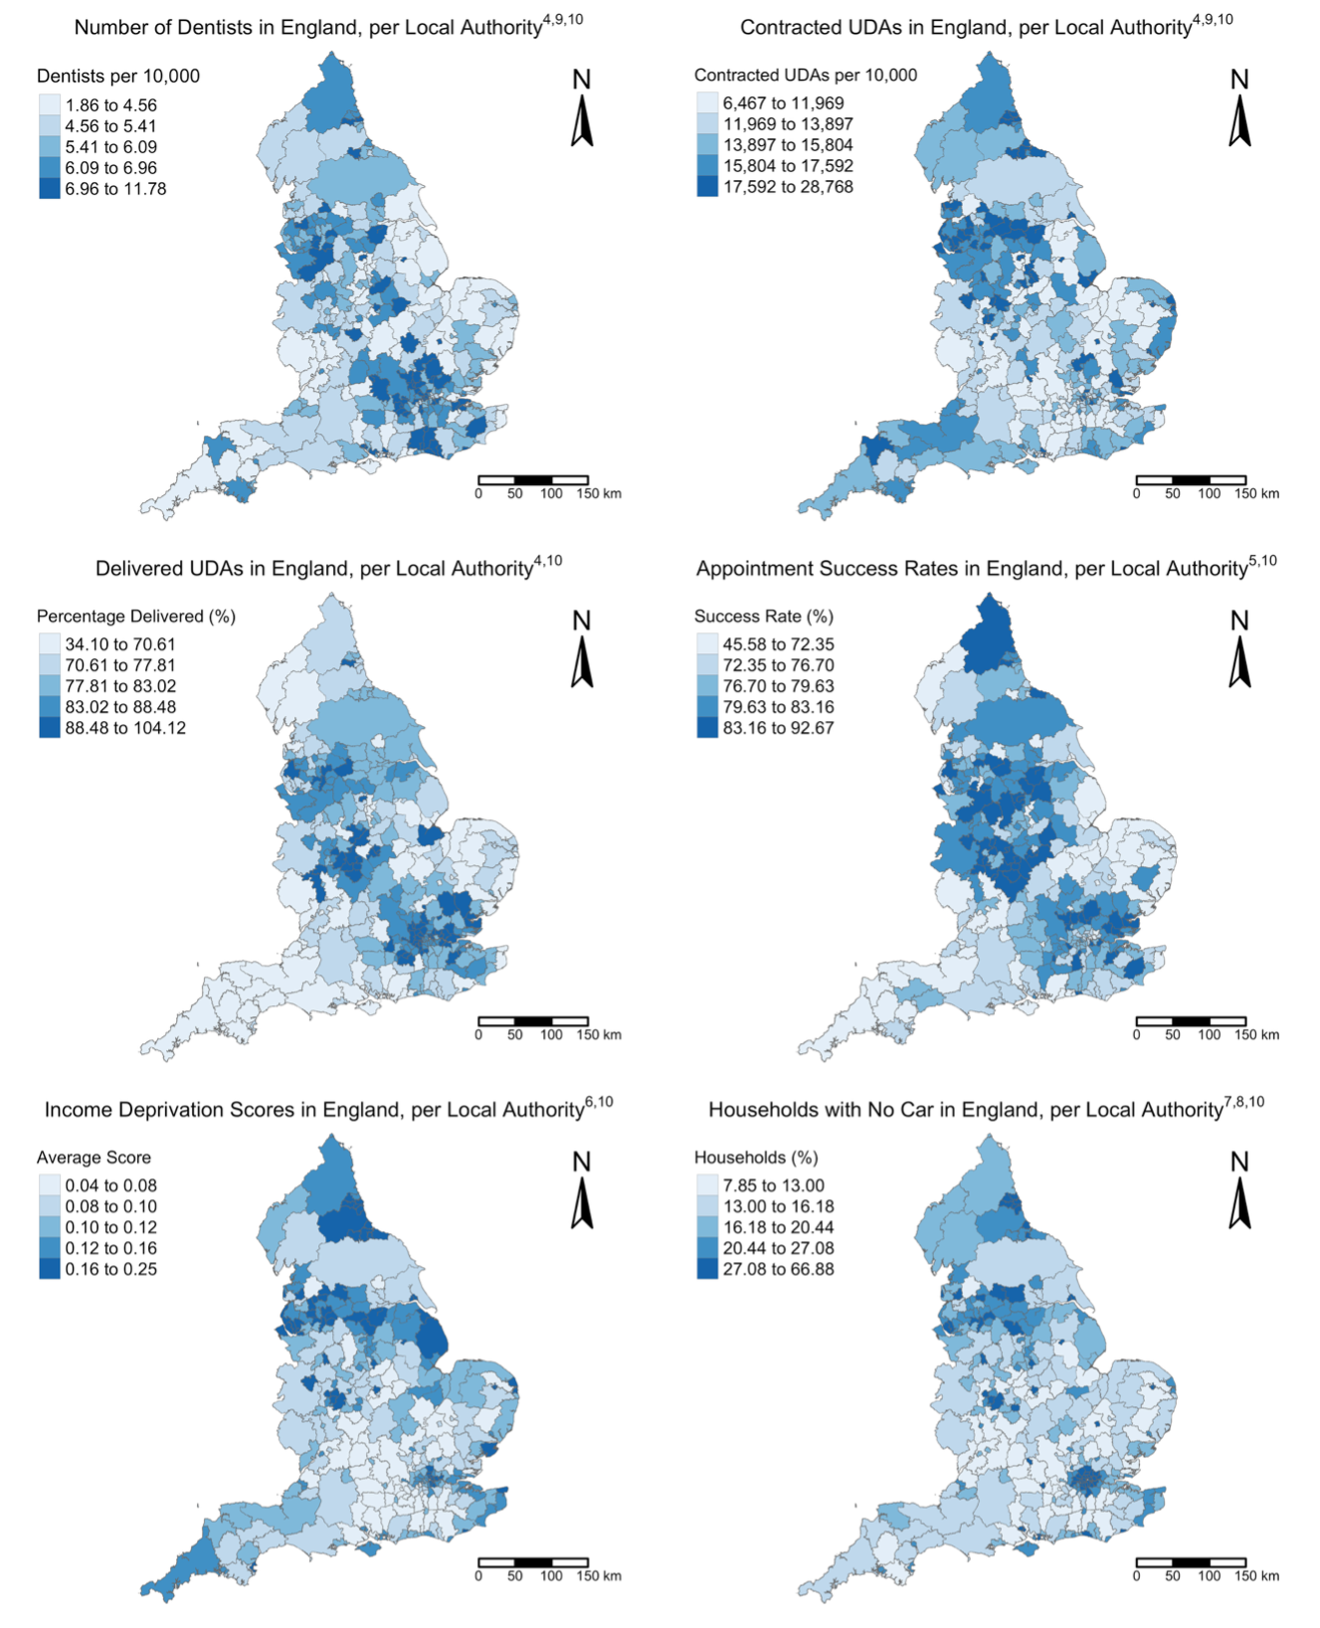
Figure 1: Map outputs for each standardised input variable 4,5,6,7,8,9,10.
Looking at the results of the PDAI (see Figure 2), local authorities with the highest access scores (in the 70-100 bracket) are primarily located between the Midlands and West Lancashire as well as local authorities surrounding the London region in the South-East of England. There are certain outliers which show high levels of access compared to the overall spatial trend in Lincoln, Fareham, and Havant.
Local authorities with the lowest levels of access are located in London, across the East and South-West of England. Local authorities in the North and North-East of England show a mix of moderate to low access with authorities such as North Yorkshire, Northumberland, Calderdale and Kirklees displaying scores of 62 to 70 compared to Bradford, County Durham, Sunderland and Cumberland with scores of 0 to 42. Despite these patterns, there are some notable outliers for lower access in both the East of England and South-West with Broadland and South Hams (as examples) showing higher access scores of 62 to 70 compared to surrounding areas.
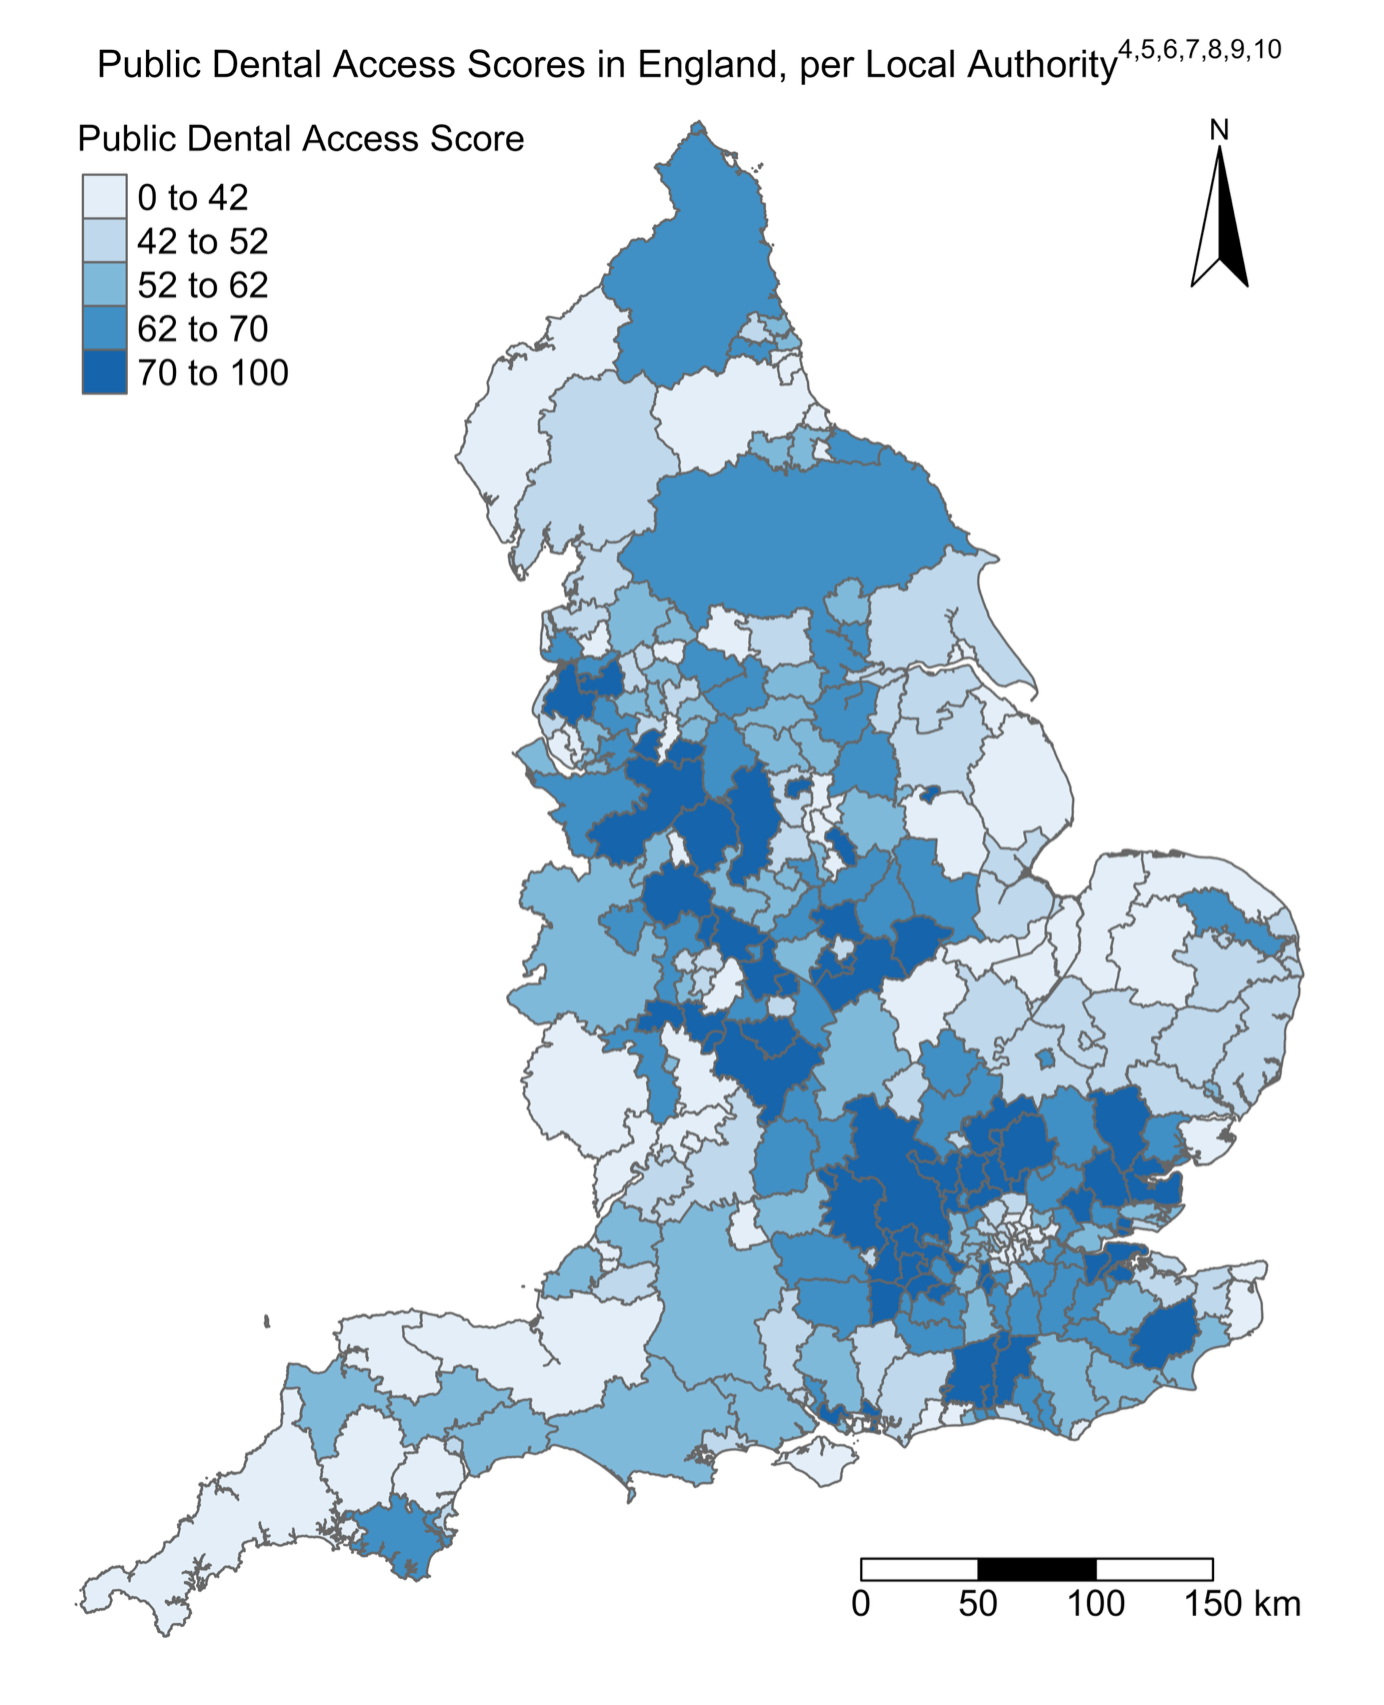
Figure 2: Map output of the Public Dental Access Index scores in England, per local authority 4,5,6,7,8,9,10.
The results from the PDAI highlight the importance of the interaction between all six variables utilised within the index. An particular example of this can be seen in the South-West of England, which presents low dental access scores. This is not solely influenced by a lack of dental professionals as the number of contracted UDAs is one of the highest per 10,000 in the country outside of the major cities. This suggests dentists in rural and coastal England are being burdened with larger contracts to meet the demands of their patients. The full paper presents a further analysis of the findings, focussing on the interplay between variables, the influence of external factors (such as private dentistry), and policies to improve access.
Conclusion
This research has come at an opportune time, when demand for exceeds the supply of NHS dental care and as a result patients are struggling to obtain the care they need, when they need it. The PDAI has highlighted local authorities most in need of intervention, and areas where access is currently favourable. Aside from presenting a transparent framework through which the PDAI can be developed, this research also encourages further investigation into the interrelationships between the supply and demand variables which in turn impact accessibility. A deeper understanding of these six impacting variables and how they relate to each other is needed in order to reach a cost-effective solution to accessible preventative dental care. Furthermore, fully understanding the importance of factors such as deprivation and car ownership would enable local governments to implement certain strategies to ultimately improve overall accessibility.
The full paper can be found at the following location, within the British Dental Journal:
Hafesji, A. and Burns, L. 2025. Waiting in line for a check-up: evaluating access to NHS dental services in England. British Dental Journal. https://doi.org/10.1038/s41415-025-8320-4.
References
- British Dental Association 2022. Lack of reform: Nearly 1/2 dentists severing ties with NHS. British Dental Association. [Online]. [Accessed 5 December 2023]. Available from: https://www.bda.org/media-centre/nearly-half-of-dentists-severing-ties-with-nhs-as- government-fails-to-move-forward-on-reform/
- Green, R., Fagg, J. and Hughes, D. 2023. Children waiting over a year in pain for NHS tooth removal. BBC News. [Online]. [Accessed 5 December 2023]. Available from: https://www.bbc.co.uk/news/health-66095984.
- Organisation for Economic Co-operation and Development. 2008. Handbook on Constructing composite Indicators: Methodology and user guide. Paris: OECD.
- NHS BSA. 2024. FOI 01702. NHS Business Services Authority.
- GP Patient Survey. 2023. [Online].[Accessed 6 February 2024] Available from: https://www.gp-patient.co.uk
- MHCLG 2019. English indices of deprivation 2019. GOV.UK. [Online]. [Accessed 29 February 2024]. Available from: https://www.gov.uk/government/statistics/english-indices- of-deprivation-2019.
- ONS. 2023. Car or van availability - Office for National Statistics. Office for National Statistics. [Online]. [Accessed 29 February 2024]. Available from: https://www.ons.gov.uk/ datasets/TS045/editions/2021/versions/4/filter-outputs/6e5d1869-6110-4a41-82fa- fa6e310e7d16#get-data.
- ONS. 2023. Number of Households - Office for National Statistics. Office for National Statistics. [Online]. [Accessed 29 February 2024]. Available from: https://www.ons.gov.uk/ datasets/TS041/editions/2021/versions/3#version-history.
- ONS. 2023. Sex - Office for National Statistics. Office for National Statistics. [Online]. [Accessed 29 February 2024]. Available from: https://www.ons.gov.uk/datasets/TS008/edi tions/2021/versions/4/filter-outputs/bbc4df24-3eef-42e3-af4a-1e0b9636a032#get-data.
- ONS. 2024. Local Authority Districts (December 2023) Boundaries UK BFC. Open Geography Portal. [Online]. [Accessed 29 February 2024]. Available from: https://geoportal.statistics.gov.uk/datasets/ons::local-authority-districts-december-2023-boundaries-uk-bfc-2/about.
Follow the Topic
-
British Dental Journal
This is an international, peer-reviewed journal for the dental community, published by Springer Nature on behalf of the British Dental Association.

Your space to connect: The Forensic dentistry Hub
A new Communities’ space to connect, collaborate, and explore research on Dentistry and Forensic Medicine!
Continue reading announcementRelated Collections
With Collections, you can get published faster and increase your visibility.
Periodontology
Publishing Model: Hybrid
Deadline: Jun 30, 2026


Please sign in or register for FREE
If you are a registered user on Research Communities by Springer Nature, please sign in