A semi-automated framework for global detection of previously undocumented submarine calderas
Published in Earth & Environment
A project born from frustration (and curiosity)
When I started working on submarine volcanism years ago, I kept running into the same, almost paradoxical realisation: most of Earth’s volcanoes lie underwater, yet we know so little about them. During long hours spent staring at bathymetric data, I often felt a strange mix of fascination and frustration. The global maps we rely on are still very low-resolution, smoothing out the very features we want to understand, while the high‑resolution ship‑based surveys, which reveal the true complexity of the seafloor, cover less than 30% of the oceans. It often felt like trying to study an entire volcanic world through a fogged window: you can sense the presence of simple conical edifices, complex ridges, and calderas, but the details remain mostly blurred or incomplete. That gap never stopped nagging at me. Among all these features, calderas were the ones I kept coming back to. They are capable of storing enormous volumes of magma and producing some of the most impactful eruptions on the planet, yet underwater they are mostly undocumented, unnamed, or simply unnoticed. This gap became impossible for me to ignore.
This work began as a simple question: How many submarine calderas are actually out there? The answer turned out to be far more complex and far more interesting than I expected.
From a conversation to a catalogue
The idea came out of a conversation with one of the co‑authors, Assoc. Professor Susanna Jenkins (Nanyang Technological University), my postdoctoral advisor at the time. We already had a global catalogue of active and inactive calderas, the Collapse Caldera Database (CCDB), but it only included a handful of underwater calderas, and we knew that this was nowhere near reality. The oceans hide most of Earth’s volcanism, yet existing catalogues captured only a fraction of what must be out there.
I soon realised that if I wanted a global inventory of submarine calderas, I would have to do something about it. The challenge was immediately obvious: how do you efficiently identify new calderas among the tens of thousands of seamounts scattered across the ocean floor, of which we only have their location and a blurred image? That was when I thought of involving Assist. Professor Christopher Lee (University of Toronto), who a few years earlier had developed an algorithm capable of automatically detecting meteorite impact craters on Mars with remarkable precision. After all, calderas are large‑scale morphometric depressions too, similar to impact craters, just superimposed on positive volcanic topography.
What began as a small side project quickly grew into a multi‑year and multidisciplinary effort, combining volcanology, geomorphometry, marine geology, machine learning, and a lot of patience.
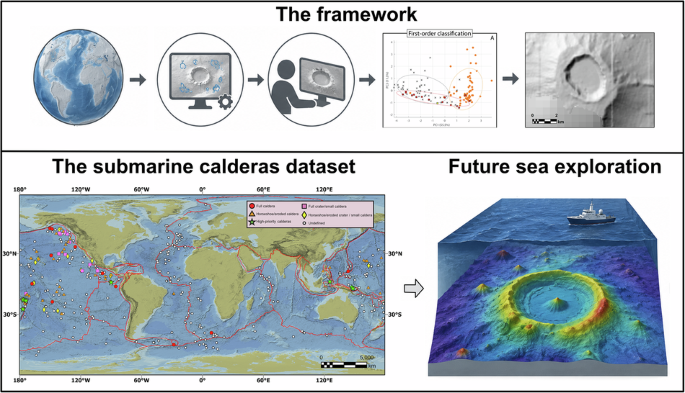
The framework and the challenge of mapping volcanoes you can’t see
The ocean floor is an awkward place to do science: patchy data and inconsistent resolutions, deriving from highly variable survey qualities. Some regions benefit from exquisite multibeam coverage, while others rely entirely on coarse global grids. One of the biggest challenges was designing a workflow that could treat all these datasets fairly, without over‑interpreting or under‑interpreting features.
This led to the development of what became the automated core of our workflow: the Caldera Detection Algorithm (CDA). The CDA was a modified version of the algorithm developed by Assist. Professor Christopher Lee (University of Toronto), adapted to scan low-resolution global bathymetric datasets and flag potential caldera‑like depressions in a consistent, reproducible way. In particular, working on the CDA forced me to think about calderas in a more quantitative way - what measurable criteria define a caldera? How do we separate true collapse structures from other caldera‑like depressions? The CDA helped shortlist promising candidates through a series of morphometric parameters, but the broader framework also draws strength from expert judgement. The automated detection had to be complemented by extensive manual verification, geological interpretation, and classification, because many features simply cannot be reliably distinguished by an algorithm alone.
There were many moments of doubt. Some structures were borderline cases; others looked more convincing, and others simply did not exist. I spent weeks revisiting interpretations and checking consistency. Eventually, I decided to run statistical analyses on the classified features to see whether any natural clusters emerged, and to my relief, they did. The statistical patterns aligned with our classification, confirming that the framework was robust.
Slowly, a global picture began to emerge.
The submarine caldera dataset
When the first global map of our classified features appeared on my screen, I was surprised. The number of submarine calderas, though conservative, was far higher than expected, more than doubling what had been reported in existing global catalogues at the time. That was the moment I realised the project had grown into something much bigger than a catalogue. It had become a new way of looking at submarine volcanism at a planetary scale.
But very quickly I realised something important: this was not a “final number”, and it could never be one. The oceans are too vast, the data too uneven, and our understanding too incomplete for any catalogue to be definitive.
But that is the nature of research. Knowledge evolves, datasets improve, and interpretations shift as new information becomes available. What this project provides is not a finished list, but a foundation, a reproducible framework that future researchers can refine, expand, and build upon. One day we will have a more complete inventory of submarine calderas (though probably still not a definitive one), and it will also be thanks to this initial effort.
With this work we did not just want to add a number to the existing catalogues, but to suggest where future seafloor exploration should focus next.
Looking forward
This project didn't happen in a vacuum - it was shaped by conversations and collaborations across disciplines, institutions, and countries. Discussions with colleagues during conferences often led to new insights. Fieldwork on research vessels reminded me how much effort goes into acquiring the bathymetry that makes studies like this possible.
This paper is only a starting point. I hope it encourages more systematic mapping, more streamlined access to research vessels, and ultimately more curiosity about the volcanic systems hidden beneath the sea. There is still a vast amount to discover, and I can't wait to see how this inventory evolves as new data become available.
Working on this project has been challenging, humbling, and deeply rewarding. I’m grateful to everyone who contributed insights, expertise, or simply encouragement along the way. And it feels good to finally put this out into the world.
Follow the Topic
-
Communications Earth & Environment
An open access journal from Nature Portfolio that publishes high-quality research, reviews and commentary in the Earth, environmental and planetary sciences.

Related Collections
With Collections, you can get published faster and increase your visibility.
Remote sensing and forests
Publishing Model: Hybrid
Deadline: Jul 31, 2026
Sustainable agricultural practices
Publishing Model: Open Access
Deadline: Jul 24, 2026
Please sign in or register for FREE
If you are a registered user on Research Communities by Springer Nature, please sign in