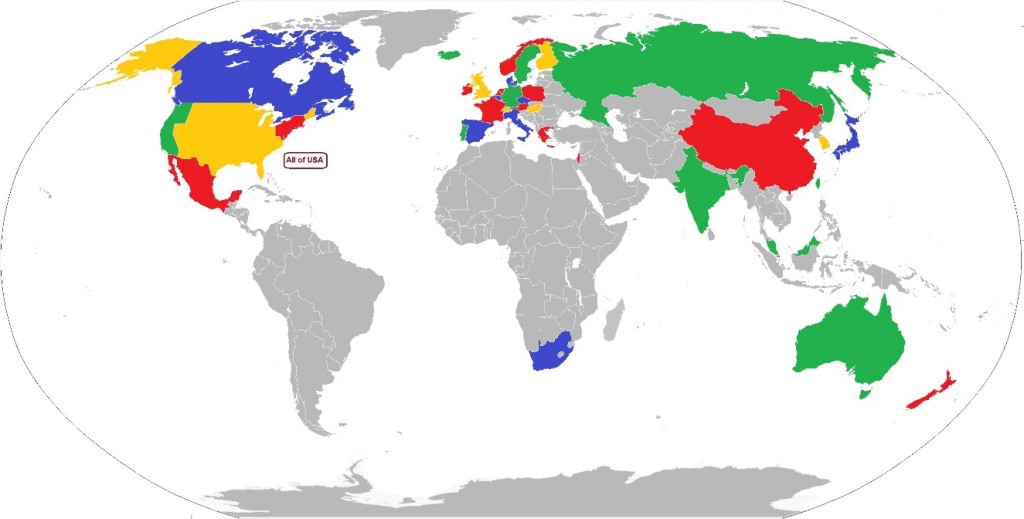
 Where are venture funds being deployed in biotech? Is this changing? As part of a programme to find out how VC interacts with biotech, I have created a database of venture investment in 33 countries and three regions of the USA, over the time periods before, during and after the financial crisis of 2008-11, and built this into an interactive map of the biotech VC world. The map is clickable, with data for each country linked to that country on the map. The link to the map is here.
A quick summary shows:
- USA dominates investment in biotech.
- East and West Coast investors have different behaviour and different investment priorities than others.
- UK, Israel and non-Coastal US investors are similar
- Looking to the Coastal US for examples of ‘how to do it’ guides for policy may not work.
- Companies with bold ambitions should look to where investors match their vision, not to local sources.
Globally, the USA continues to dominate investment in biotechnology – around 2/3 of all investments by value and number are from investors in the USA and into US companies.
Because of the US dominance, many European governments and a not insignificant number of entrepreneurs look to the USA for leadership, inspiration and, of course, funds. But is the USA a good model for other countries?
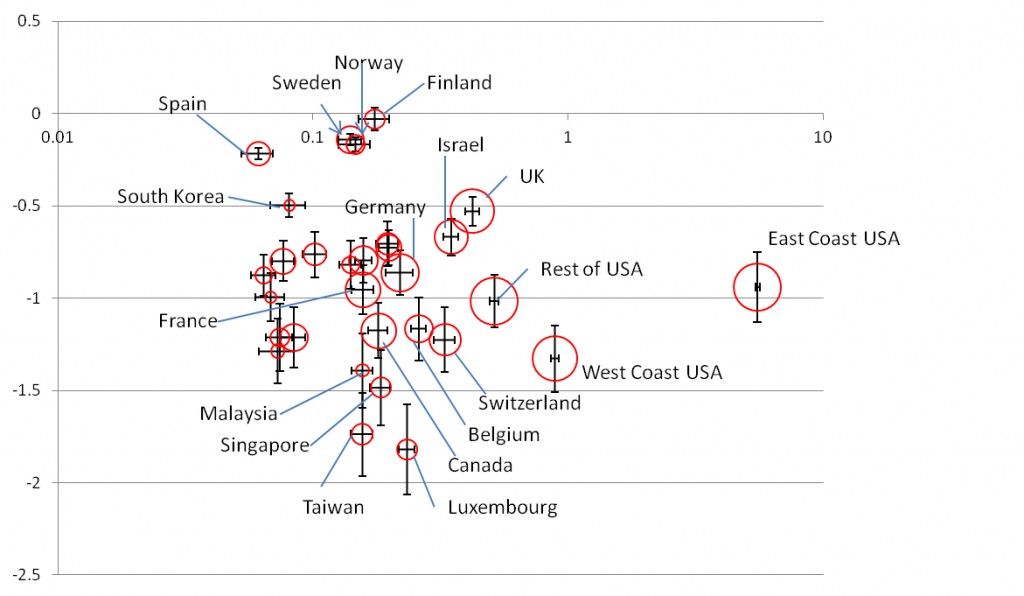
We compiled the characteristics of investors that are related to their investment behaviour and mapped this across different territories. These were averaged for the investors in different territories, and corrected for GDP so that Croatia can be meaningfully compared to California (Figure 1. Click to enlarge).
Figure 1. Analysis of bio-investor behaviour in 32 territories. We examined 22 characteristics of how investors invest – average amounts, ages of companies, round preference, type of investor etc. – and aggregated them using Principal Components Analysis into a 2-dimensional descriptor of investor behaviour. The nearer two investors are on the chart, the more similar they are in aggregate. Circle width is proportional to the log of the number of investors in the territory. Error bars are 1 standard deviation on the Principal Components.
The results show two things very clearly. Firstly, the “USA” is not one place. Investors in the Boston/New York cluster are global outliers, different from any other territory. The West Coast, while it makes more biotech investments than the Boston cluster, behaves more like the rest of the world in characteristics such as average amount invested, preference for later-stage deals rather than early deals that Massachusetts prefers, and other characteristics. Nevertheless, the ‘Rest of USA’ group is not the same as any other country. Investors in the UK have preferences for deal stage, size, company maturity etc. more like the ‘Rest of USA’ than East or West Coasts, and is quite similar to Israel – together we might call UK, Israel and the Rest of USA group the “Wannabe-Boston” cluster. The rest of the world forms diverse clumps of countries, reflecting a range of national agendas, cultures and economies.
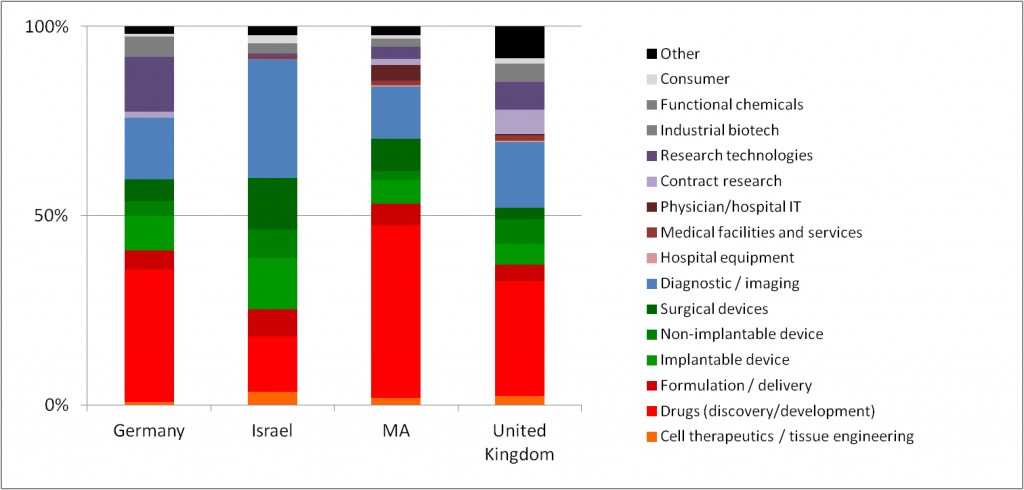
What do investors in these regions invest in? We analysed the investee companies in Massachusetts, UK, Israel and Germany. The types of companies they invest in differ substantially (Figure 2. Click to enlarge).
Figure 2. Investment by type of company.
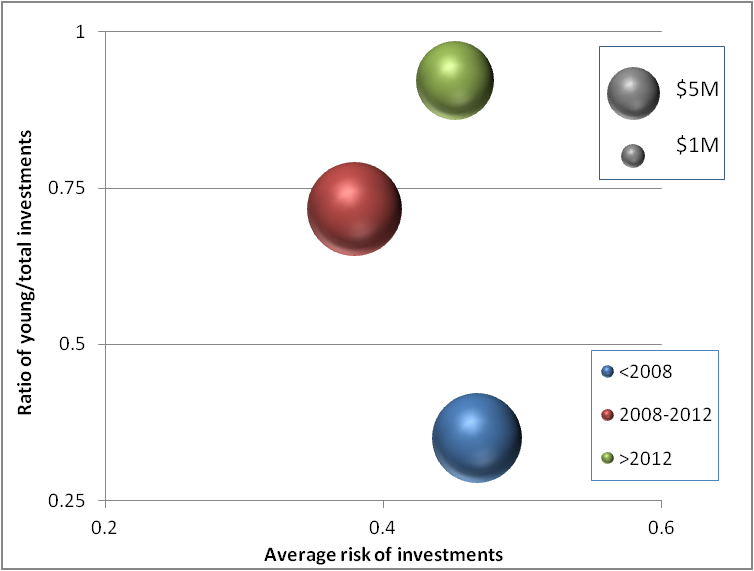
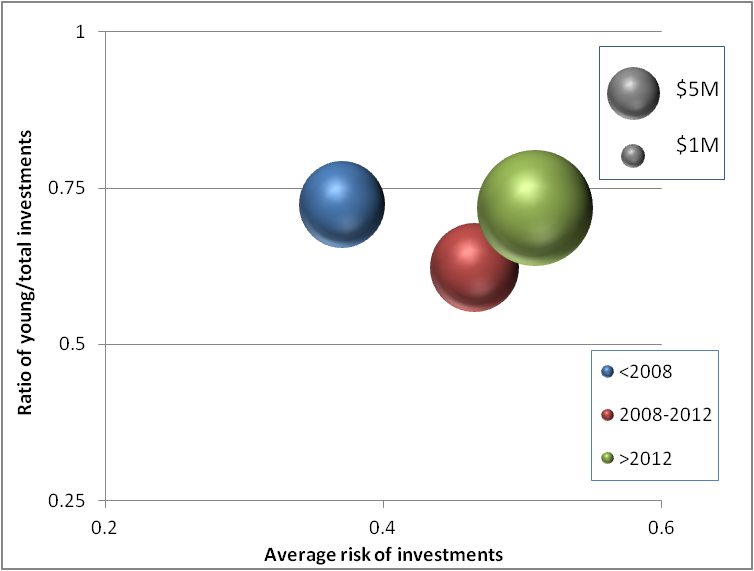
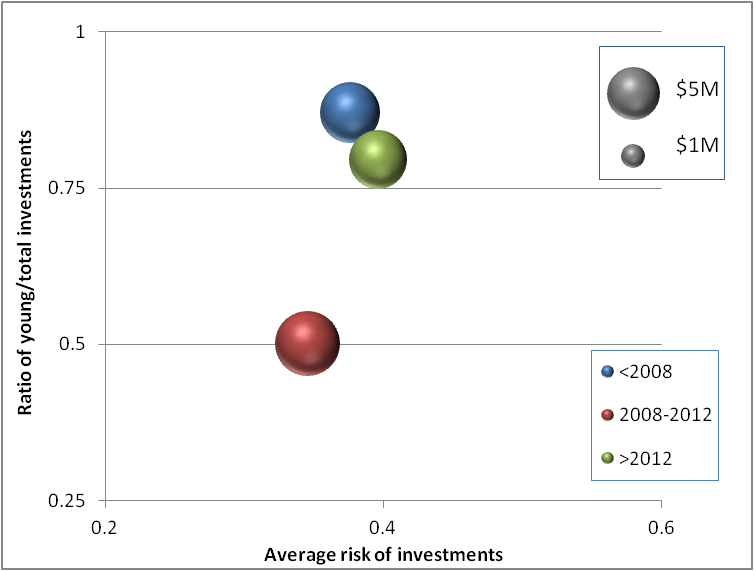
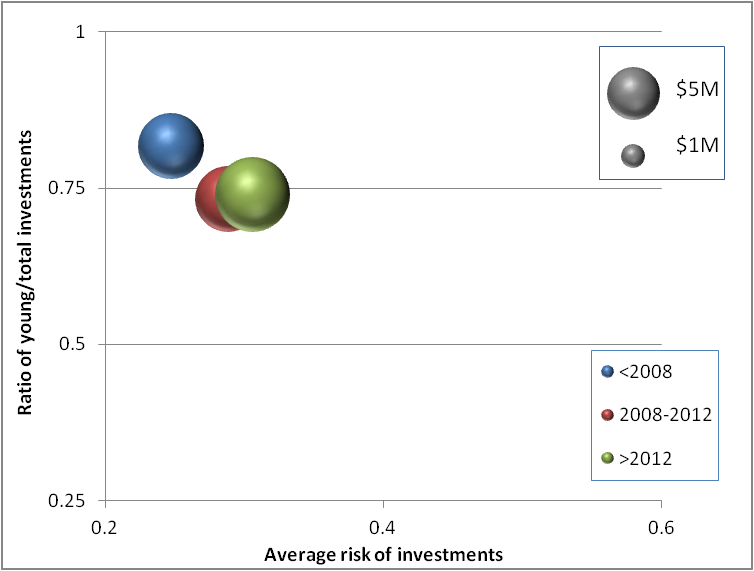
And the nature of the investment also differs, and in some territories has changed substantially over the last decade (Figures 3-6. Click to enlarge).
Figure 3 (Germany). Over the recent global financial crisis, Germany has moved to investing in much younger companies.
Figure 4 (Massachusetts). Massachusetts moved to investing in riskier companies and putting more money to work in them.
Figure 5 (UK). UK moved to investing in much older companies but then moved back, and has shown a tendency for lower amounts invested. It also seems to have resumed putting smaller amounts of cash to work in young, high-risk projects, which will almost certainly require substantial capital, and hence repeated financing rounds, a strategy we have heard called “prostate financing” (long periods of effort and pain for a dribbled result).
Figure 6 (Israel). Israel did not change its investment strategy much over this time period, though it also has a tendency for lower amounts invested and less-risky propositions, where smaller amounts might be needed to take projects to exit or profitability.
Overall, this shows that different territories have different investor profiles and different investment patterns in biotechnology, from the point of view of amount invested, the businesses invested in, the stage of companies invested in, and risk appetite. This might seem an extraordinarily obvious conclusion, but is important for two reasons.
Firstly, economic policy, and particularly tax and grant support policy, tends to follow obvious success stories from the highest profile regions in the world – this often means Massachusetts, Research Triangle Park or San Diego. These may not be relevant. For example, the UK’s EIS and SEIS programmes were meant to remove financial risk from pre-VC, and specifically angel investing, and so encourage support of young, high-risk companies. EIS was introduced in 1994, and SEIS in 2012. Despite these schemes, UK pre-VC and angel investing in biotechnology shows less risk appetite than that in Massachusetts, where no such incentives exist, and a declining risk appetite in biotech at least since SEIS was introduced. Trying to drive investment into UK start-up companies against the inclination of the local investment community appears to be hard, maybe impossible.
Secondly, for the entrepreneur, finding money to match a business plan has to be global. A niche reagent business may have a much better chance of funding in Bavaria than in Boston, a gene or cell therapy start-up has more chance in Waltham than in Westminster. The entrepreneur therefore has a choice: change the location (and by implication the investor preferences) or change the plan. This is not an absolute. While Biovex (Woburn, MA) moved from its foundation in London, UK to the Boston area to pursue funds, Oxford Nanopore (Oxford, UK) sought investors globally from the start, and got substantial funding from the Far East, and not from conventional venture capital at all. So the choice is not always between being starved in Europe or emigrating to the USA.
Please sign in or register for FREE
If you are a registered user on Research Communities by Springer Nature, please sign in