Integrated Machine-Learning and Clustering Framework for Flood Emergency Shelter Selection
Published in Social Sciences, Earth & Environment, and General & Internal Medicine

Flood maps can tell us where risk is high. But during an emergency, that is only part of the question. The next—and more practical—question is: where should people go?
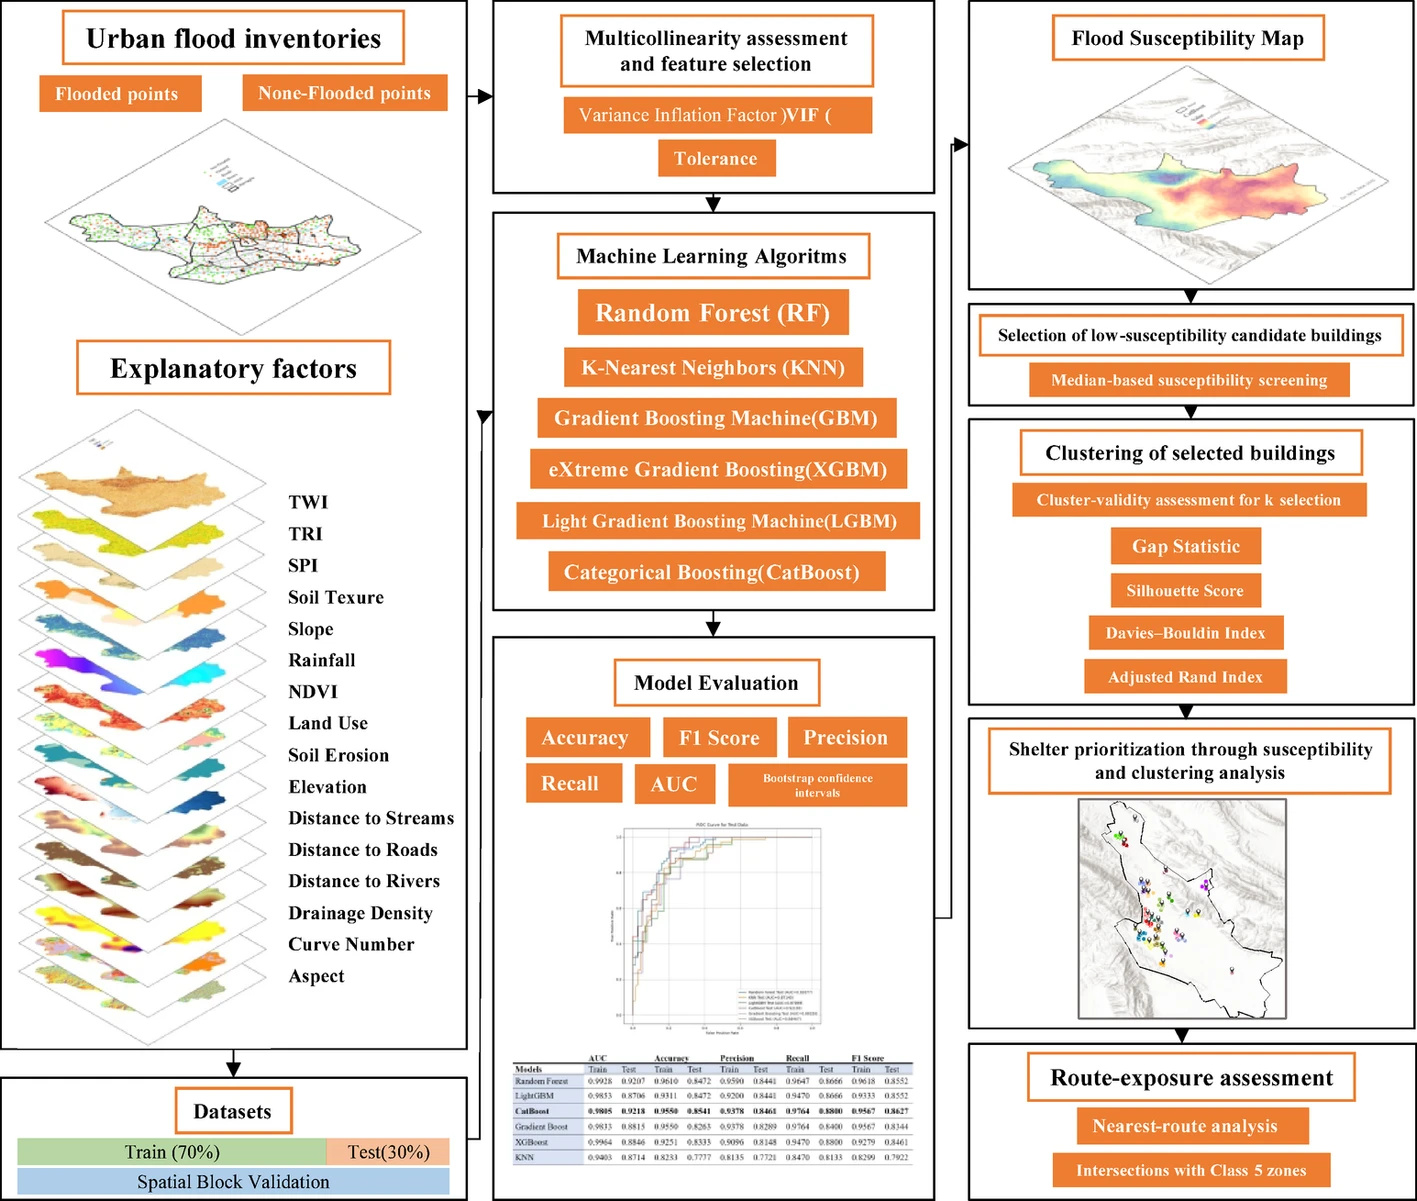
That question became the starting point of our recent paper in Natural Hazards, “Integrated machine-learning and clustering framework for selecting temporary shelters in flood-prone cities.” Rather than stopping at flood-susceptibility mapping, we wanted to translate a predictive map into a decision-support workflow that could help prioritize temporary emergency shelters at the building scale.
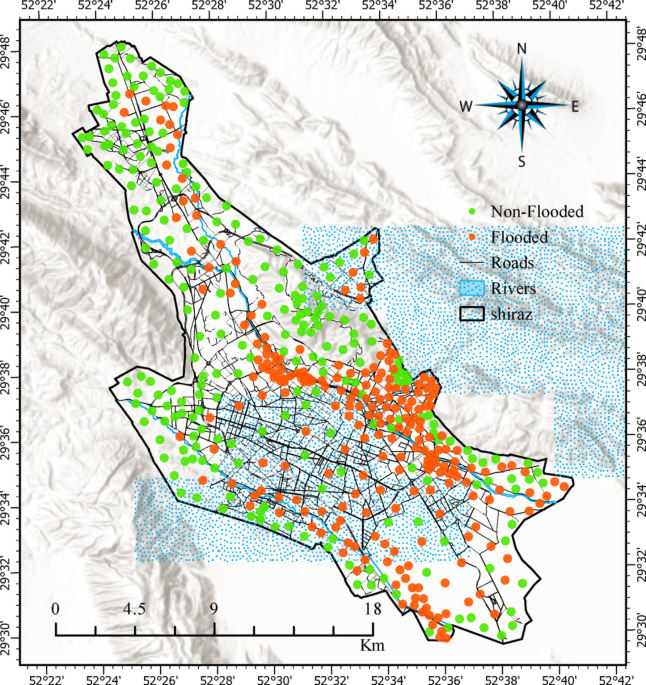
The study focused on Shiraz, a major city in southern Iran with a history of damaging flash floods. We began by building a flood inventory using 220 recorded flood-affected locations from 2000–2020 and an equal number of non-flooded points. Sixteen explanatory variables were then assembled to represent four dimensions of urban flood susceptibility: climate, geography, urban development, and infrastructure. These included rainfall, elevation, slope, topographic wetness, NDVI, land use, soil characteristics, distance to rivers and roads, drainage density, and other terrain- and hydrology-related factors.
One of the first methodological challenges was deciding how to compare different machine-learning approaches fairly. We tested six algorithms—Random Forest, KNN, GBM, XGBoost, LightGBM, and CatBoost—using the same predictor set, data split, and evaluation criteria. Hyperparameters were tuned only on the training data using stratified five-fold cross-validation, while an independent 30% test set was reserved for final evaluation.
Because spatial data can create overly optimistic results when nearby points appear in both training and testing sets, we also carried out a spatial block validation experiment. This was important for us: a model can perform very well numerically and still fail to generalize spatially. CatBoost remained the strongest overall model, achieving a test AUC of 0.9218 and an F1-score of 0.8627. Under spatial-block validation, it also retained the highest AUC and F1-score among the tested models.
But the most important step came after the flood-susceptibility map was produced.
A susceptibility map alone does not tell emergency managers which buildings should be used as shelters. To bridge that gap, we transferred the modeled susceptibility values to individual public buildings using zonal statistics. We initially identified 426 potential facilities, including schools, sports complexes, and other public-use buildings. Eighty-five facilities located within officially mapped deteriorated urban fabrics were excluded, leaving 341 eligible candidates.
We then used the building-level flood-susceptibility scores to retain the relatively safer half of the candidates. This median-based screening reduced the pool to 145 buildings. These buildings were also cross-checked using municipal information and field visits, focusing on current use, building condition, access, open space, basic utilities, and obvious signs of deterioration.
At this stage, another practical problem appeared: selecting only the safest buildings could still produce a highly uneven shelter network. Several low-risk buildings might be concentrated in one part of the city while other areas remain poorly served. This is why we introduced K-Means clustering—not as a safety-validation tool, but as a spatial-allocation mechanism.
We evaluated alternative numbers of clusters using the Gap Statistic, Silhouette Score, and Davies–Bouldin Index, together with clustering stability and operational interpretability. The final solution used 28 clusters. At k = 28, the Silhouette Score was 0.5991, the Davies–Bouldin Index was 0.4578, and repeated K-Means runs produced a mean adjusted Rand index of 0.8938, indicating high stability. One building nearest to the geometric centroid of each cluster was then selected, producing a final network of 28 candidate shelters.
The screening process also reduced the flood-susceptibility profile of the selected facilities. The median building-level susceptibility score decreased from 0.573 in the initial eligible pool to 0.432 in the final shelter set, while the mean decreased from 0.549 to 0.399.
One of the most useful lessons from the study came from accessibility analysis. A shelter may be located in a relatively safe place, but the road leading to it may still cross a very high flood-susceptibility zone. We therefore added a route-exposure assessment and identified route segments intersecting the highest susceptibility class. This highlighted an important point: shelter suitability should not be evaluated only at the destination. The safety of the access corridor also matters.
There were also limitations that shaped the study. Shiraz did not have a formal historical flood-shelter network or evacuation-performance database that could be used for direct operational validation. In addition, detailed real-time traffic, dynamic population demand, socioeconomic vulnerability, and full capacity-demand allocation data were not available. For that reason, we present the framework as a preliminary decision-support tool rather than a final operational evacuation plan.
For me, this paper is also personally meaningful as my first research article. The journey from initial submission to acceptance took almost a year, and the process reinforced something that became central to the study itself: useful hazard research should not stop at prediction. The real challenge is translating models into decisions that can be interpreted, tested, and improved in real urban contexts.
I would be very interested to hear how others working in disaster risk reduction, GeoAI, emergency planning, or urban resilience approach this translation from hazard maps to operational decisions.
What additional variables or validation strategies would you consider essential before a shelter-prioritization framework could be used in practice?

Follow the Topic
-
Natural Hazards
This is devoted to original research work on all aspects of natural hazards, including the forecasting of catastrophic events, risk management, and the nature of precursors of natural and technological hazards.






Please sign in or register for FREE
If you are a registered user on Research Communities by Springer Nature, please sign in