New Collectivism Index Offers Dataset for Exploring Regional Differences and Change Over Time
Published in Social Sciences and Behavioural Sciences & Psychology
Collectivism is probably the most-studied dimension of culture. The early pioneer of cultural research Geert Hofstede concluded that collectivism can explain more variation across cultures than any of his other dimensions. A new study in Scientific Data offers a comprehensive collectivism index for regions in China across geography and time.
 The Difficulty of Measuring Culture
Perhaps the simplest way to measure psychological differences across culture is to give people surveys. That was the approach behind Hofstede's original cultural dimensions, and it inspired over 100 studies comparing individualism and collectivism across cultures, by one early count.
But culture is notoriously difficult to measure. Challenges like translation, abstract language that is difficult to make equivalent, and differences in how people's style of responding to questions are just a few of the challenges.
Those challenges could explain why collectivism surveys have revealed puzzling results. Three meta-analyses concluded that these scales reveal no average difference in cultures like China, Korea, and Japan compared to the US and Canada. Another found that the US scores more collectivistic than Japan.
These results are puzzling because they contradict the strong consensus among historians, political scientists, and anthropologists that Western cultures like the US are more individualistic than cultures in East Asia. When researchers have surveyed experts and graduate students studying these cultures, the results show broad agreement in these expectations.
Measuring Behavior
My research team tried to get around this limitation by looking at people's behavior. Behavior avoids problems like translation and response styles in surveys.
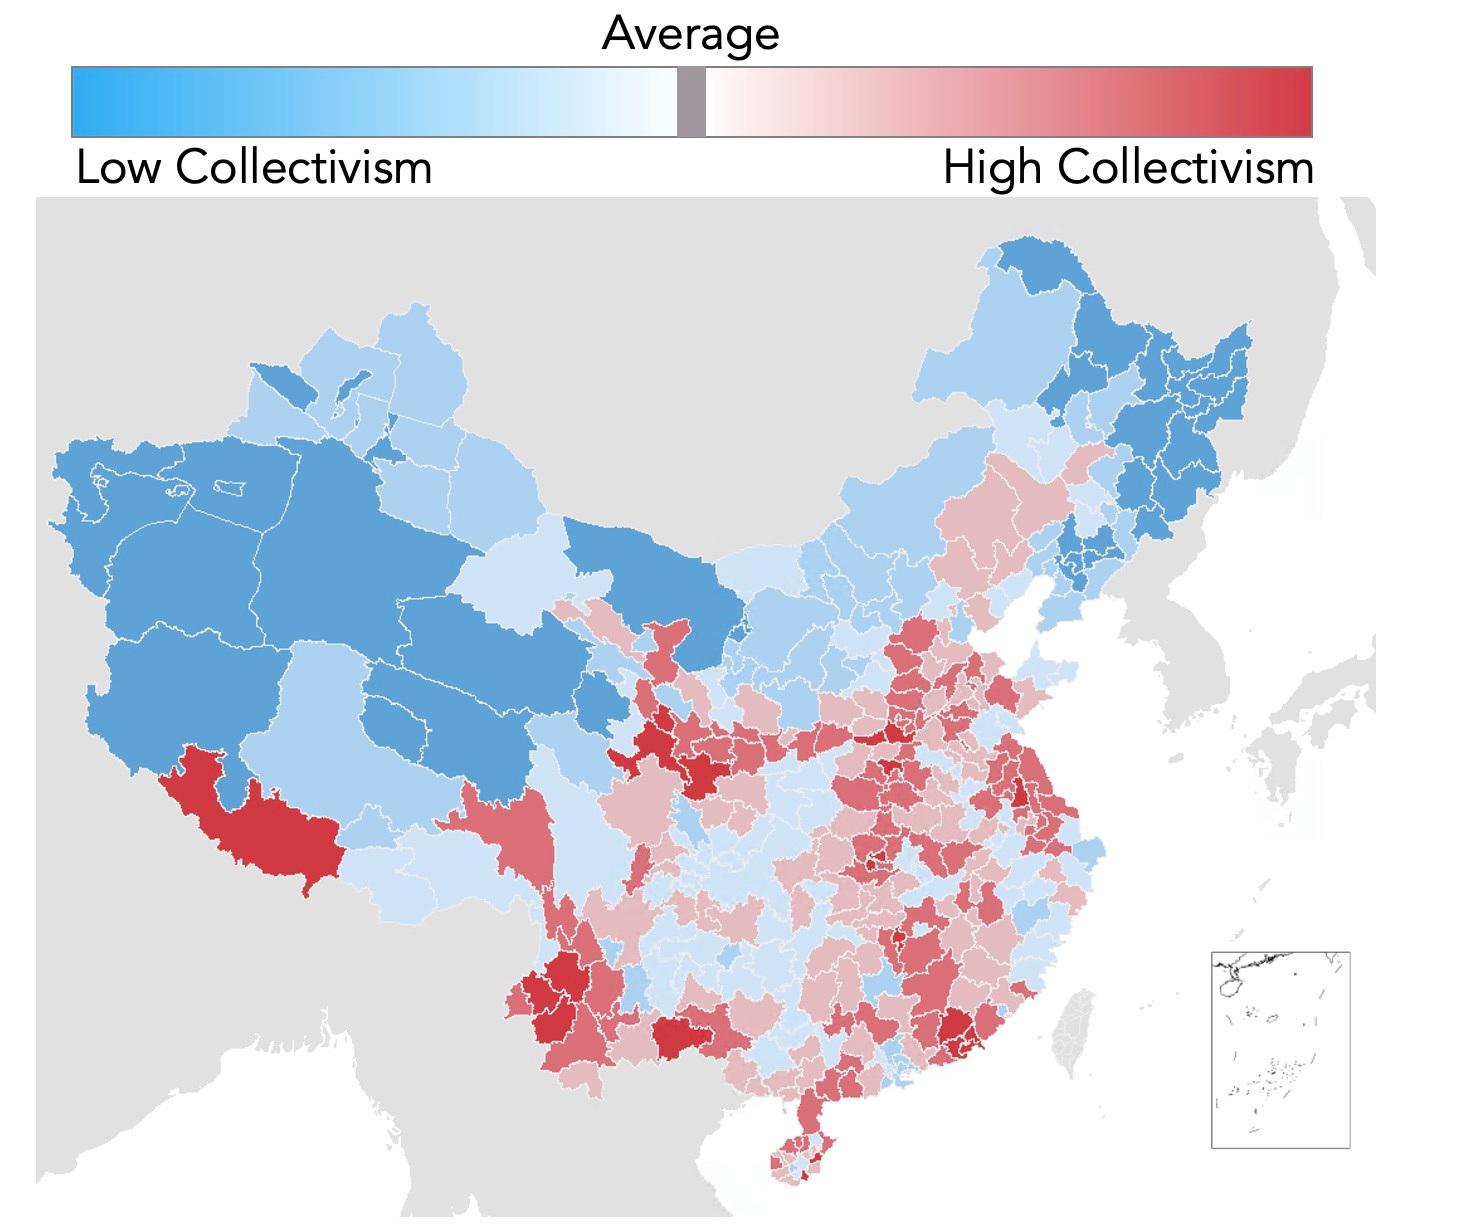
We used Census data to estimate cultural differences. We built on earlier studies that have used Census statistics to estimate collectivism in the US, in Japan, and around the world. Building on those studies, we used data on four indicators, like divorce rates and the percentage of people living alone.
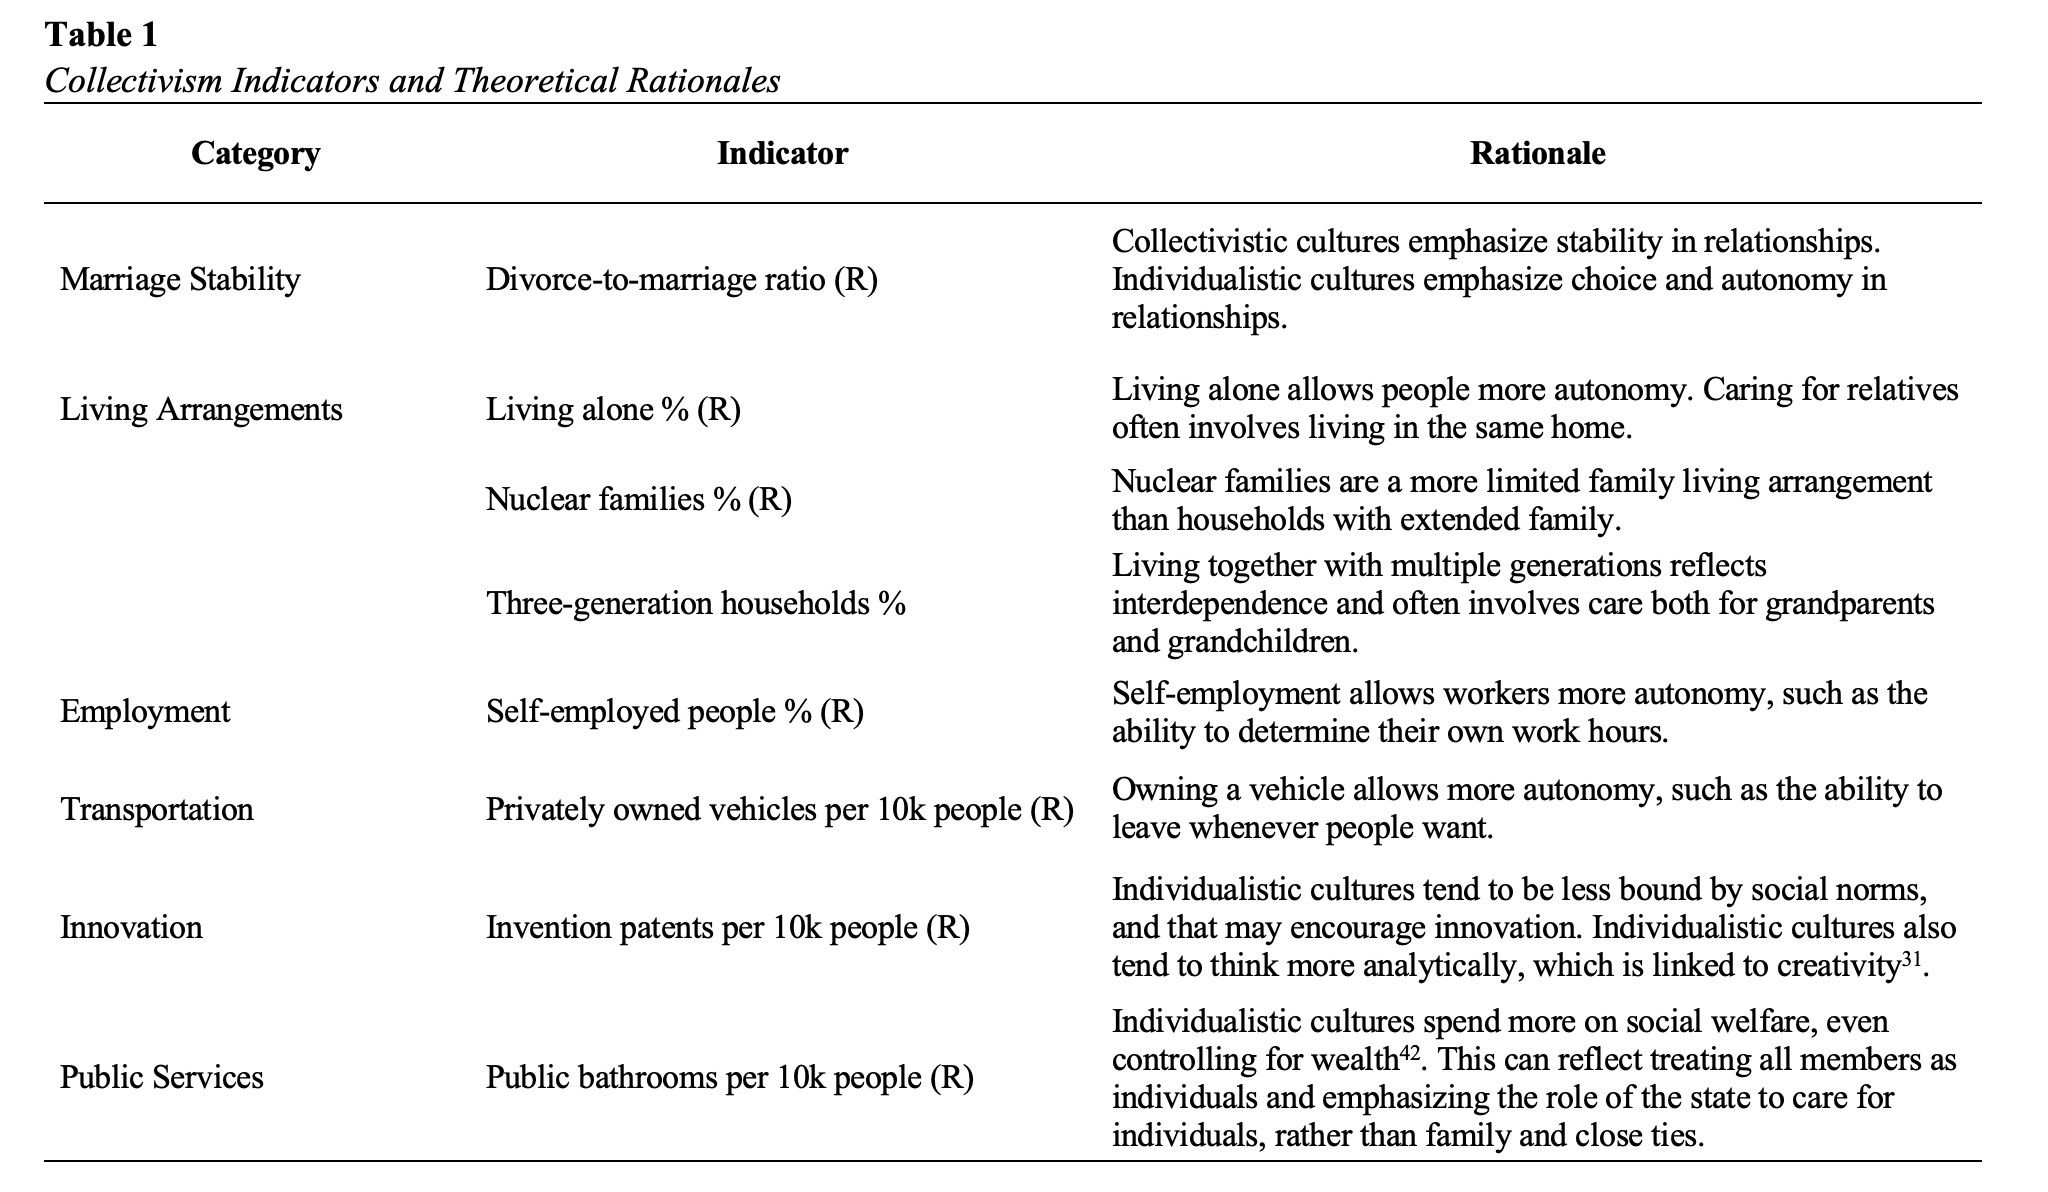
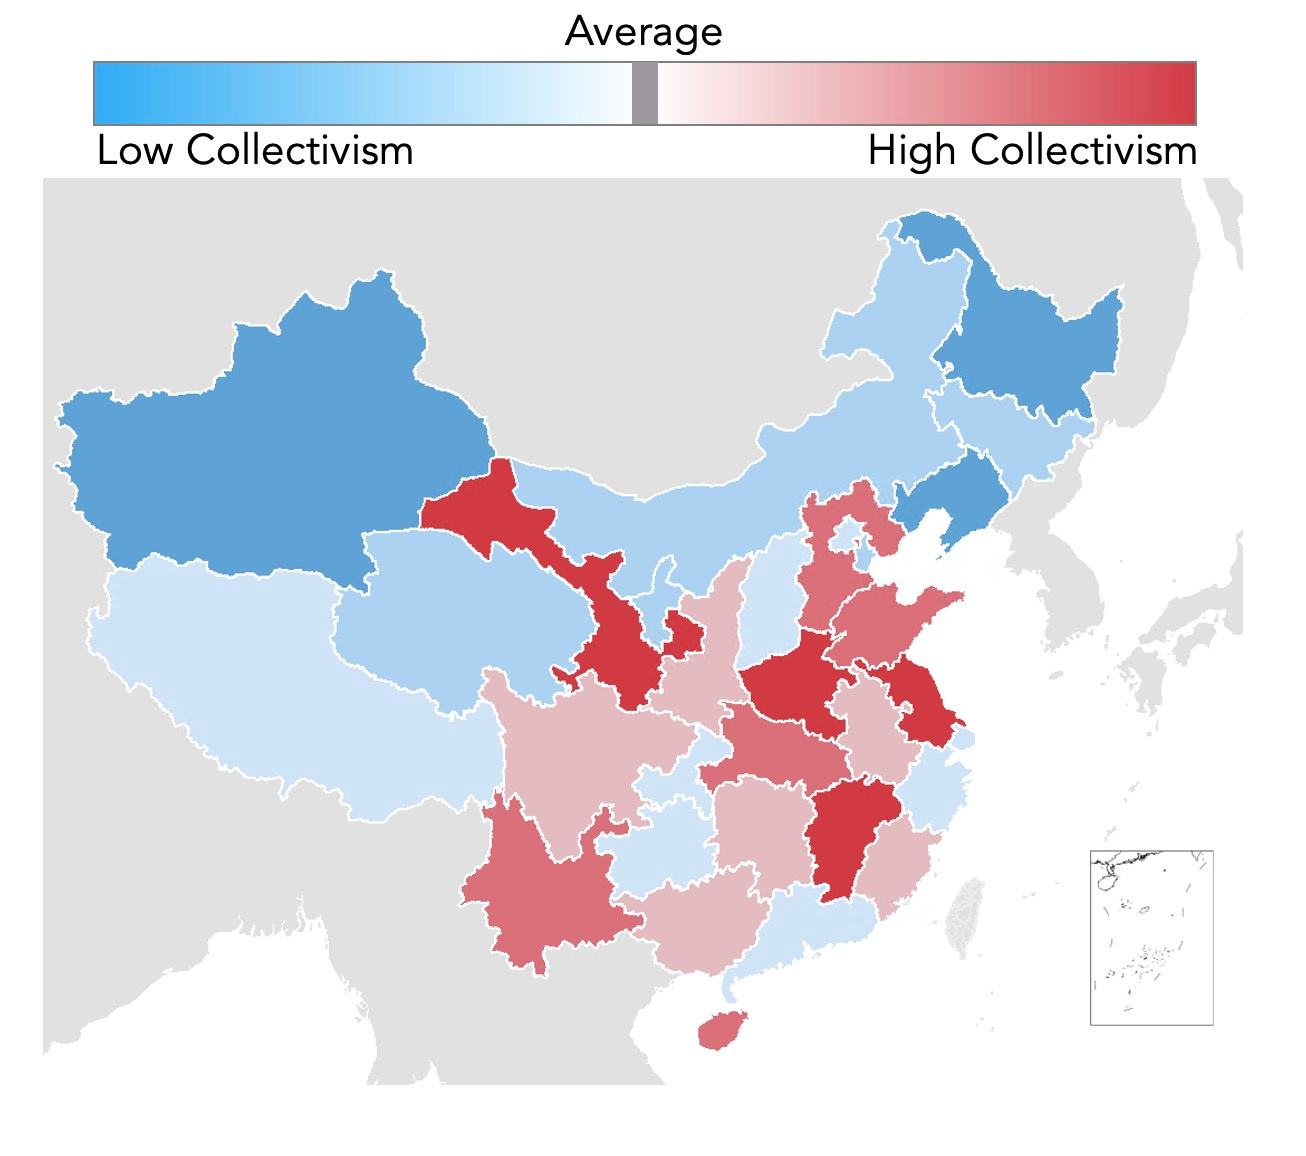
This allowed us to estimate collectivism across 356 prefectures, which are similar to US counties.

The index also offers data for China's 31 provinces.
Rewind and Fast Forward
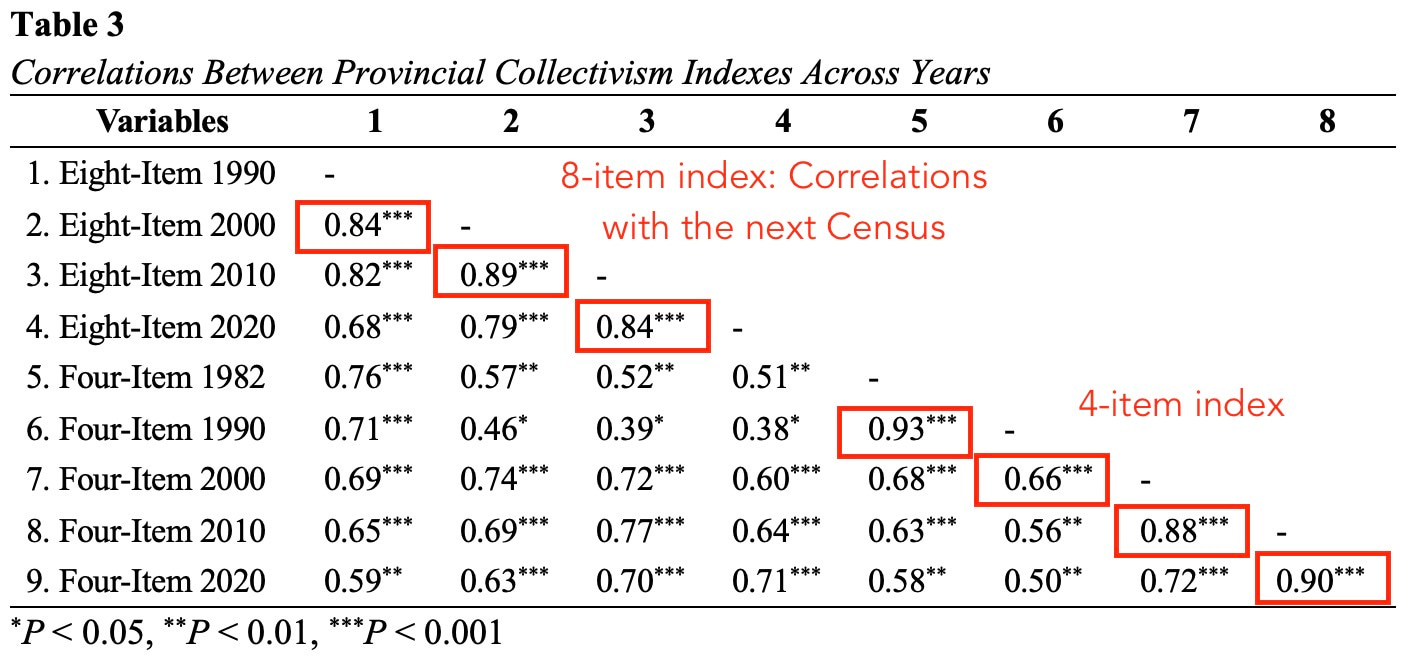
Because it uses Census data, the index is longitudinal. In other words, researchers can rewind and fast forward to see how regional differences have changed over time.
On the one hand, the regional differences are correlated over time. In other words, the differences are somewhat stable. On the other hand, those correlations are far from perfect (rs = .66-.93), which suggests that the differences are changing over time.
Is It Valid?
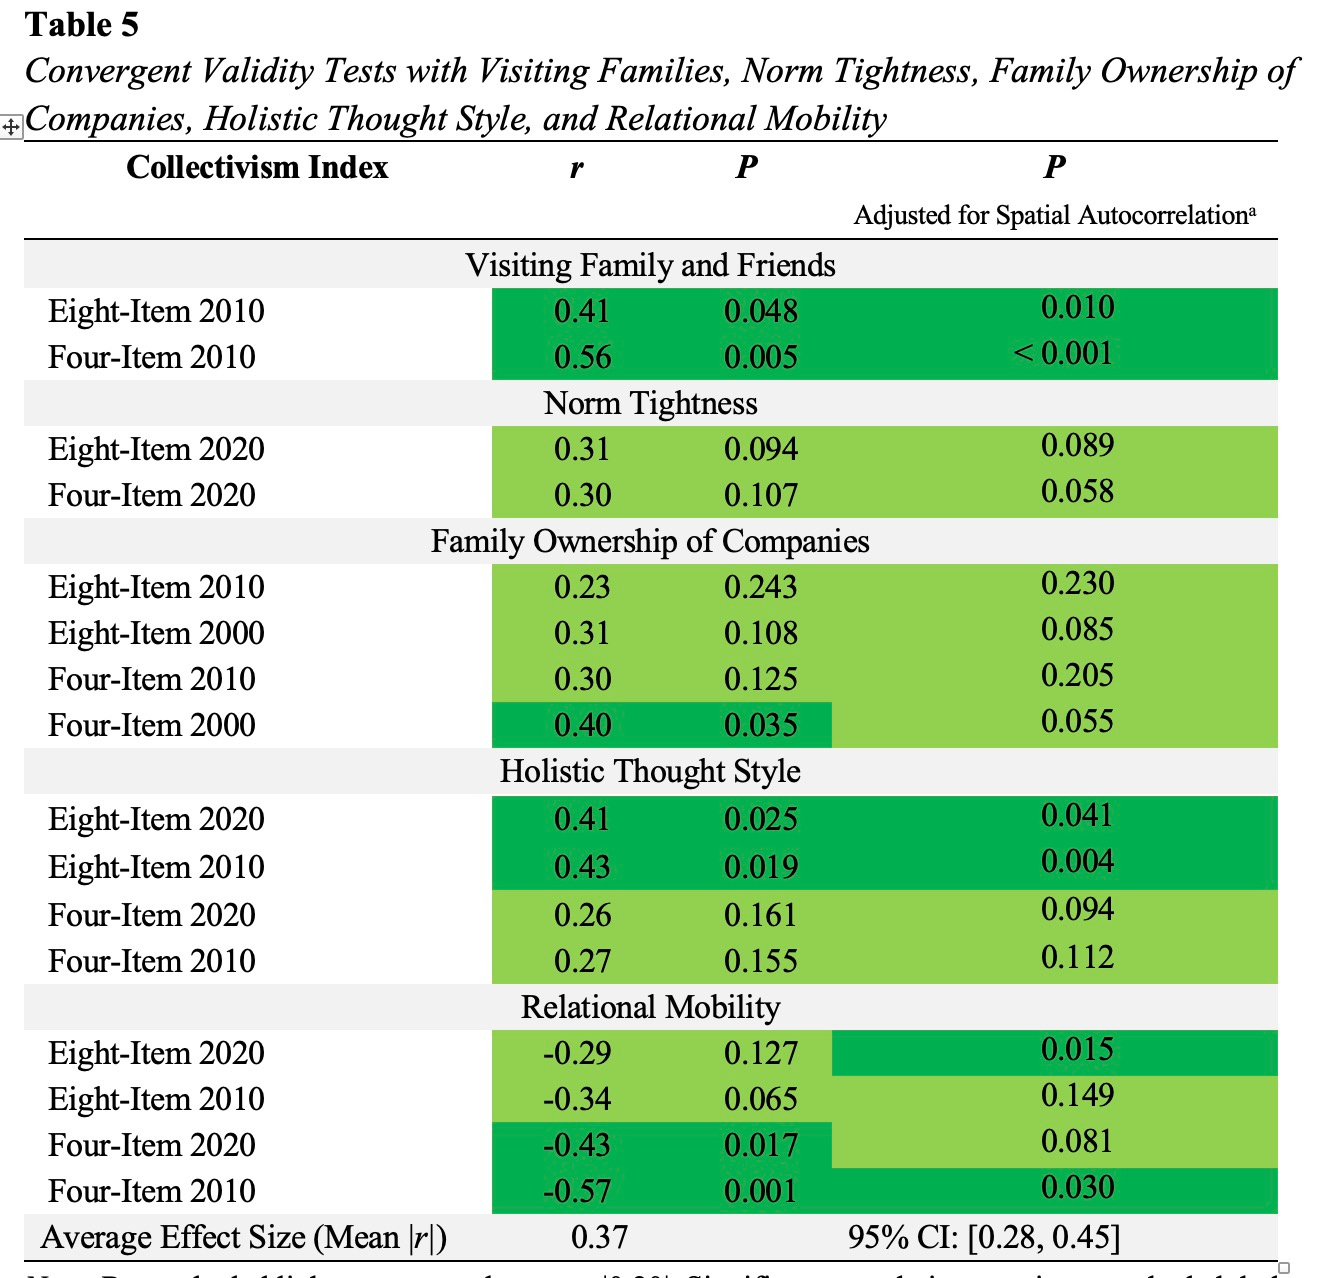
One obvious question is whether any of this is valid. People can create metrics and slap a name on them, but do this actually measure collectivism?
One way to test the validity is to compared the new index to other metrics that are plausibly connected to collectivism. We tested this in correlations between the new index and measures like how often people visiting family for Chinese New Year and how many companies are family owned across China.
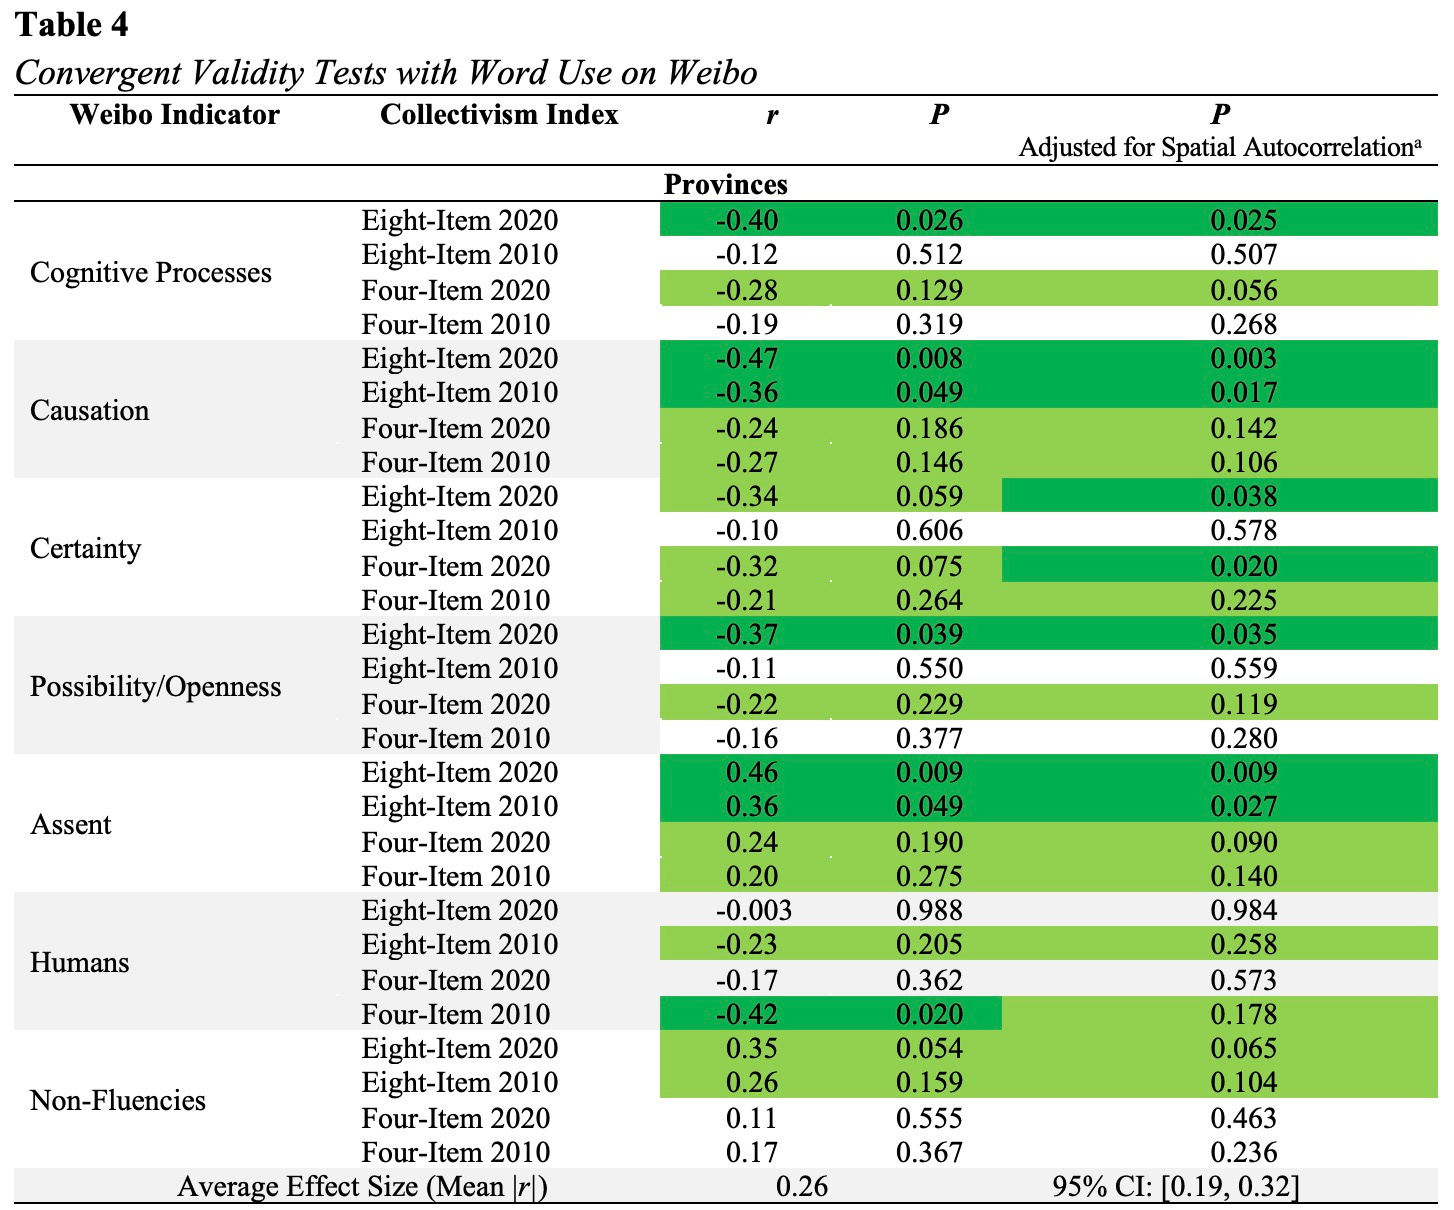
Another way to test validity is to compare the collectivism index to the words people use on Weibo (China's Twitter/X). That data comes from a recent study I did with researchers at the University of Pennsylvania. In that study, we validated word categories that tap into agreement, social words, and analytic thought styles (which tend to be more common in individualistic cultures).
One logical question to ask is whether this index is just measuring economic development. After all, people need money to live on their own and get divorced.
The results showed that collectivism is correlated with GDP per capita, but not as strongly as people might think. In the latest province data, the correlation is weak and non-significant (r = .04).
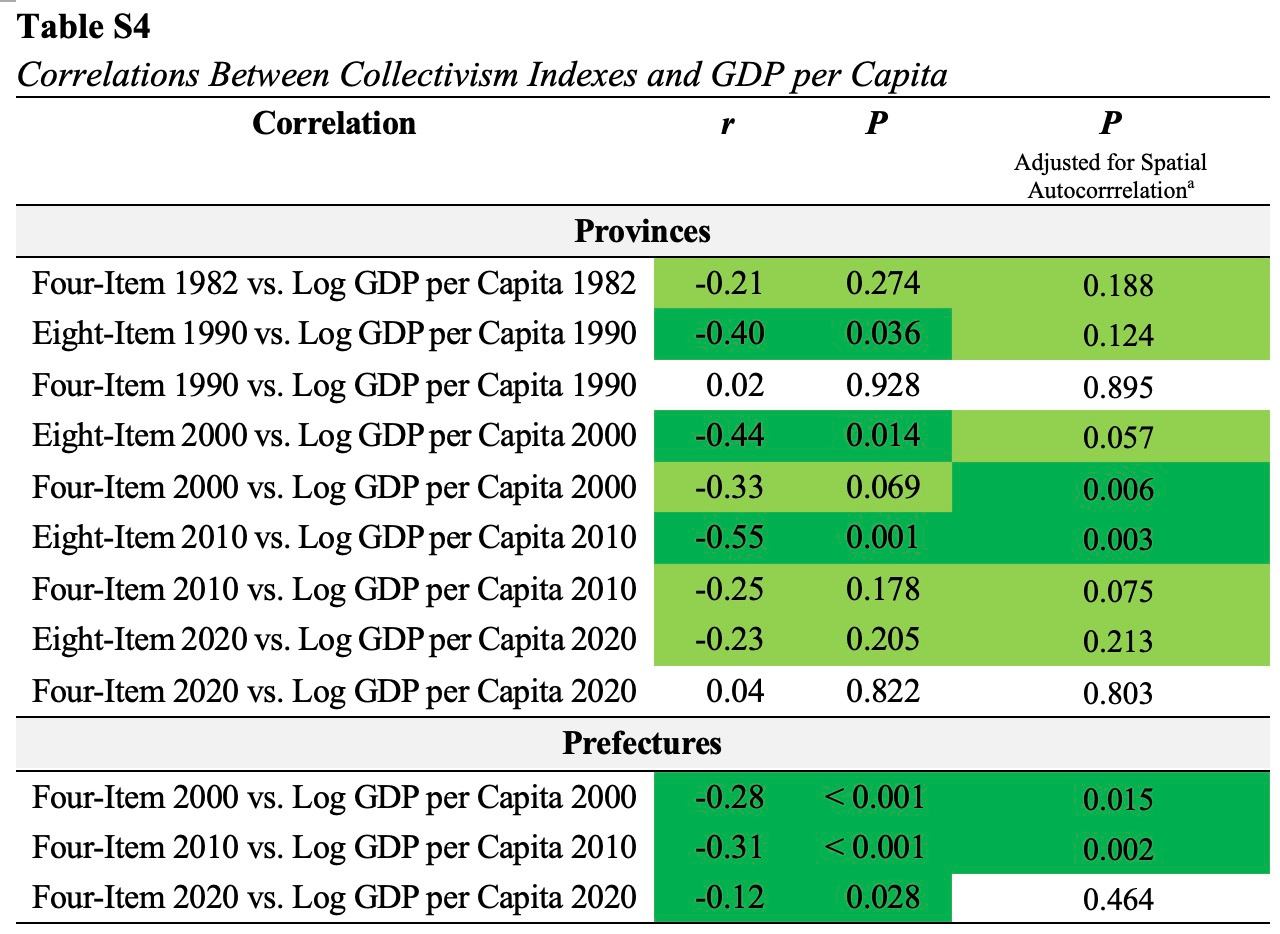
In short, collectivism is related to economic development, but there is far more to the story. The largest correlation showed an overlap of 30% between GDP and collectivism. That leaves plenty of room for other factors to influence regional culture.
A Resource for Researchers
This new data allows researchers to test theories of why cultures differ from each. Here's a taste of the types of analyses you can do with this data. Why are some places more collectivistic than others?
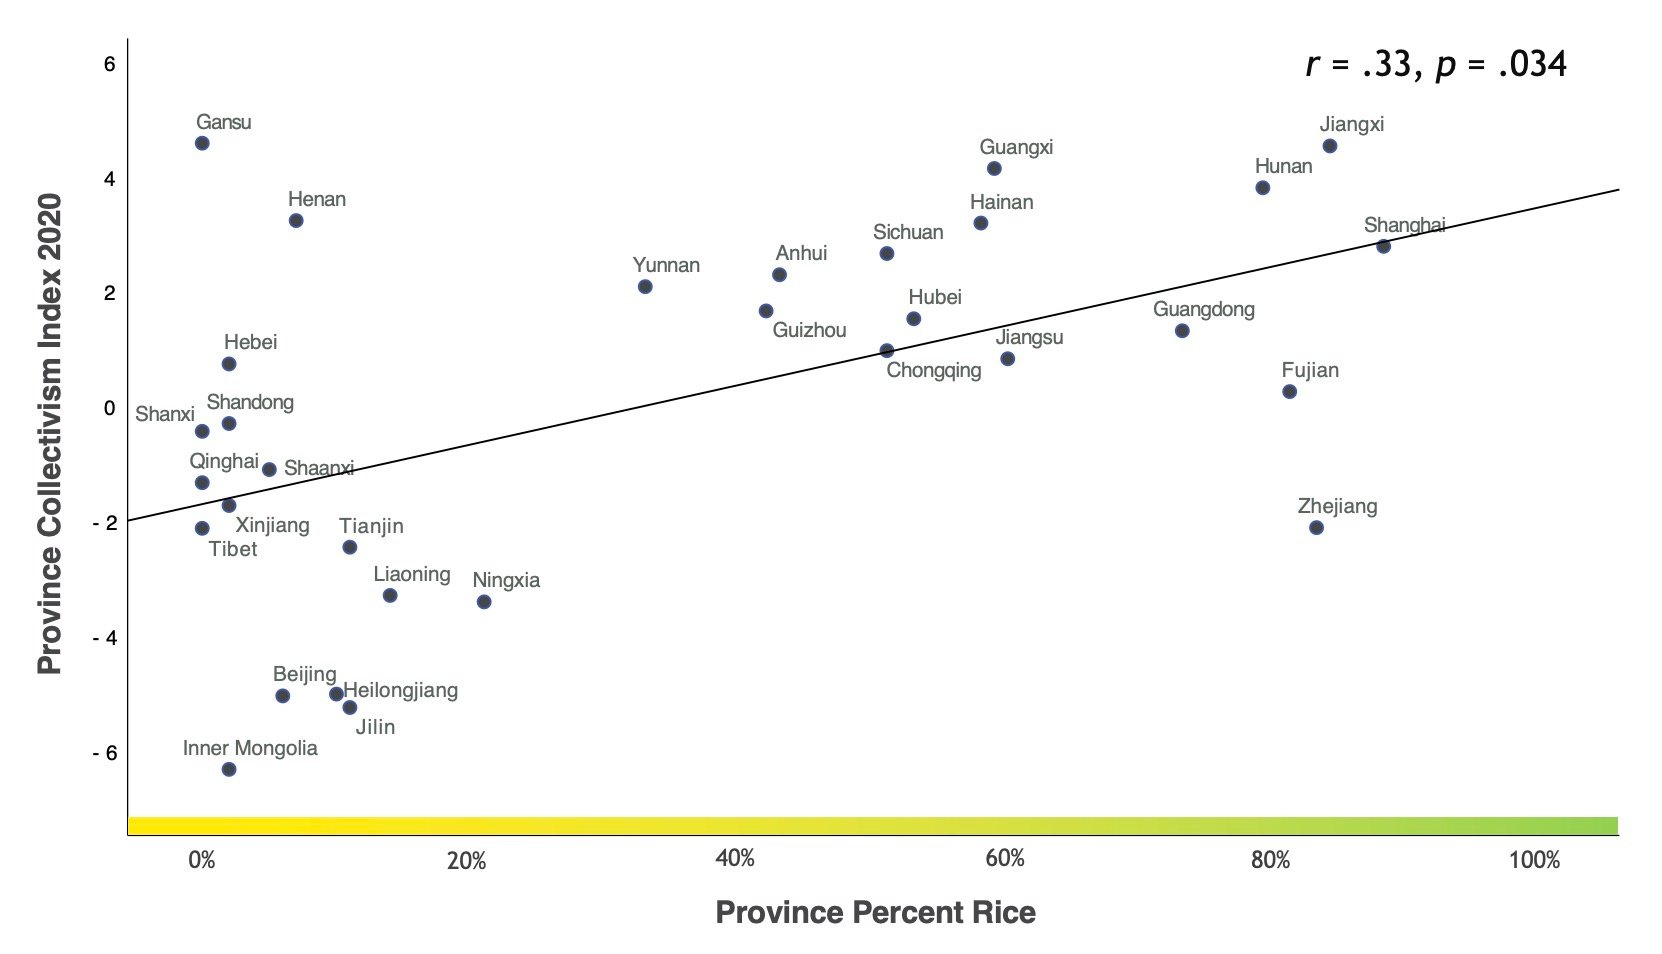
Building off my team's previous research, we analyzed whether regions' history of farming rice could explain why some places are more collectivistic. This is fits with the demands of rice farming. Rice farming required more labor than wheat, and it was built on irrigation networks that forced farmers to coordinate water use and maintenance. This could explain why southern China's rice-farming regions tended to score higher on collectivism.
My team created this index as a resource for fellow researchers to use. The journal Scientific Data was designed for researchers to create, validate, and share datasets for other researchers to use. All of the data is freely available on the Open Science Framework. The full text of the study is available without a paywall. These results may only be the beginning!
Follow the Topic
-
Scientific Data
A peer-reviewed, open-access journal for descriptions of datasets, and research that advances the sharing and reuse of scientific data.

Related Collections
With Collections, you can get published faster and increase your visibility.
Computer vision in plant science and agriculture
Publishing Model: Open Access
Deadline: Oct 10, 2026
Wearable and Computer Vision Data for Health and Behaviour Research
Publishing Model: Open Access
Deadline: Aug 08, 2026


Please sign in or register for FREE
If you are a registered user on Research Communities by Springer Nature, please sign in
Welcome to use our collectivism index!
Thanks to my co-authors, who did most of the hard work! @Liuqing Wei @Alexander English 👏