New Global Crop Type Maps Will Improve Analysis of Global Agricultural Production
Published in Earth & Environment

Explore the Research

Crop Type Maps for Operational Global Agricultural Monitoring - Scientific Data
Scientific Data - Crop Type Maps for Operational Global Agricultural Monitoring
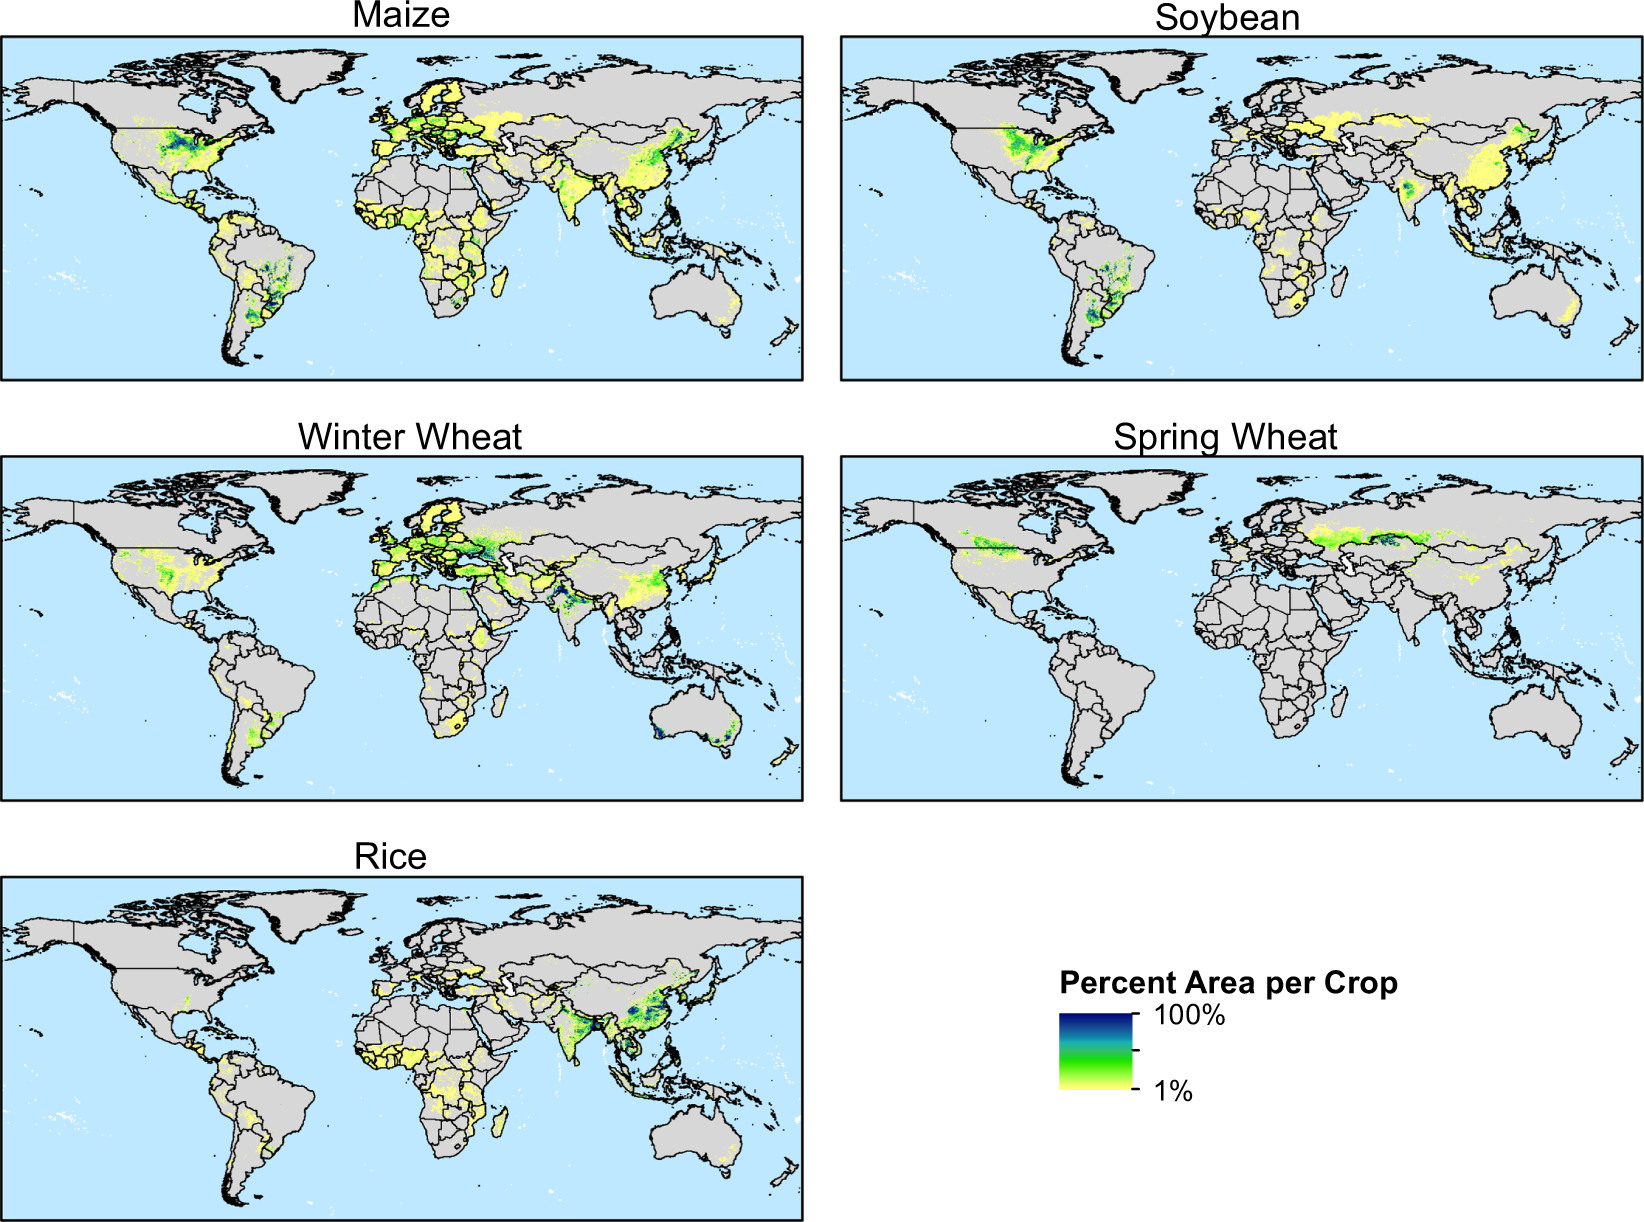
Climate change, a burgeoning population, severe weather events, and conflict can significantly impact agricultural productivity, destabilizing markets and therefore food prices for global consumers. Our team of international remote sensing and agricultural scientists is helping overcome these challenges by producing the first up-to-date global crop type maps for five major commodity crops: maize, winter wheat, spring wheat, soybeans, and rice. Created by harmonizing more than 20 datasets from a variety of national, regional, and global entities; our publicly available and annually updated crop type maps strengthen national and international responses to adverse agricultural events across the world.
Challenges to Global Food Security
Global food security is facing increased pressure from a changing climate and a growing population. Certain crops play a major role in feeding the world. Commonly called commodity crops, these include maize, wheat, soybeans, and rice. The success of these four crops plays a major role in not just keeping the world fed, but they also have a significant impact on global commodity crop markets and food prices. Understanding the condition of these crops around the world throughout the growing season is critical in stabilizing these markets.
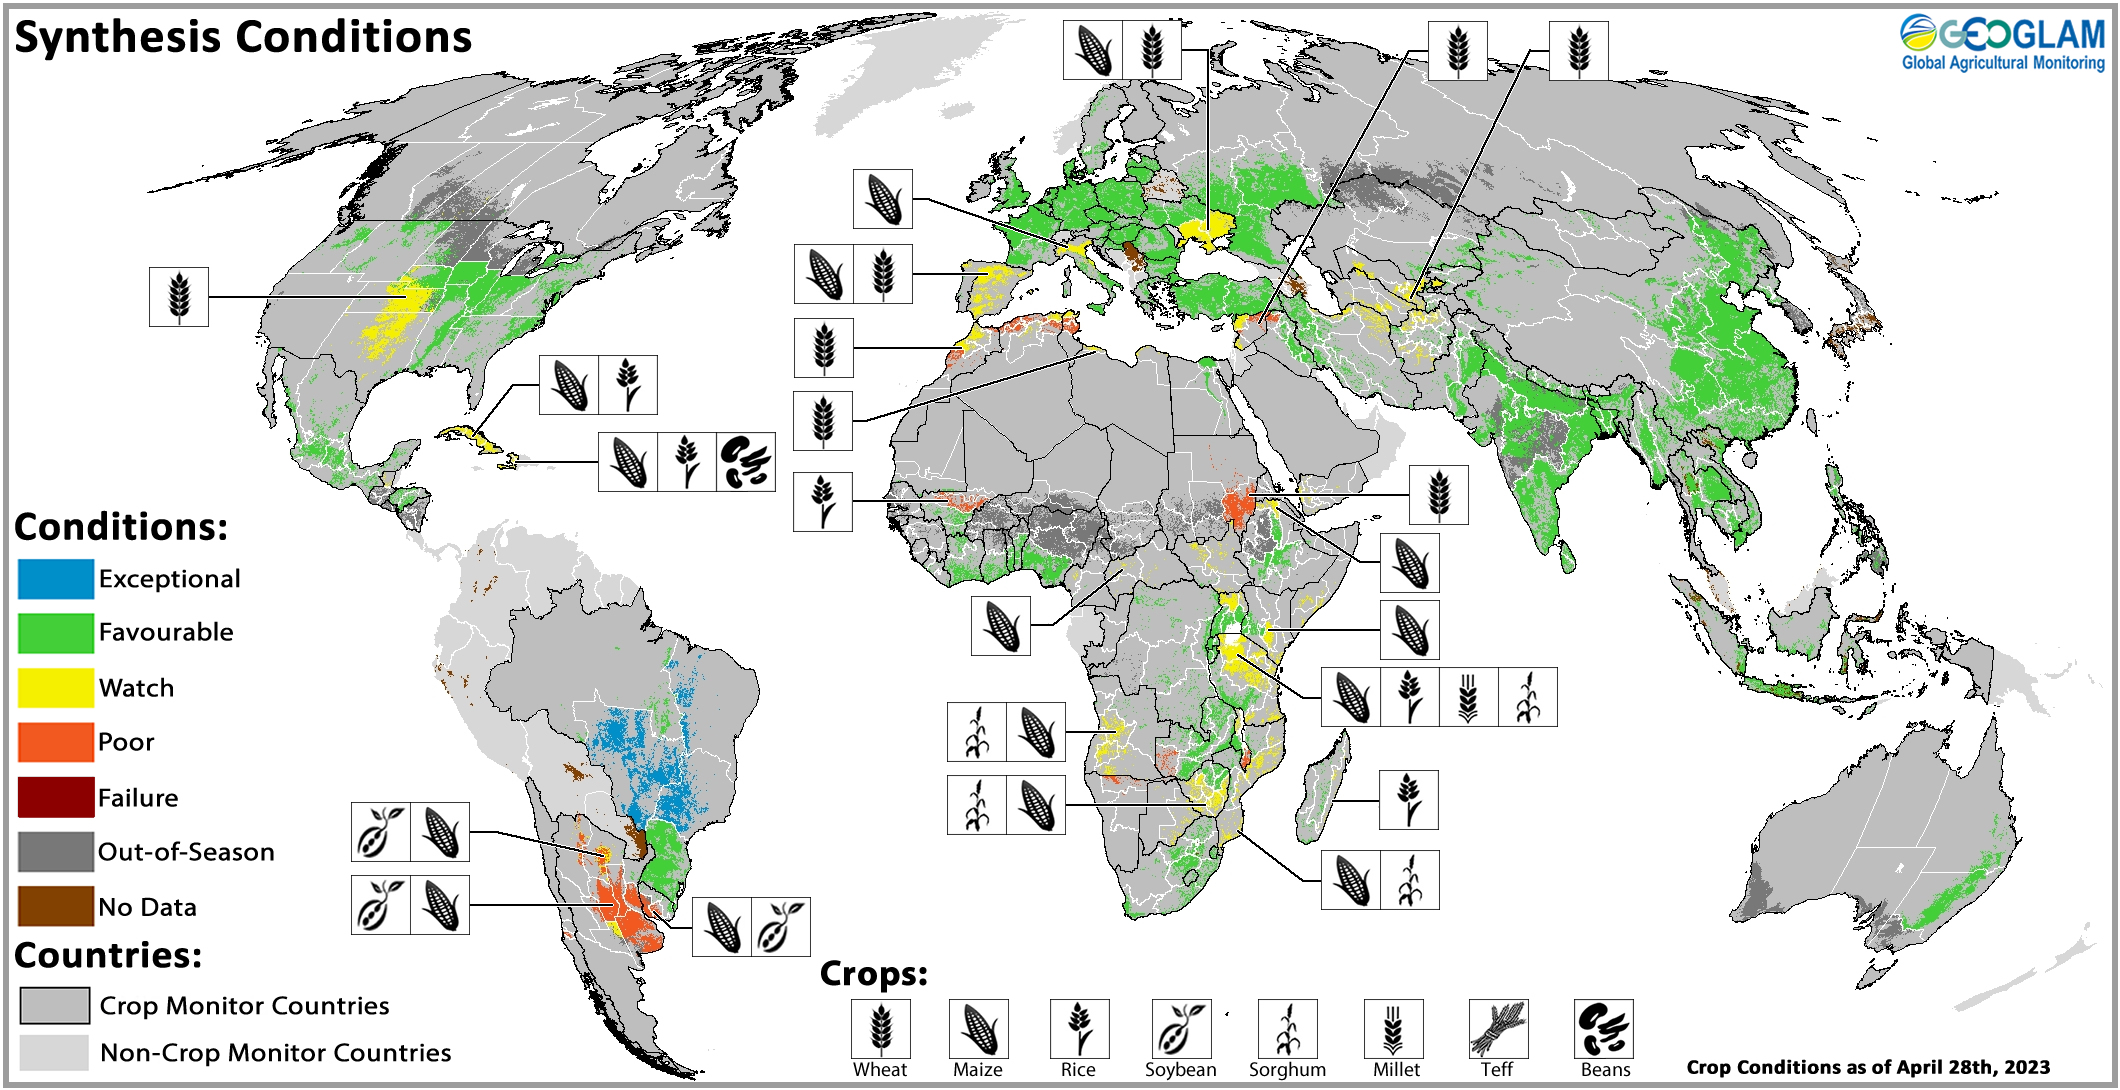
The AMIS (Agricultural Market Information System) and GEOGLAM (Group on Earth Observations Global Agricultural Monitoring) initiatives are two such international efforts – commissioned by the G20 Ministers of Agriculture in response to the food price crises of 2007/08 and 2010. One of the key activities supporting global agricultural commodity market transparency is the GEOGLAM Crop Monitor for AMIS, a monthly, publicly accessible, data-driven report on global crop conditions.
AMIS acts as a forum for economists and policymakers to enhance food market transparency, analyze global crop conditions, and coordinate policy action/response, whereas GEOGLAM is focused on improving crop monitoring capabilities, through in situ (ground) data and satellite Earth observations.

Satellites Improve Agricultural Monitoring
Traditional cropland survey methods are labor, time, and cost intensive. These resource constraints are heavy for wealthier countries and almost insurmountable for lower income countries, particularly those with high prevalence of smallholder farming. Earth observation (EO) satellites are helping us overcome these restraints and more easily monitor the surface of the globe over time. Combined with advancements in machine learning techniques and computing capabilities, EO data has drastically lowered the costs of agriculture monitoring.
We are now able to analyze global production throughout the growing season, map interannual/shifting cropland boundaries, more readily respond to destructive weather events, and more quickly and accurately inform policy response to emerging humanitarian and market crises.
The required basis for much of this analysis are accurate crop type maps – which include the spatial distribution of cropland as well as the actual crops being grown in that region. Many crop type maps have been developed for different crops and regions around the globe by various governments, researchers, and intergovernmental organizations. However, despite the importance of crop type maps, until recently there was a lack of up-to-date global crop type maps of the main commodity crops.
In response to this information gap, our team of GEOGLAM and NASA Harvest scientists harmonized 24 national and regional datasets from 21 sources covering 66 countries to create the first global and up-to-date crop type maps for the four major commodity crops. These maps will be used to produce the GEOGLAM Crop Monitor for AMIS monthly reports going forward, will be updated on an annual basis as new datasets are made available, and will be made available to the public through CropMonitor.org. as well as through the Global Agricultural Monitoring System (GLAM) maintained by the NASA Harvest Consortium.
How did we make these maps?
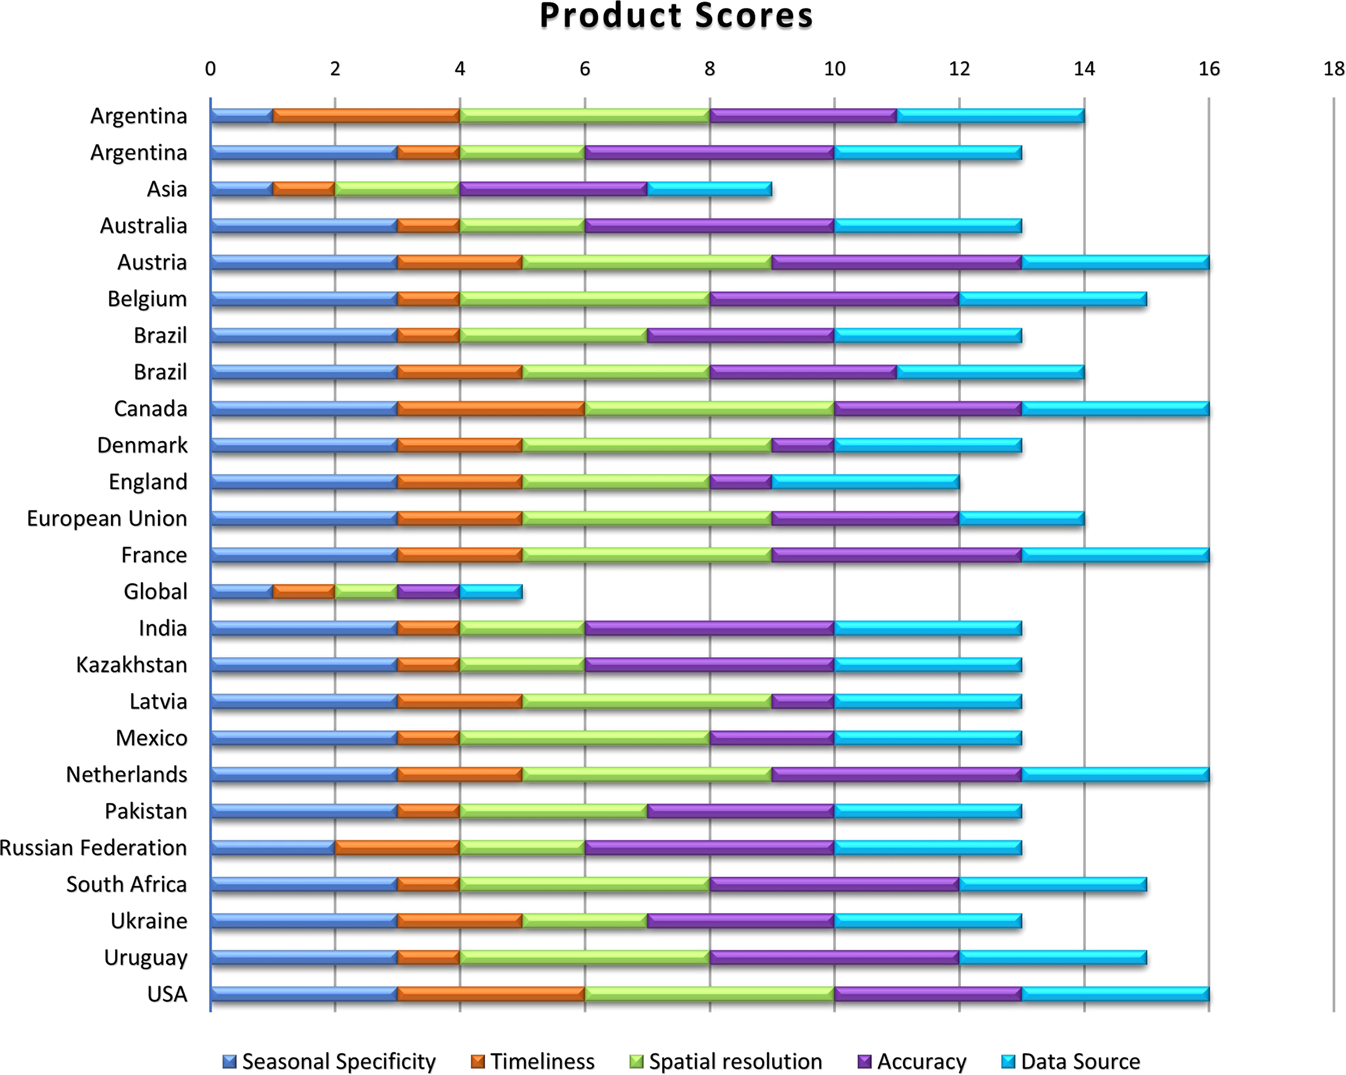
To create these maps, we went through an extensive dataset selection process before unifying the datasets into the final map products. Our selection process involved: identifying potential datasets from a variety of national, regional, and global sources; evaluating the datasets based on a common set of criteria; and then weighting each dataset based upon this criteria.
The five criteria we by which we evaluated each dataset are as follows:
Seasonal specificity
Important remote sensing-derived products like in-season crop assessments and yield forecasts require underlying crop type maps that account for multiple growing seasons within a year. Thus it was important that the maps we developed be capable of distinguishing between planting paradigms like spring wheat and winter wheat; first and second maize or soybean seasons; and multiple rice growing seasons. We accounted for this in the map model by weighting maps with greater seasonal specificity higher than maps that aggregated multiple seasons.
Timeliness
Cropland can change significantly over time due to factors like crop rotation or market pressures. Maps that account for in-season changes are thus ideal for our purposes, however these tend to be rarer. Still, datasets based on recent seasons are more likely to be accurate than datasets based upon older seasons, therefore we applied a weighting score ranging from 1-4 for each input dataset, wherein the dataset’s score was assigned by how recent the data for that season was.
Spatial resolution
Numerous studies show that mapping cropland is complicated by factors such as field size and shape, crop diversity, and overall composition of the landscape. While finer spatial resolution data does not always equate to higher accuracy in crop type mapping, it often does correlate to higher accuracy when paired with locally produced training and validation data which many of our selected datasets are. Because of this, we weighted finer-scale spatial resolution maps higher than coarser-scale maps.
Accuracy criterion
The accuracy of our harmonized map is reliant upon the accuracy of the input datasets used to produce it. As such we identified the available accuracy metrics of each dataset and then weighted them accordingly. For example, datasets having an accuracy above 90% were given a weighted score of 4; between 80-90% a 3; and maps with reported accuracy below 80% were given a 2. Some of the datasets used in our analysis lacked accuracy reporting, and to remedy this we compared them with available sub-national official statistics to approximate accuracy assessments. While not a perfect solution, this was deemed an acceptable approximation for our purposes. Datasets that were unable to have accuracy assessed through this method were assigned weighted values of 1.
Data source criterion
This final selection criterion looked at the relative specificity for each selected dataset. Sub-national and national maps tend to be created using models and ground data collected for that specific country, and are specialized for the country. Existing regional and global maps often generalize to allow for broader-scale mapping, use less nation-specific data, and thus tend to have lower accuracy at the national-scale. Significant progress is being made in improving the accuracy and scalability of models with sparse ground training data; however most current crop type maps follow the above pattern. Because of this, we assigned weighted scores based on whether the input datasets were at a national, regional, or global scale.

Map Unification
Once we selected and weighted each dataset based upon the above criteria, we unified the datasets into a common map. As the input datasets were at different spatial resolutions, the team determined which resolution would be used for the output crop type maps. Given that changes of agricultural conditions over time can be closely tied to different climate factors, it is useful to have our crop type maps at the same resolution as commonly-produced remotely-sensed climate variables to simplify future modeling efforts. Therefore, we decided to produce our maps at the same resolution (0.05 degrees) as the popular climate modeling grid climate variable products produced by NASA’s MODIS mission.
We ultimately converted each dataset into a binary classification of cropland vs non-cropland; overlaid each dataset layer on top of each other; and then calculated the percentage of each pixel in the climate modeling grid identified as a given crop type.

Going Forward
Our work has produced five global Geotiff files at 0.05 degrees for each of the major commodity crops (Rice, Maize, Soybeans, Winter Wheat, and Spring Wheat). Our framework is reproducible, allowing these maps to be brought up to date on an annual basis as updated input datasets become available. These five maps represent the best available, most up-to-date globally harmonized datasets on the location of the major commodity crops.
.png)
That being said, there are still improvements that could be made to enhance them. As mentioned above, in-season maps are currently rare for many nations and thus we have had to rely upon previous season maps. However, as new public and commercial satellite missions continue to improve sub-weekly and daily observations, the potential for more common in-season maps will increase and we will be able to incorporate them into our maps.
Additionally, some of the input datasets lacked accuracy assessments, compelling us to approximate accuracy based upon sub-national sown area statistics. To overcome this limitation, we call for an increased collection of training and validation data and the development of modeling techniques for data-sparse regions.
In addition to the direct operational benefit that our maps will provide for future GEOGLAM Crop Monitor reports and other agricultural-related research, our maps also show the benefit of international collaboration. These maps, and our broader work, would not be possible without the established partnerships and contributions of GEOGLAM partners around the world. Our maps serve as operational examples of what international cooperation can produce.
This blog post summarizes a recent paper co-authored by Inbal Becker-Reshef, Brian Barker, Alyssa Whitcraft, Patricia Olivia, Kara Mobley, Christina Justice, Ritvik Sahajpal. The post was written by Keelin Haynes, Mary Mitkish, and Brian Barker.
Follow the Topic
-
Scientific Data

A peer-reviewed, open-access journal for descriptions of datasets, and research that advances the sharing and reuse of scientific data.
Related Collections
With Collections, you can get published faster and increase your visibility.
Data for crop management
Publishing Model: Open Access
Deadline: Apr 17, 2026
Data to support drug discovery
Publishing Model: Open Access
Deadline: Apr 22, 2026


Please sign in or register for FREE
If you are a registered user on Research Communities by Springer Nature, please sign in