Pathways towards whole-sector residential decarbonization in the United States
Published in Sustainability

In a paper recently published in Nature Climate Change, we present wide ranging decarbonization scenarios for the US residential sector to 2060. This work represents the culmination of my PhD, which focused on past trends and future directions of emissions from residential construction and energy use in the US. As an Industrial Ecologist, it is important for me to consider emissions coming from materials and construction activities, as well as those from energy use. Doing so not only makes for a more comprehensive analysis of sectoral emissions, in this case it allowed us to tackle a pressing question which occurred to me early in my PhD regarding the strong influence of building age on energy demand and emissions (older buildings use more energy per unit floor area than new buildings, all else equal). What if we were to speed up housing stock turnover, i.e. the rate at which we build new houses, and demolish old ones? Would the improved efficiency of the housing stock reduce emissions enough to counter the increased emissions from more construction? Our results from this paper provide an emphatic ‘No’ to that particular question. Higher turnover would increase emissions, first of all due to the higher embodied emissions from construction, and second because the size differential between old and new houses (single-family homes built in the 2010s are on average 1.5 times larger than single-family homes built in the 1970s, and our baseline assumption is that new buildings keep the same size characteristics by type and location as those built in the 2010s) negates much of the energy efficiency benefits of replacing an old home with a new home.
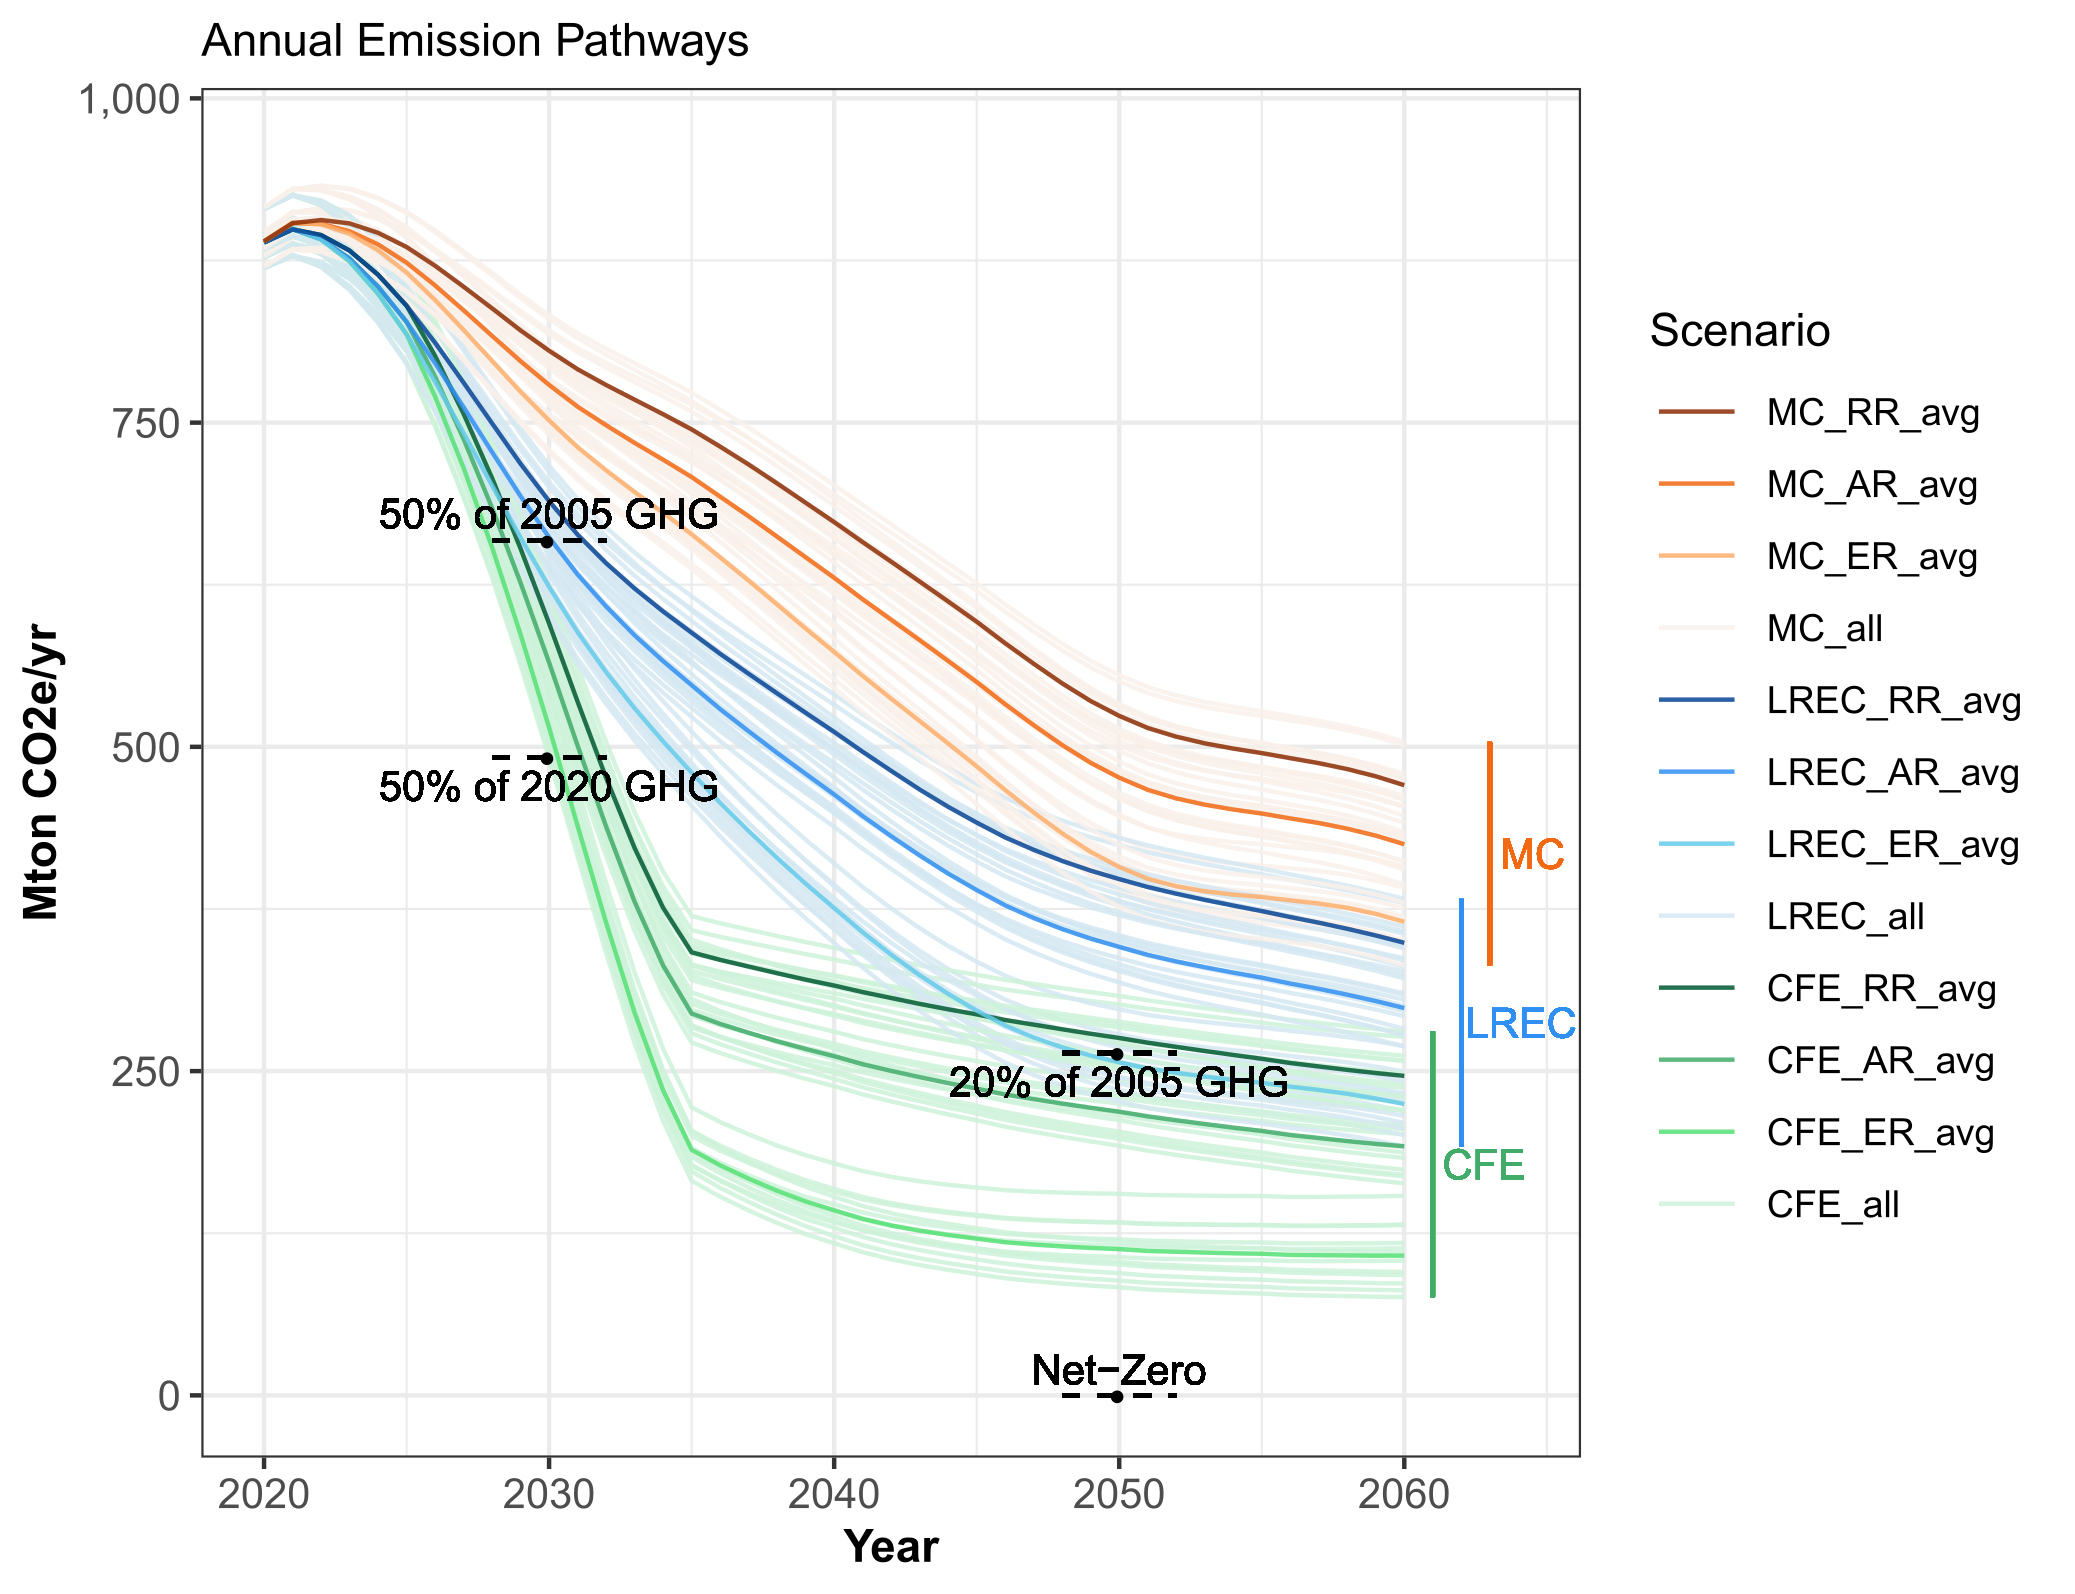
The obvious alternative to tearing down existing inefficient homes is to renovate them – increasing the envelope efficiency through reduced air leakage and added insulation, and changing the major energy-consuming equipment (space and water heaters, air conditioners) to more efficient alternatives. To calculate the effects of renovation in the next 40 years we modeled three renovation scenarios: regular, advanced, and extensive. Regular means to continue renovation and equipment replacement rates of recent decades, with a very small increased preference for replacing end-of-life space/water heating equipment with electric alternatives. Advanced means a 50% increase in the rate of renovation and equipment replacement, and a higher preference for more efficient replacements with moderate increases in electrification of space/water heating equipment. Extensive renovation also involves a 50% increase in renovation/replacement rates, but with a much stronger focus on heat-pump electrification of heating, with heat pumps accounting for all replacements of fossil-based space heating equipment from 2025 onwards. This strategy can reduce emissions by a lot. It is particularly effective in the Northeast US (New England and New York state) where winters are cold and electricity is relatively low-carbon, but many houses have poor thermal envelopes and still use gas and oil heating equipment. At a national level, when combined with our most ambitious electricity scenario (carbon free electricity from 2035), extensive renovation reduces 2050 annual emissions by 56% compared to regular renovation, while cumulative 2020-2060 emissions are lower by 27%.
Pathways of residential emissions
In a continuation of past trends, reducing the emissions intensity of the electricity grid generally has the greatest potential to reduce overall residential emissions, with renovation being the second major determinant of residential emissions pathways. A carbon-free electricity grid by 2035 would support a precipitous decline in annual emissions through 2035, although subsequent reductions would be considerably slower.

The reductions in residential emissions arising from cleaner electricity would not be equally distributed throughout the country. With our second-most-ambitious electricity scenario we see the largest reductions in emissions in the center of the country, in states like Kansas, Missouri, Tennessee and Kentucky. These results are directly influenced by the choice of electricity scenario - in this case we use the 'Low Renewable Electricity Cost' NREL scenario, which projects the greatest reduction in the emissions intensity of electricity through the center of the country. But the regional pattern of electricity decarbonization is not the only influential factor here - regions of the country with higher share of heating coming from electricity (e.g. Tennessee, Kentucky, Alabama) also see greater benefits from a cleaner grid.

The greatest emission reductions arise from a combination of clean electricity and extensive electrification-focused renovations. Sometimes the total impact of these two strategies is larger than the sum of the parts. In Wisconsin for instance, emission reductions in extensive renovation and 'Low Renewable Electricity Cost' electricity scenarios individually are 7% and 20%, respectively, but the combined reduction is 38%. These non-linear benefits are due to the conversion of emission intensive fossil fueled heating technologies to highly efficient electric (heat pump) alternatives and simultaneous reduction of electricity carbon intensity.
More apartments, electric new homes, limiting floor area growth
While rapid upscaling of clean electricity and extensive renovation are the big-hitters when it comes to overall residential decarbonization, the solutions do not end there. Other strategies considered in our scenario set include reducing the size of new homes (implemented through a cap on size of new homes at 279 m2/3000 ft2), an increase in the complete electrification of new homes, and an increase of the ratio of multifamily to single-family housing in new construction. These solutions show substantial potential in certain locations. In regions with relatively clean electricity and large demand for new housing (most notably California), building smaller and electric new homes has quite a large potential for emission reduction. Similarly, regions with cleaner electricity, high housing demand, or tendencies to build large single-family homes can make meaningful reductions in emissions from higher shares of multifamily in new housing stock growth.

The modeled emissions reductions from higher multifamily housing stock growth and reduced floor area homes are influenced by the details of how those scenarios were implemented. Back in 2020 when we were designing the housing stock scenarios, we didn't consider the potential for sustained growth in very small houses (by US standards) such as accessory dwelling units. Neither did we consider floor area and type related strategies applied to existing housing, such as conversions which split existing large housing units into multiple smaller housing units, or increased household sharing. Incorporating these approaches would allow for greater emission reductions.
Scaling up of low-carbon technologies
The bulk of emissions savings through the coming decades will rely on grid decarbonization and extensive, electrification focused renovations. The Low Renewable Electricity Cost scenario would require something like current rates of growth in renewable capacity (around 35 GW growth of combined wind and solar per year, compared to 30 GW growth in 2019), while achieving Carbon Free Electricity by 2035, would require a much stronger scale-up (average 120 GW/yr to 2035). The Extensive Renovation scenario would involve envelope renovations applied to almost 3 million housing units annually in the next few years, rising to 7 million units annually by 2050. With the combination of Extensive Renovation of existing homes and Increased Electrification of new homes, demand for heat pumps for renovation and new construction would increase from 3 million/yr over the next few years to 9 million/yr by 2050. These are strong growth figures, but could be achieved if current growth rates in the supply of heat pumps are sustained, and if production capacity of air-conditioners producers were utilized. Achieving the outlined emission reductions appears quite feasible, but will not happen without changes in energy, planning, and housing policies. Going further and getting closer to zero emissions by 2050 would involve greater ambition in multiple areas including low-carbon material production, and reduced housing stock floor area growth through measures applied to both new and existing homes.
Explore the results
The summary results are freely available in the github repository accompanying this research, mostly in the 'Figure_Results_Data' folder.
Follow the Topic
-
Nature Climate Change

A monthly journal dedicated to publishing the most significant and cutting-edge research on the nature, underlying causes or impacts of global climate change and its implications for the economy, policy and the world at large.
What are SDG Topics?
An introduction to Sustainable Development Goals (SDGs) Topics and their role in highlighting sustainable development research.
Continue reading announcement


Please sign in or register for FREE
If you are a registered user on Research Communities by Springer Nature, please sign in