Squinting at Stains, Scaling with Code: Building MARQO for Multiplex Mastery
Published in Bioengineering & Biotechnology, Cancer, and Protocols & Methods
When I first joined the team at The Tisch Cancer Institute at the Icahn School of Medicine at Mount Sinai, I didn’t expect to spend my days squinting at tissue slides and my nights debugging MATLAB scripts. But I quickly realized that a key challenge in our cancer immunotherapy research was decoding multiplex tissue images to uncover spatial biomarkers of treatment response. What I thought would be traditional benchwork turned into a blend of molecular detective work and coding marathons, a never-ending puzzle that required both clean code and carefully optimized immunohistochemical staining protocols.
Our lab collaborated on diverse clinical trials exploring new therapies designed to help the immune system fight cancer, and we were fortunate to be at a unique translational intersection between the research and clinical teams. This meant that we worked closely with the surgeons and clinical teams to acquire valuable neoadjuvant tissues samples, returned to the lab to chop down the tissue to what we called a “tissue soup,” and then performed a myriad of experiments to figure out what exactly was happening to the patients receiving a regiment of diverse immunotherapies. From day one, I was mesmerized by the breadth and complexity of all these different assays. From observing the genomic and proteomic patterns using cutting-edge technologies like single-cell sequencing, CyTOF, and CITE-seq, to preserving tissue slices in paraffin for spatial imaging, it seemed that we did everything possible to uncover what was happening in these tissues. Ultimately, we were trying to spot patterns between normal and cancerous tissues, primary tumors and metastases, and patients who responded to treatment compared with those who did not. Then, if we found any unique patterns, we’d publish our findings and recommend that specific treatment. In other words, we performed experiments to uncover if and how the body used its own immune system to fight cancer in response to certain drugs. It was some gnarly work – and now, I was part of the team.
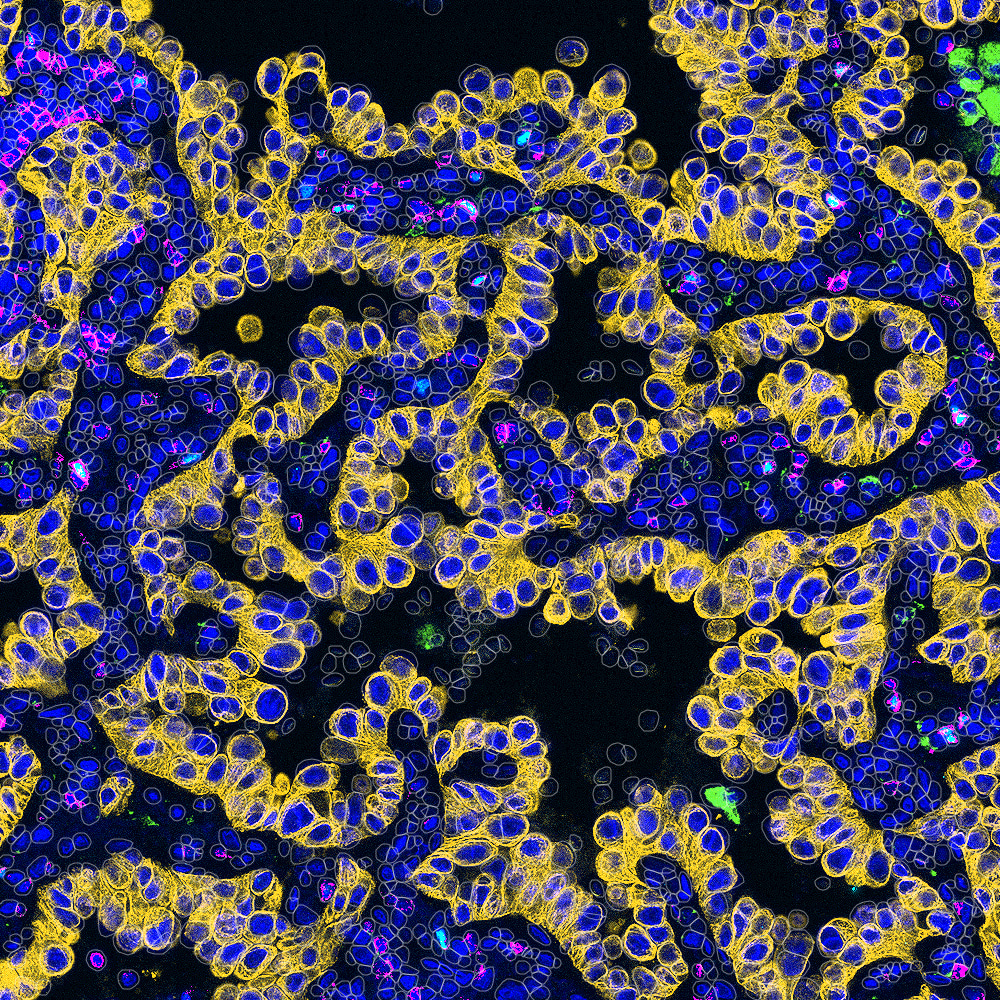
Early on, I wanted to meaningfully contribute to the cool science that was happening. I wanted to find my niche area where I could possibly use some of my skills and, well, go from there. Having just graduated undergrad with a degree in bioengineering, where I had already worked on some imaging projects in prostate cancer and peritoneal dialysis, I knew my interests spanned image analysis and coding. Therefore, it seemed like a natural fit for me when my coworker Sasha asked to train me for an imaging assay that had been developed in the Gnjatic Lab, called Multiplex Immunohistochemical Consecutive Staining on a Single Slide (MICSSS). This high-throughput, low-cost multiplex IHC method builds on traditional immunohistochemistry, which stains tissues for specific antigens to visualize where proteins are expressed within cells and tissue structures. Multiplex IHC extends this by staining, imaging, removing the stain, and re-staining the same slide for different markers. This allows us to study co-expression of multiple antigens within a single tissue section, which provides an advantage over traditional singleplex IHC by revealing how markers overlap in the same cells. After learning how to conduct MICSSS, I was quite eager to jump into the analysis of the images generated by the assay. With my prior experience, I thought I’d easily pick up the analysis. Spoiler: it was not easy. Step by step, program after program, click after click, I learned the workflow: selecting regions of interest, rigidly registering them in FIJI, deconvoluting color channels in QuPath, and then thresholding all pixels for positive signal solely by eye. That one sentence doesn’t do the workflow justice, but all in all, it worked well enough and got us data.
Well, given that I’m writing this blog post, it’s probably clear that the workflow didn’t last too much longer. Although rewarding, the process was lengthy and labor-intensive. Moreover, limitations quickly became apparent. Most imaging platforms worked well for singleplex data but struggled with multiplex methods like MICSSS, multiplex immunofluorescence, and cyclic immunofluorescence. At the time, analyzing a single whole-slide image was challenging, and sometimes impossible if the tissue was large enough, let alone multiple slides that needed alignment. Even if we could segment cell boundaries and analyze each stain separately by using preexisting algorithms, there was no practical way to reconcile the information across stains. For example, once the same tissue is stained and imaged multiple times, it rarely sits in exactly the same position on the slide, since tissue can subtly distort and get damaged over time. On top of that, each image may be cropped differently, leading to misalignment at the tissue level, and even more so at the single-cell level. Because defining a CD3+CD8+ T cell or CD3+CD4+CD8-CD25+ regulatory T cell requires knowing the expression of multiple antigens on the same cell, this imprecise alignment made it difficult to do so reliably. Each multiplex method also required its own specialized software and workflows, often making results inconsistent when collaborating with other teams. Often, we had to rely on our pathologists for qualitative judgments, such as staging invasiveness or scoring aggressiveness based on staining intensity. But again, this took time, and made this methodology inadequate for a high-throughput analysis workflow.
I was about six months into my time at Mount Sinai when the COVID-19 pandemic hit. Like so many others, our team was significantly impacted, and many of us transitioned to full-time COVID-19 research. This left fewer of us, including me, to continue the immunotherapy analysis, which hadn’t slowed one bit. This, plus the more time I was forced to spend at home, provided the necessary impetus to brainstorm improvements to our analysis workflow. Over countless Zoom calls with my team, I proposed to develop and automate parts of our methodology in MATLAB. But it quickly became apparent that this was easier said than done. It really had started with baby steps – how do I open an .ndpi file at a certain magnification in MATLAB? A whole day’s work. How do I deconvolute the image channels to isolate true positive signal? First, figure out what math is exactly happening during deconvolution; then, a whole week’s work. Then, I realize a publicly-available package is available for that step, and it can do so much more robustly, so I replace a whole week’s worth of code with a one-liner. And so the process repeated. The endless days of COVID quarantine seemed to blur together, but bit by bit, the progress we made with the code offered pockets of hope. We also reached out for help and recruited other coders and experts – a special thank you to Igor for joining and pushing the project even further! Each time we introduced an automated step, we asked ourselves whether it should remain fully automated or if it still needed expert oversight, since quality control by a pathologist or expert is critical for much of this work. Eventually, our efforts showed that user-guided automation could meaningfully cut down analysis time and boost throughput, helping us process multiplex samples from both immunotherapy studies and COVID-19 cases, and soon thereafter, for other studies like diabetes and HIV.
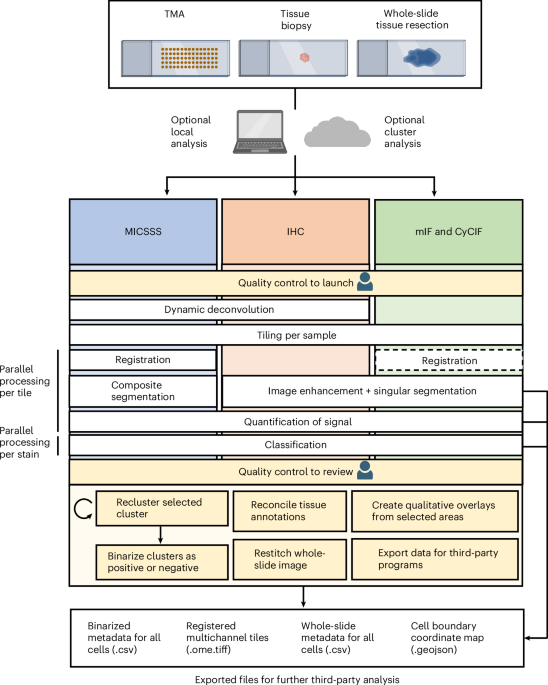
Throughout this project, we faced several complex technical challenges that often sent us back to the drawing board to weigh the pros and cons of every possible solution. Often, we left these meetings with more questions than when we started. Are color deconvolution profiles consistent across tissue areas? Can we cluster cell populations solely from morphology? Since the multiplex imaging field was still in its infancy, with limited prior work to guide us, many solutions demanded significant creativity, which our interdisciplinary team was well suited for. The images we analyzed per stain were quite large – on the magnitude of many gigabytes of data! Therefore, we employed a tiling with overlap approach, where we could perform individual analyses per tile. We experimented with diverse ways to register, or align, whole-slide images so that tissue could elastically warp to align cells across stains. We curated a specialized segmentation methodology that removed artifacts and red blood cells, retaining a final segmentation mask with only cells consistent across staining iterations. We knew user oversight would be key, so we designed a semi-automated quantification and clustering step that empowered users to pinpoint cell populations of interest. As the pipeline garnered attention at our institution, the need for diverse analyses and visualization methods quickly became clear, from quantitative cell metrics to population overlays and neighborhood interaction statistics. One day, as the pipeline’s popularity grew, my coworker Pauline turned to me and said, “Mark, we need to give this pipeline a name.” Half-joking, I replied, “How about MARQO: Multiplex-imaging Analysis, Registration, Quantification, and Overlaying?” And just like that, the name stuck.
Now, five years later, we are thrilled to announce MARQO’s official launch and the publication of an article detailing its methodology, validation, and its first application: using MICSSS to identify, and for the first time, quantify an enrichment of CD8 T cells in responders to anti-PD-1 therapy. MARQO integrates a suite of automated steps, such as whole-slide registration, single-cell nuclear segmentation, and unsupervised clustering of cells based on morphology, position, and staining patterns. Importantly, we designed MARQO to keep the user involved where their expertise matters most. For example, after clustering, users review and confirm which cell groups represent true positive and negative staining populations. Our aim has always been for MARQO to enhance, not replace, the role of a pathologist or experienced user. We built a comprehensive graphical user interface (GUI) to make the tool accessible to users without a computational background and to support a wide range of tissue types and imaging technologies. Currently, MARQO can process MICSSS, multiplex immunofluorescence (COMET, Orion, Vectra), cyclic immunofluorescence (RareCyte), and Singleplex IHC data. It works on tissue samples of all sizes, from small core biopsies to tissue microarrays and full-slide sections. Because analysis speed is crucial, MARQO was developed to take full advantage of available CPU cores, parallelizing tasks to adapt to any computing environment.
Finally, we want to emphasize that MARQO is not intended to replace existing imaging tools or workflows entirely. Instead, it is meant to serve as a flexible, user-guided platform that can integrate with and complement what is already out there. We are excited to continue expanding its capabilities in future versions, though for certain functionalities we will rely on existing tools that continue to serve us well. And thanks to the invaluable support of my mentors, Drs. Sacha Gnjatic and Miriam Merad, I’m now excited to share this tool with the world.
See here for the article: https://www.nature.com/articles/s41551-025-01475-9
See here for the GitHub: https://github.com/igorafsouza/MARQO
-Mark Buckup
Follow the Topic
-
Nature Biomedical Engineering
This journal aspires to become the most prominent publishing venue in biomedical engineering by bringing together the most important advances in the discipline, enhancing their visibility, and providing overviews of the state of the art in each field.

Related Collections
With Collections, you can get published faster and increase your visibility.
Implantable wireless communication technologies
Publishing Model: Hybrid
Deadline: Nov 28, 2026
Medical Ultrasound: Emerging Techniques and Applications
Publishing Model: Hybrid
Deadline: Jan 29, 2027


Please sign in or register for FREE
If you are a registered user on Research Communities by Springer Nature, please sign in