Syngeneic hematopoietic stem cell transplantation for acute myeloid leukemia: A propensity score-matched analysis
Published in Cancer
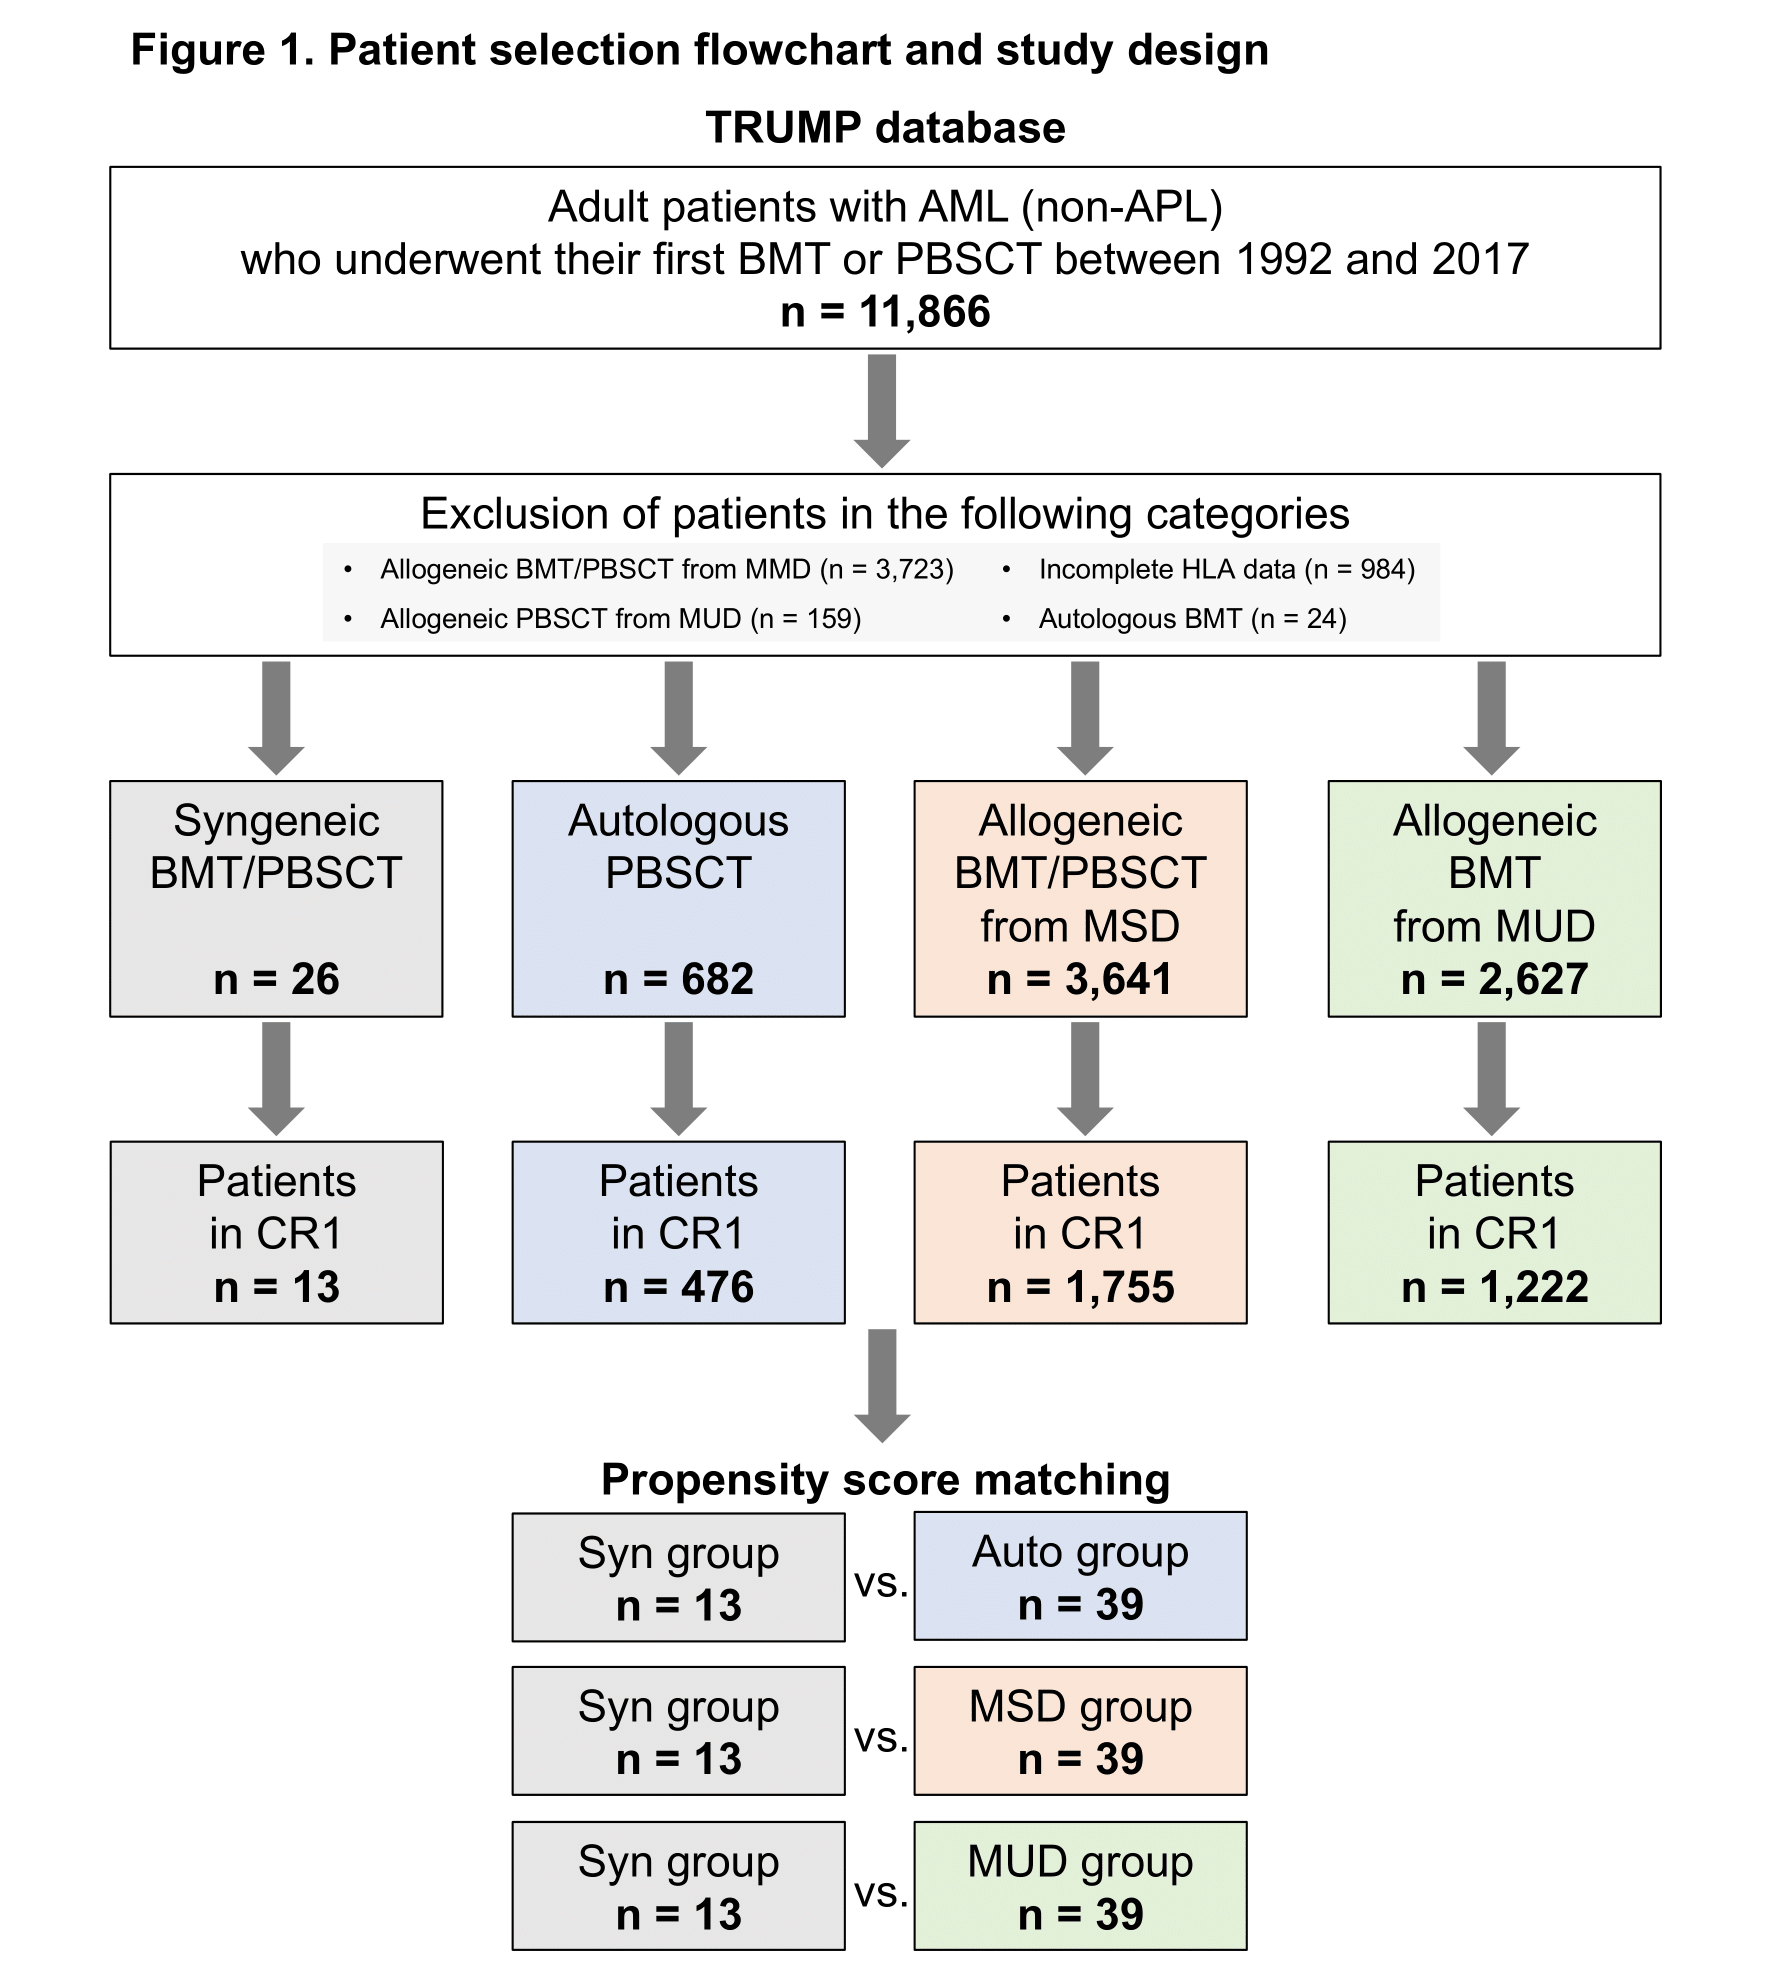


In the present study, we aimed to evaluate outcomes and prognostic factors in patients with AML after syngeneic HSCT and to compare these outcomes with those of autologous or allogeneic HSCT for patients in first complete remission (CR1) using the national registry data of the Transplant Registry Unified Management Program in Japan.
Patients eligible for enrollment met the following criteria: (1) age ≥16 years; (2) diagnosis of AML (except for acute promyelocytic leukemia); and (3) receiving their first bone marrow transplantation (BMT) or peripheral stem cell blood transplantation (PBSCT) between 1992 and 2017. Among them, the following four groups were selected: a “Syn” group included those who underwent syngeneic BMT or PBSCT; “Auto” group, autologous PBSCT; “MSD” group, allogeneic BMT or PBSCT from a human leukocyte antigen (HLA)-matched sibling donor (MSD); and “MUD” group, allogeneic BMT from an HLA-matched unrelated donor (MUD).
To minimize selection bias and confounding factors, we performed a propensity score (PS) matching analysis. Among patients in CR1, PSs between the Syn and Auto, Syn and MSD, and Syn and MUD groups were calculated using logistic regression with the following factors: age at HSCT (<40 years vs. ≥40 years), sex (female vs. male), cytogenetic risk (favorable vs. intermediate vs. poor vs. unevaluable), and the year of HSCT (1992–2003 vs. 2004–2017). Graft source (BM vs. PBSC) was also used to calculate the PS between the Syn and MSD groups. Matching was performed using the nearest-neighbor matching method, with the caliper width fixed at 0.2. The ratio of the Syn group to the Auto, MSD, and MUD group was 1:3. The C-statistic was calculated to evaluate the discrimination of the PS. To compare baseline characteristics between the Syn and Auto, MSD, and MUD groups, categorical variables were compared using Fisher’s exact test. The balance of covariates after PS matching was assessed using P-values and standardized mean differences.
The primary endpoint was the 5-year overall survival (OS) rate after HSCT. The secondary endpoints were the 5-year leukemia-free survival (LFS), 5-year cumulative incidence of relapse, 5-year cumulative incidence of non-relapse mortality (NRM), days from HSCT to neutrophil and platelet engraftment, 100-day cumulative incidence of acute graft-versus-host disease (GVHD), and 1-year cumulative incidence of chronic GVHD after HSCT.
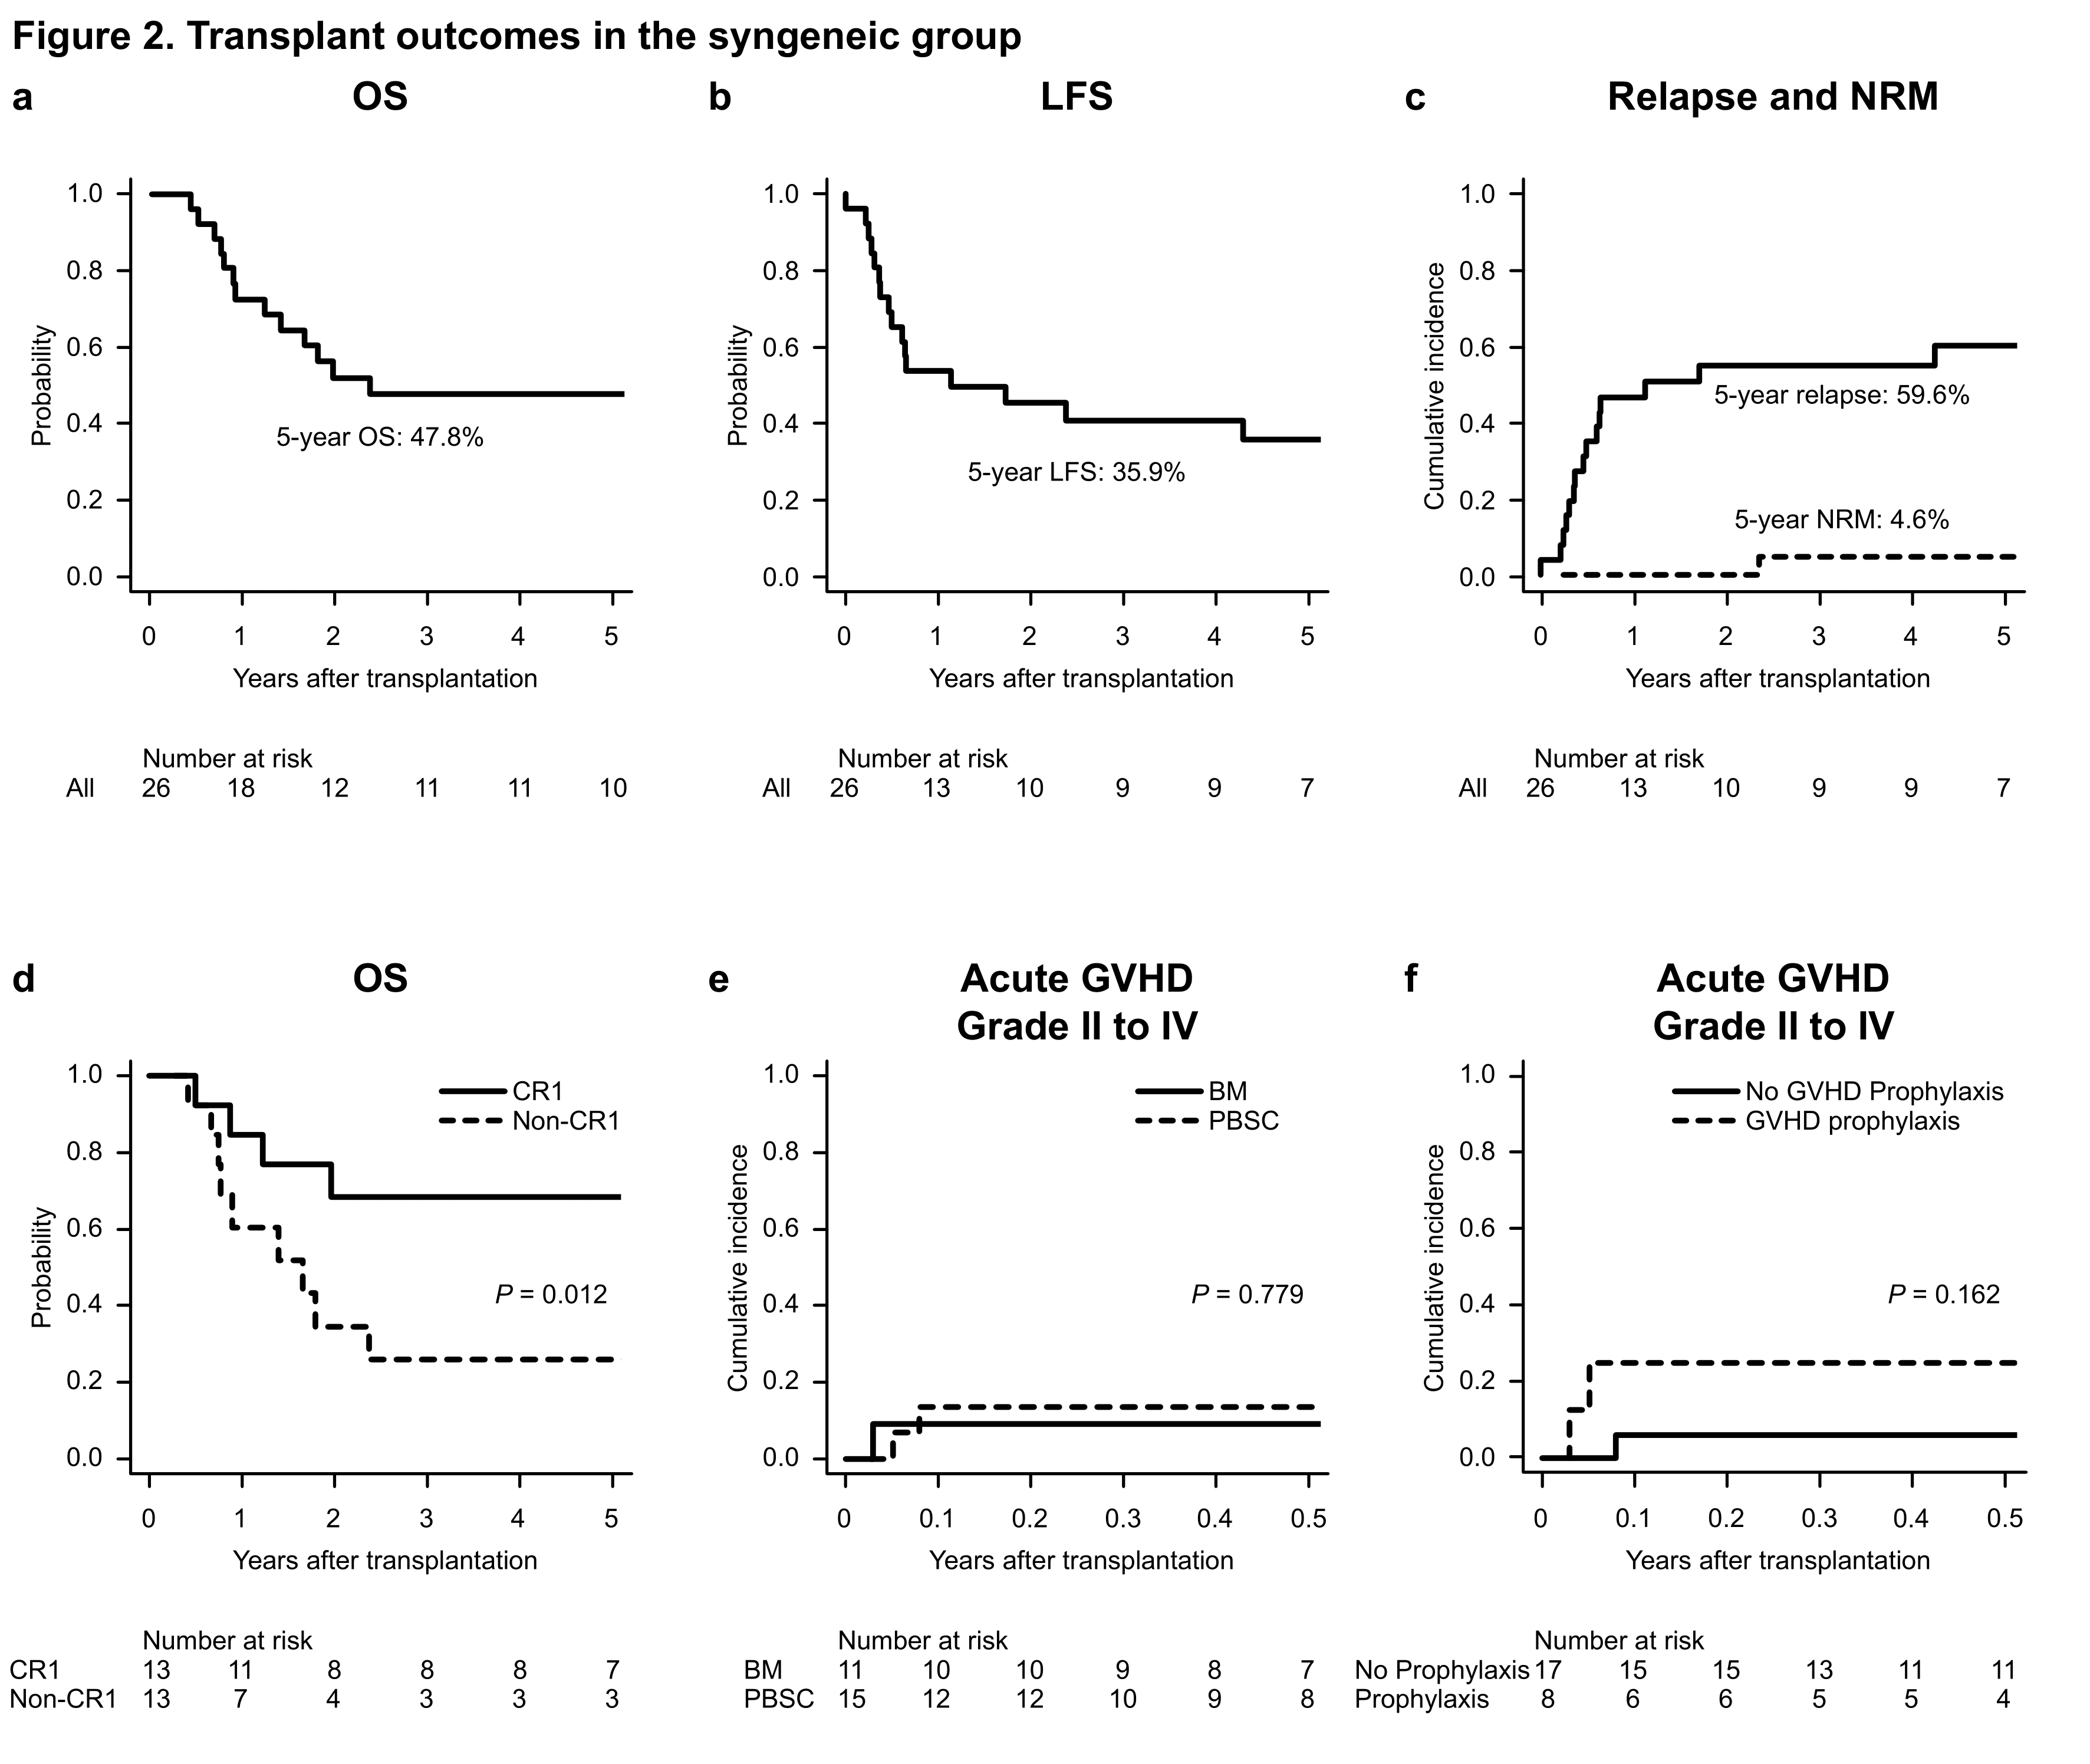
Overall, 26 patients were included in the Syn group. Among them, 13 (50.0%) patients were in CR1. Graft source was BM for 11 (42.3%) patients and PBSC for 15 (57.7%). Eight (30.8%) patients received GVHD prophylaxis, whereas 17 (65.4%) did not receive any GVHD prophylaxis with available data (n = 25 of 26, 96.2%). The median follow-up period for survivors was 3,644 days (range, 315–9,335 days).
The 5-year OS and LFS rates and cumulative incidence rates of relapse and NRM were 47.8% (95% confidence interval [CI], 27.5–65.7%; Figure 2a), 35.9% (95% CI, 17.6–54.6%; Figure 2b), 59.6% (95% CI, 36.7–76.5%; Figure 2c), and 4.6% (95% CI, 0.3–19.9%; Figure 2c), respectively. The 5-year OS rate was significantly higher in patients in CR1 (68.4%; 95% CI, 35.9–86.8%) than that in patients in non-CR1 (26.0%; 95% CI, 6.3–51.7%; P = 0.012; Figure 2d). No significant differences in OS rates were observed after stratifying patients according to age (P = 0.404), sex (P = 0.250), cytogenetic risk (P = 0.175), graft source (P = 0.489), or the year of HSCT (P = 0.404).
The 100-day cumulative incidence rate of grade II acute GVHD was 11.5% (95% CI, 2.8–27.1%). No patient developed grade III–IV acute GVHD. There was no significant difference after stratifying by graft source (BM, 9.1% [95% CI, 0.4–34.7%] vs. PBSC, 13.3% [95% CI, 2.0–35.5%]; P = 0.779; Figure 2e) or GVHD prophylaxis (with prophylaxis, 25.0% [95% CI, 3.0–57.9%] vs. without prophylaxis, 5.9% [95% CI, 0.3–24.3%]; P = 0.162; Figure 2f). Acute GVHD occurred in 1 of 11 (9.1%) patients receiving syngeneic PBSCT without GVHD prophylaxis.
Regarding comparison cohorts, 476, 1,755, and 1,222 patients in CR1 met the inclusion criteria in the Auto, MSD, and MUD groups, respectively. Of these, 39 patients per group and 13 patients in the Syn group were selected after PS matching.
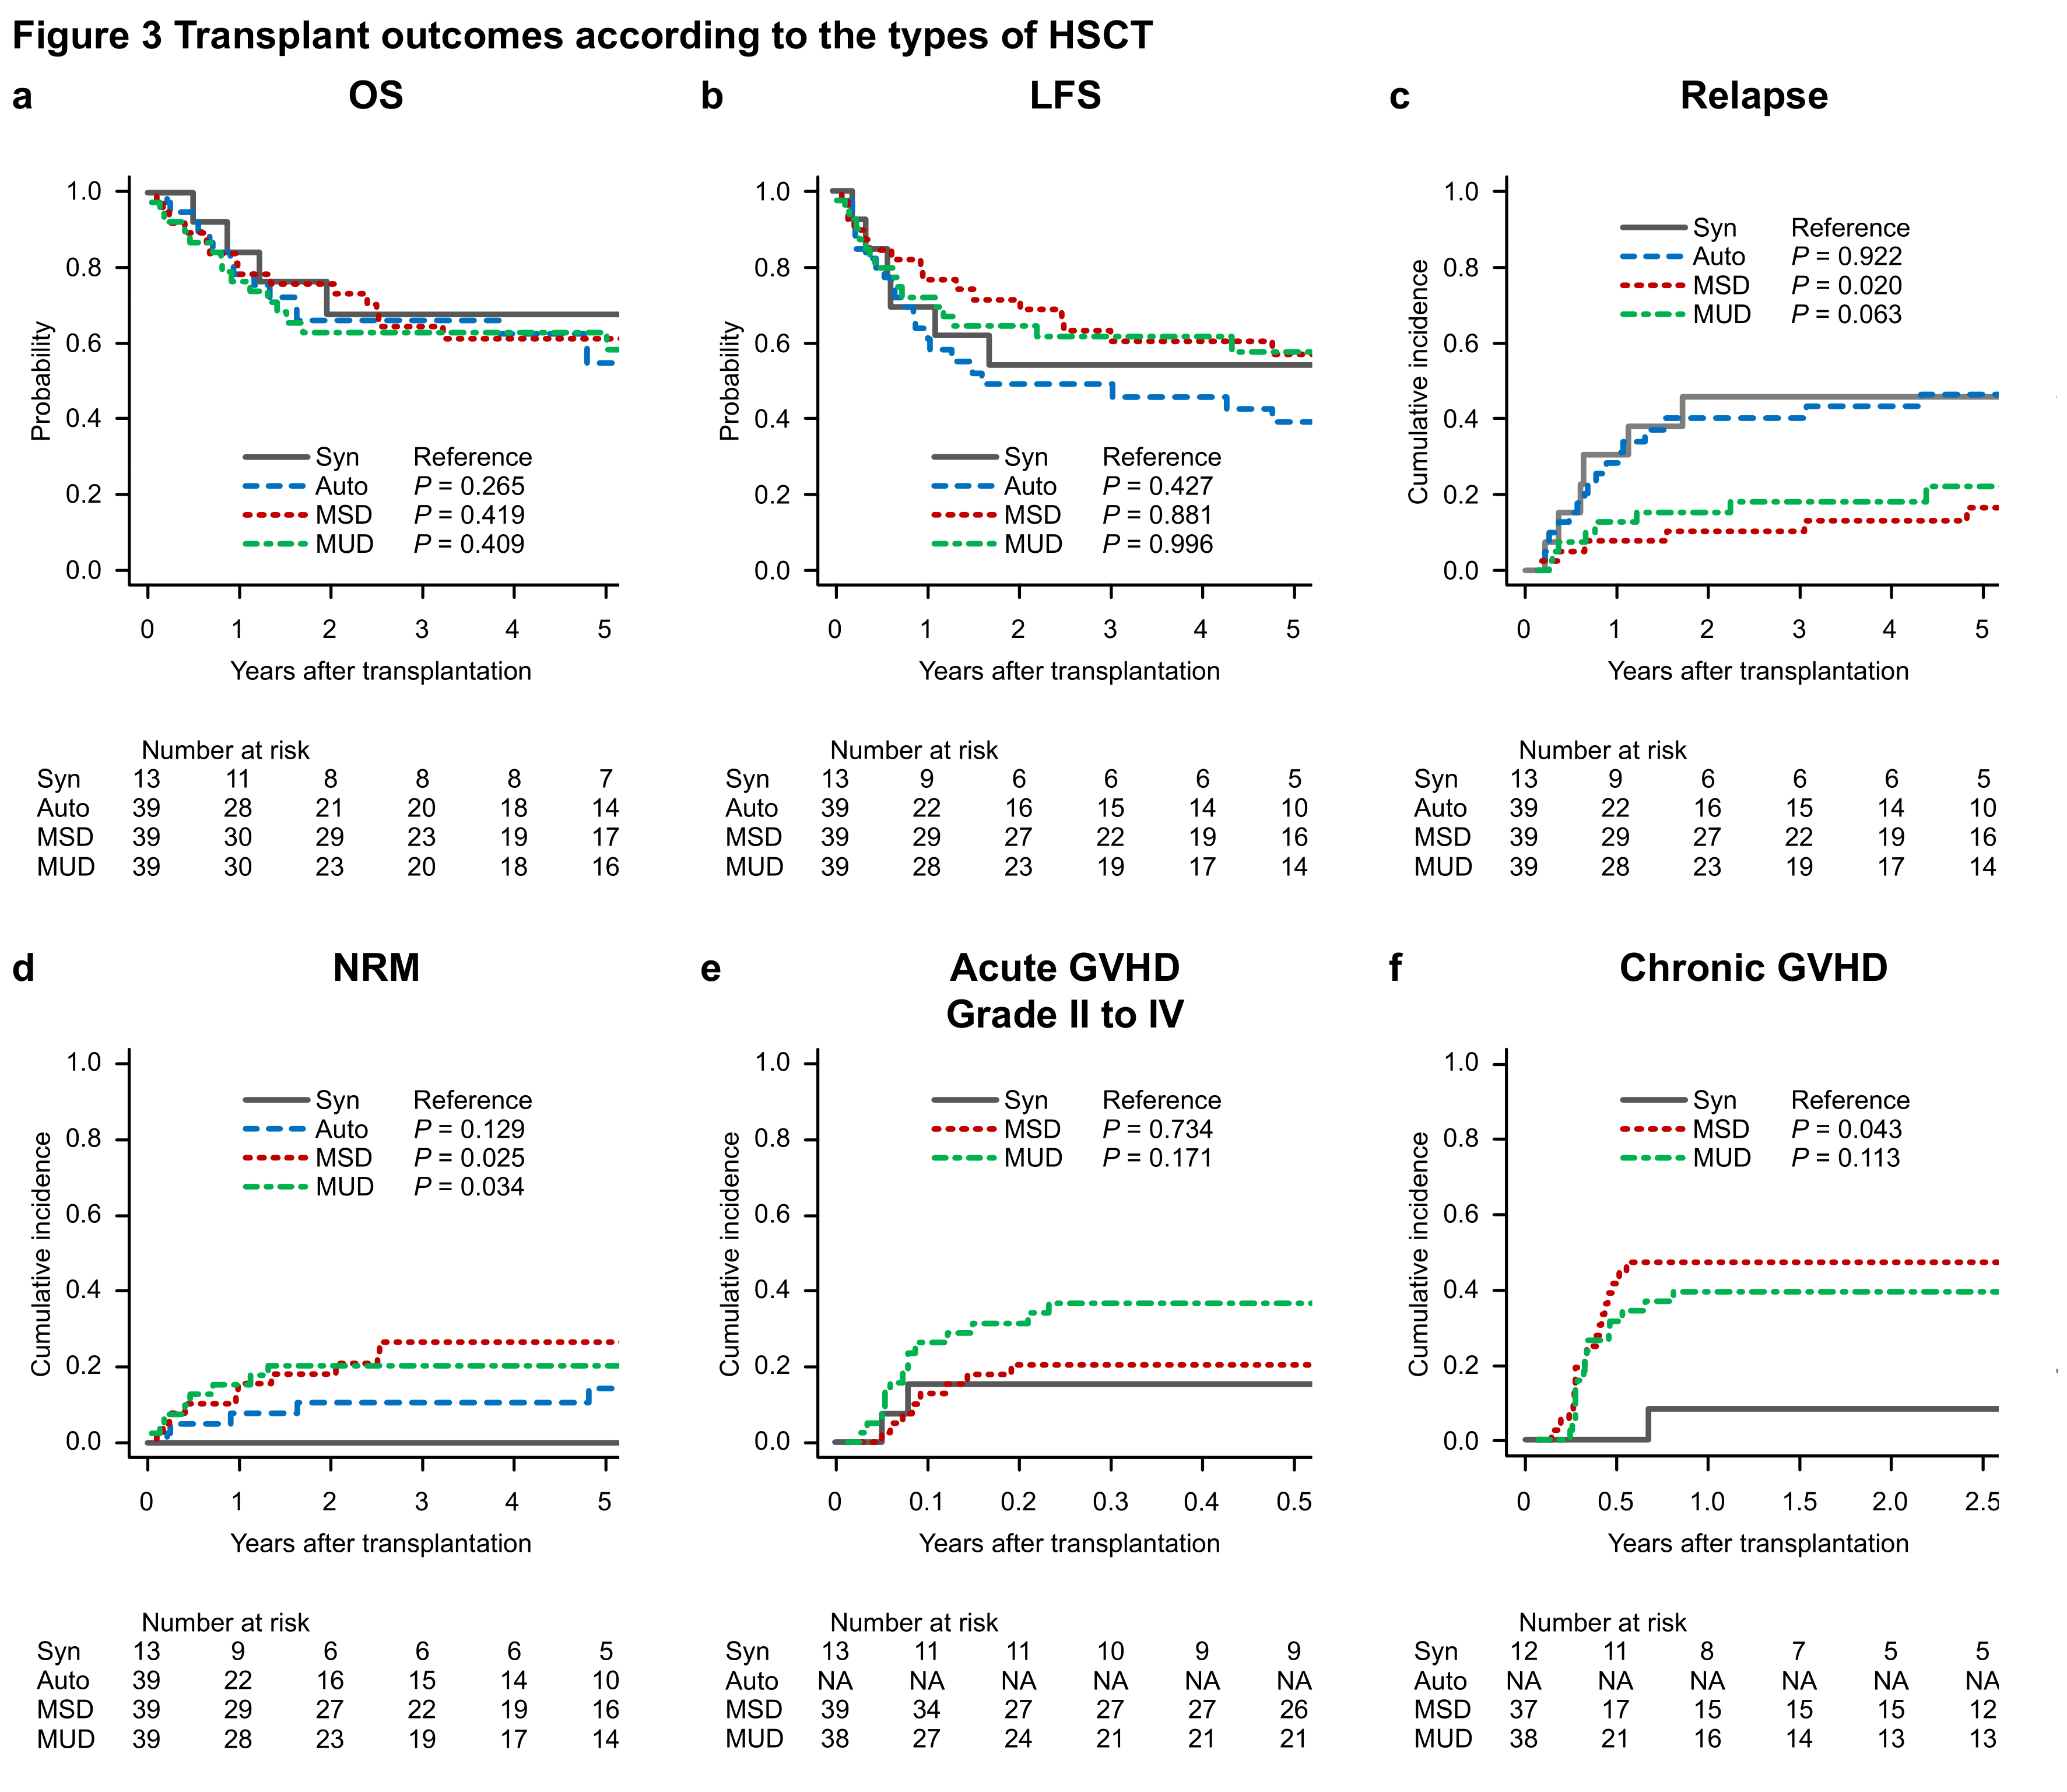
Transplant outcomes per donor group are shown in Figure 3. The 5-year OS rates after HSCT were 68.4% (95% CI, 35.9–86.8%; reference) in the Syn group, 55.9% (95% CI, 37.2–71.0%; P = 0.265) in the Auto group, 62.4% (95% CI, 44.8–75.8%; P = 0.419) in the MSD group, and 63.7% (95% CI, 46.5–76.7%; P = 0.409) in the MUD group (Figure 3a). The 5-year LFS rates after HSCT were 53.8% (95% CI, 24.8–76.0%; reference) in the Syn group, 38.6% (95% CI, 22.6–54.5%; P = 0.427) in the Auto group, 56.6% (95% CI, 39.0–70.9%; P = 0.881) in the MSD group, and 57.1% (95% CI, 39.4–71.5%; P = 0.996) in the MUD group (Figure 3b).
The 5-year cumulative incidence rate of relapse in the Syn group (46.2%; 95% CI, 17.8–70.7%; reference) was significantly higher than that in the MSD group (16.7%; 95% CI, 6.6–30.9%; P = 0.020), was higher than that in the MUD group (22.2%; 95% CI, 10.0–37.5%; P = 0.063) groups but not statistically significant, and was comparable to that in the Auto (46.9%; 95% CI, 29.5–62.5%; P = 0.922) group (Figure 3c). The 5-year cumulative incidence rate of NRM in the Syn group (0.0%; 95% CI, 0.0–0.0%; reference) was significantly lower than those in the MSD (26.7%; 95% CI, 13.7–41.6%; P = 0.025) and MUD (20.6%; 95% CI, 9.5–34.6%; P = 0.034) groups but not significantly different from that in the Auto group (14.4%; 95% CI, 5.0–28.6%; P = 0.129) (Figure 3d).
The 100-day cumulative incidence rates of grade II–IV acute GVHD were 15.4% (95% CI, 2.2–39.8%; reference) in the Syn group, 20.6% (95% CI, 9.5–34.6%; P = 0.734) in the MSD group, and 36.8% (95% CI, 21.7–52.0%; P = 0.171) in the MUD group (Figure 3e). The 1-year cumulative incidence rate of chronic GVHD in the Syn group (8.3%; 95% CI, 0.4–32.8%; reference) was significantly lower than that in the MSD group (47.2%; 95% CI, 30.1–62.6%; P = 0.043) but not significantly different from that in the MUD group (39.5%; 95% CI, 23.9–54.7%; P = 0.113) (Figure 3f).
In conclusion, this is the first study to assess prognostic factors in patients with AML after syngeneic HSCT and compare the outcomes of syngeneic HSCT with those of autologous or allogeneic HSCT for patients in CR1. Our findings suggest that syngeneic HSCT might offer an alternative curative option for AML. Data from a larger number of patients and prospective studies are needed to clarify the role of syngeneic HSCT in the treatment of AML.

Follow the Topic
-
Blood Cancer Journal
This journal seeks to publish articles of the highest quality related to hematologic malignancies and related disorders.

Please sign in or register for FREE
If you are a registered user on Research Communities by Springer Nature, please sign in