Shielding the Tumor: PMN-MDSCs as Key Drivers of Immune Suppression in Waldenstrom Macroglobulinemia
Published in Cancer, General & Internal Medicine, and Immunology
The rationale of the current study:
Waldenstrom macroglobulinemia (WM) is a rare hematologic malignancy marked by the accumulation of lymphoplasmacytic lymphoma cells in the bone marrow (BM) and excessive production of immunoglobulin M (IgM) antibodies (1). While some patients are asymptomatic or exhibit a "smoldering" form (SMW) at diagnosis, others develop symptoms due to high IgM levels and the infiltration of lymphoplasmacytic cells in the BM, lymph nodes, and spleen (symptomatic WM). Genetic research has identified mutations in MYD88 (found in 86-97% of cases) and CXCR4 (in 24-40% of cases) as common in WM (2, 3). Although genetic studies have deepened our understanding of WM, the mechanisms driving tumor initiation and progression remain only partially elucidated.
Over the past decade, the tumor microenvironment (TME) has gained attention for its role in promoting tumor growth and survival. The TME is a complex ecosystem composed of cancer cells, cancer-associated fibroblasts (CAFs), tumor-associated macrophages (TAMs), immune cells including T cells, B cells, and natural killer (NK) cells, as well as endothelial cells, pericytes, and other stromal cells (4). It also encompasses myeloid-derived suppressor cells (MDSCs), which play a critical role in modulating immune responses (5). Under normal conditions, healthy individuals maintain low levels of MDSCs, which play key roles in regulating immune responses and tissue repair. In humans, MDSCs are classified into two subsets: monocytic MDSCs (M-MDSCs), characterized by a CD11b+ HLA-DRlow CD14+ CD15- phenotype, and polymorphonuclear MDSCs (PMN-MDSCs), identified by a CD11b+ HLA-DRlow CD14- CD15+/CD66b+ phenotype. MDSCs have been implicated in promoting tumor progression and immune suppression across various cancers, including hematological malignancies (6). In this study, we observed an increased presence of MDSCs in the immunosuppressive microenvironment of WM. To explore the interactions between MDSCs, T-cells, and malignant lymphoplasmacytic cells (CD19+ CD138+), we utilized single-cell genomic technologies combined with functional assays to define the gene signature of MDSCs in WM and identify the specific MDSC subset responsible for T-cell inhibition
Key Findings:
PMN-MDSCs are expanded in WM patients and is associated with poor prognostic factors
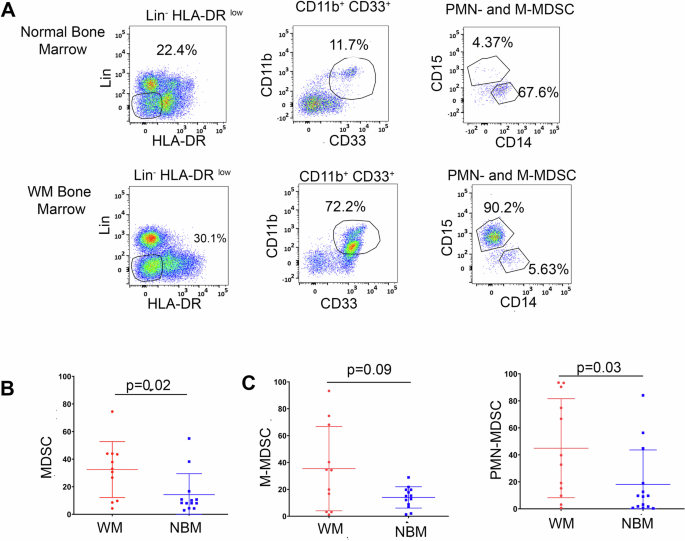
Our study reveals that the BM of symptomatic WM patients exhibits an expansion of PMN-MDSCs (Figure 1 A and B), which play a critical role in fostering an immunosuppressive microenvironment. We show that PMN-MDSC levels increase with disease progression and are linked to poor prognostic factors, including shorter time to next treatment (Figure 1C). Flow cytometry and CyTOF analysis confirm a significant expansion of PMN-MDSCs in the BM of WM patients. However, the specific impact of MDSCs on immune suppression and tumor progression in WM has not been previously explored. Our findings establish the dominant presence of CD66b+ PMN-MDSCs in the BM of WM patients (Figure 1D).
CD66b+ PMN-MDSC-Mediated T-Cell Suppression Impairs TNFα and IFN-γ Production and expands with G-CSF and TNF-α"
Our findings underscore the immunosuppressive role of CD66b+ PMN-MDSCs in inhibiting CD4+ and CD8+ T-cell function (Figure 1E), leading to reduced T-cell proliferation and diminished secretion of IFNγ (Figure 1F), and TNFα (Figure 1G). We show that CD66b+ PMN-MDSCs isolated from the bone marrow of WM patients suppress T-cell activity, with this effect being more pronounced than that observed with M-MDSCs. This is consistent with studies indicating that PMN-MDSCs from late-stage cancer patients are more immunosuppressive than M-MDSCs (7). We also show that G-CSF and TNF-α facilitates MDSCs expansion and accumulation in WM patients (Figure 1H).
MDSCs exhibited upregulated inflammation and metabolic signatures:
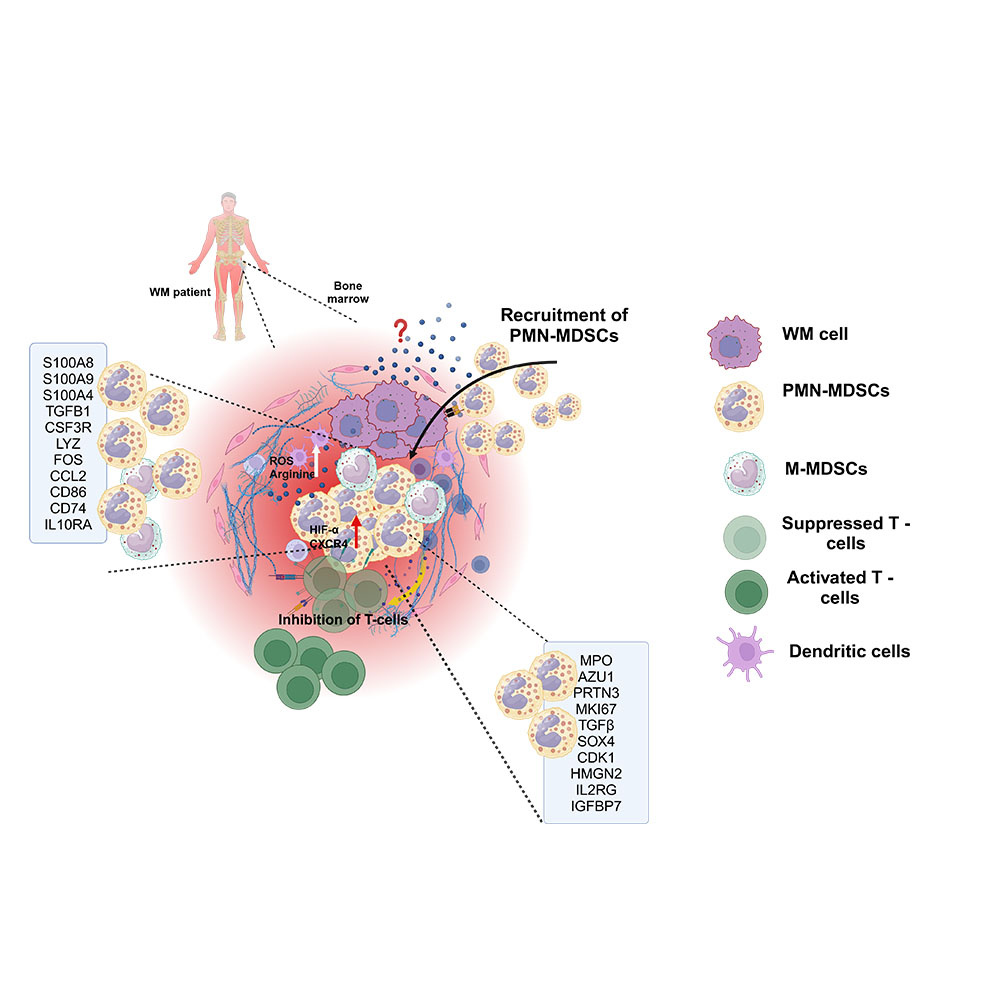
The observed changes in MDSC subsets in WM patients result from an overall expansion of the MDSC population, characterized by a distinct gene signature, including S100A8, S100A9, S100A4, TGFB1, CSF3R, LYZ, FOS, and CCL2 (Figure 2B and C). These expanded MDSCs exhibit heightened expression of immune regulatory genes such as CD86, HIF1-α, IL13RA1, IL10RA, TGFBI, and CD74 (Figure 2C), underscoring their critical role in establishing an immune-suppressive TME niche. Notably, PCR analysis confirmed elevated HIF-1α expression in WM MDSCs compared to normal bone marrow (NBM) controls, validating the findings from CITE-seq (Figure 2E). The increase in HIF-1α suggests that hypoxic conditions within the WM BM microenvironment may drive its expression in MDSCs, thereby contributing to their suppressive phenotype.
PMN- MDSCs exhibit distinct immune signature associated with poor outcome.
Our findings identify IL2RG, FOXM1, PRTN3, SOX4, IGFBP7, and CXCR4 as hallmark genes specific to CD66b+ PMN-MDSCs, highlighting their distinct role within the TME. This subset exhibits enhanced pro-tumor signaling and more pronounced immunosuppressive features compared to other MDSC populations in the bone marrow. Elevated expression of MPO, AZU1, ELANE, and LDHB in these cells suggests increased myelopoiesis, heightened cell proliferation, and an association with poorer clinical outcomes (Figure 2D). Additionally, CD66b+ PMN-MDSCs express higher levels of cell cycle regulators such as CDK1, CENPF, PLK1, MKI67, and HMGN2, consistent with their enhanced proliferative capacity. Upregulated pathways related to DNA damage response, apoptosis, MAPK signaling, TGFβ signaling, and myeloid differentiation further underscore their functional specificity. qPCR validation of CXCR4, MPO, and AZU1 expression in PMN-MDSCs compared to M-MDSCs in WM patients (Figure 2F) corroborates the CITE-seq findings, confirming the profoundly immunosuppressive properties of PMN-MDSCs.
Lymphoplasmacytic cells of WM patients recruit PMN-MDSCs in the bone marrow.
WM cells (BCWM.1 and MWCL-1) preferentially attract PMN-MDSCs over M-MDSCs to the tumor site. The attraction was significantly stronger in the presence of intact WM cells compared to their supernatants, highlighting the pivotal role of direct cell interactions in recruiting PMN-MDSCs to the TME (Figure 3D and E).
Take home message
Our study highlights the expansion of PMN-MDSCs in the TME of WM patients, actively recruited by WM cells to create an immunosuppressive BM microenvironment by directly inhibiting T cells. A distinct immune-suppressive gene signature of WM MDSCs is characterized by upregulated inflammatory pathways linked to INF and TNF signaling. These inflammatory and immune-suppressive signatures were predominantly enriched in PMN-MDSCs. We also demonstrated that WM PMN-MDSCs suppress T-cell function and their viability. Furthermore, the presence of G-CSF and TNF in the WM BM supports the expansion of PMN-MDSCs. Targeting PMN-MDSCs may therefore represent a promising therapeutic strategy for WM (Figure 3F).
References
- Gertz MA. Waldenström macroglobulinemia: 2021 update on diagnosis, risk stratification, and management. Am J Hematol. 2021;96(2):258-69.
- Treon SP, Xu L, Guerrera ML, Jimenez C, Hunter ZR, Liu X, et al. Genomic Landscape of Waldenström Macroglobulinemia and Its Impact on Treatment Strategies. J Clin Oncol. 2020;38(11):1198-208.
- Treon SP, Xu L, Yang G, Zhou Y, Liu X, Cao Y, et al. MYD88 L265P somatic mutation in Waldenström's macroglobulinemia. N Engl J Med. 2012;367(9):826-33.
- de Visser KE, Joyce JA. The evolving tumor microenvironment: From cancer initiation to metastatic outgrowth. Cancer Cell. 2023;41(3):374-403.
- Gabrilovich DI, Nagaraj S. Myeloid-derived suppressor cells as regulators of the immune system. Nature Reviews Immunology. 2009;9(3):162-74.
- Bhardwaj V, Ansell SM. Modulation of T-cell function by myeloid-derived suppressor cells in hematological malignancies. Front Cell Dev Biol. 2023;11:1129343.
- Patel S, Fu S, Mastio J, Dominguez GA, Purohit A, Kossenkov A, et al. Unique pattern of neutrophil migration and function during tumor progression. Nat Immunol. 2018;19(11):1236-47.

Figure 1: Expansion of PMN-MDSCs and increased T-cell suppression in WM patients. (A) Statistical analysis of total MDSCs in WM and NBM. (B) Statistical analysis of PMN-MDSCs in NBM and WM. (C) Comparison of overall time to next treatment (TTNT) in WM patients with high and low CD66b+ cells in the bone marrow [7 months (95% CI: 2.3 – 49 months) compared to 40 months (95% CI: 4.3 – 140 months) p=0.01]. (D) t-SNE plots showing the expression of three subsets of MDSCs in NBM, Smoldering, Symptomatic, and Remission, namely CD66b, CD68, and CD11c. (E) The representative plot shows the suppressive effect of PMN-MDSCs when cultured with T-cells from healthy donors (1:1 ratio for 24 h). CD69 expression was calculated as the mean MFI which is shown on the bar graph. (F) Representative plots for INF-γ suppression on CD4 T-cells by PMN-MDSCs (G) Representative plots showing the TNF-α cytokine expression in T-cells with the PMN-MDSCs and M-MDSCs coculture. (H) Representation plots showing PMN-MDSCs expansion in 48h of G-CSF and TNF culture with MDSCs from WM bone marrow

Figure 2: Transcriptomic profile of MDSCs (A). UMAP plot visualization of intratumoral bone marrow and MDSCs detected in NBM and WM. (B) Heatmap showing a relative expression of marker genes of each cluster. Cluster 2,3 and 9 represents MDSCs cells. (C) Volcano plot of CITE-seq transcriptome data displaying the gene expression pattern for MDSCs in NBM and WM. Significant differentially expressed genes in WM vs NBM MDSCs. The highly upregulated and downregulated genes are shown in red and blue respectively. (D) Volcano plot of the transcriptome profile displaying the pattern of differentially expressed genes in PMN vs M-MDSCs. Significantly expressed genes are shown in the plot, where red and blue represents upregulated and downregulated genes respectively. (E) qPCR analysis of H1F-α expression in WM vs NBM (F) qPCR analysis of MPO, AZU1 and CXCR4 expression in PMN-MDSCs vs M-MDSCs.

Figure 3: PMN-MDSCs are attracted to malignant B-cells at the tumor site (A) Trans well assay showing migration of MDSCs in the presence of BCWM.1 and MWCL-1 cells. (B) Trans well assay showing high migration of PMN-MDSCs in the presence of BCWM.1 cells and MWCL-1. (C) A graphical representation of the TME in WM, highlighting the interaction of MDSCs with other TME components and their associated gene signatures.
Follow the Topic
-
Blood Cancer Journal
This journal seeks to publish articles of the highest quality related to hematologic malignancies and related disorders.

Please sign in or register for FREE
If you are a registered user on Research Communities by Springer Nature, please sign in