The hidden curve in the chemical breath of trees
Published in Earth & Environment



Walk through a forest on a warm day and you are surrounded by chemistry. Leaves are famous for taking carbon dioxide from the air, but they also return some carbon as volatile gases. Isoprene, monoterpenes and sesquiterpenes form part of this invisible “chemical breath”. Once airborne, they react with other compounds and contribute to surface ozone and fine particles. Those reactions can affect air quality, clouds and climate.
Another invisible flow meets this chemical breath: reactive nitrogen. Fertiliser use, livestock production and fossil-fuel combustion release nitrogen compounds that later return to land through rain, particles and gases. A moderate supply can nourish plants. Too much can acidify soils, disrupt nutrient balances and create stress.
Scientists understand many effects of nitrogen on plant growth and carbon storage. Its influence on volatile emissions is less certain. This matters because natural-emission models include sunlight, temperature, vegetation and season, but usually not nitrogen deposition as an explicit control.
The contradiction that changed our question
The published evidence did not offer a tidy answer. Some experiments found increases, while others reported little change or a decrease. Species, season and experimental design could explain some variation. Yet one difference stood out: the studies used very different nitrogen doses.
That observation changed the question. Instead of asking whether nitrogen raises or lowers emissions, we asked how the response changes across a dose gradient. Perhaps the studies were not truly in conflict. They might simply show different sections of the same curve.
Building one picture from 36 studies
No single experiment covered the full range, so we combined 36 studies: 885 treatment-control comparisons, 24 species and nine broad plant categories. We put each comparison on a common scale and used models that accounted for observations from the same study.
Across the dataset, nitrogen addition was associated with average increases of 52% for isoprene, 39% for monoterpenes and 107% for sesquiterpenes. The sesquiterpene estimate varied widely, so the large average needs caution. More importantly, these averages hid the pattern that had brought the studies together.
A curve, not an on-off switch
When we placed nitrogen-addition rates on a continuous axis, a curved response emerged. Emissions generally rose at low to moderate additions, reached fitted peaks, and then declined as nitrogen loading increased. Depending on the compound, the estimated peaks occurred between about 49 and 118 kilograms of nitrogen per hectare per year.
Moderate nitrogen can support chlorophyll production and photosynthesis, increasing the carbon and energy available for volatile compounds. At high loading, plants may redirect carbon towards growth or experience stress. These explanations are plausible, but our analysis does not prove them.
The curve is not a universal rule for every plant. Responses differed among plant categories and seasons, and the evidence was uneven. Because the isoprene relationship was better constrained than those for monoterpenes and sesquiterpenes, we used it for the regional analysis.
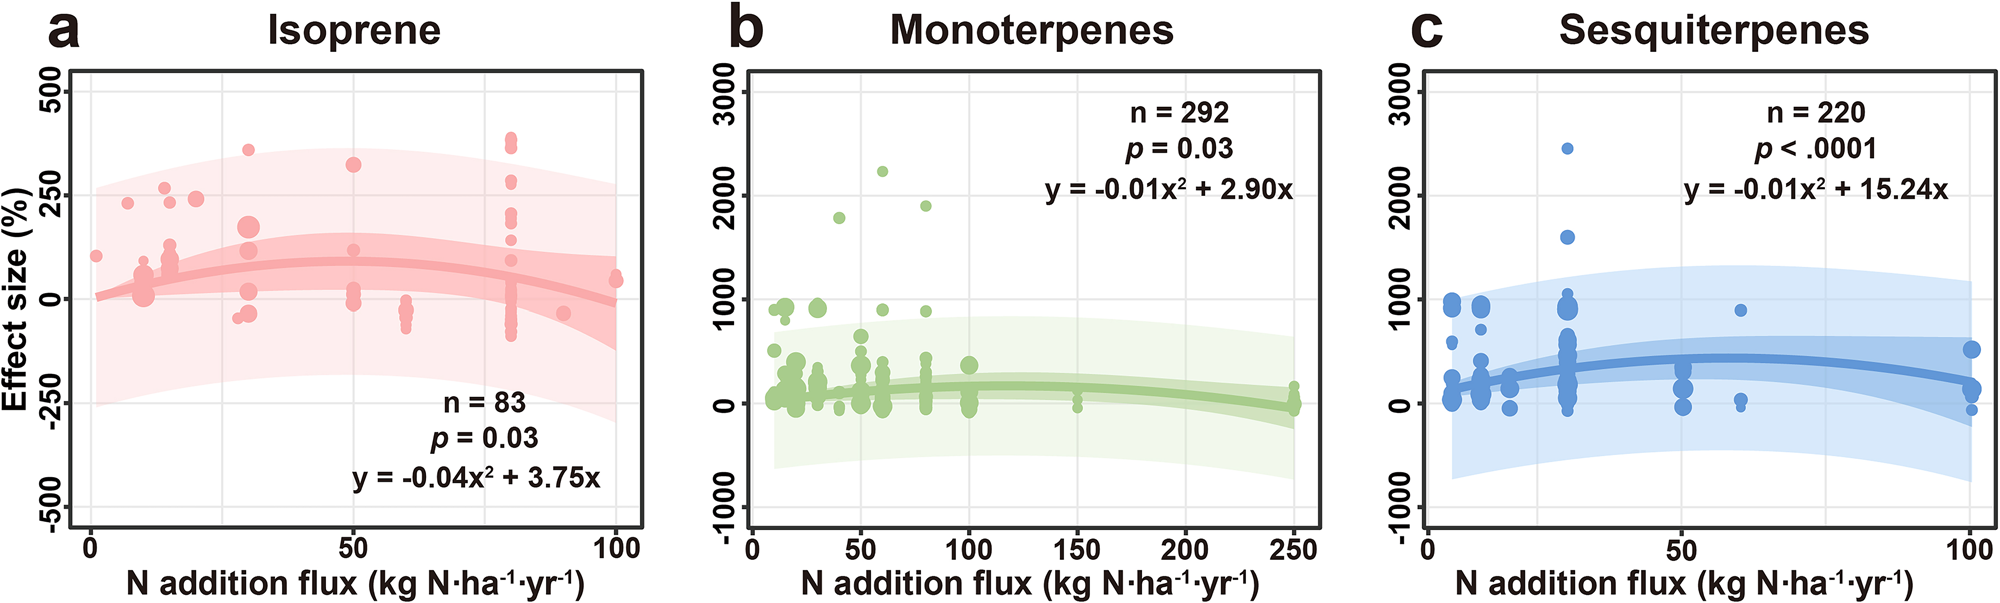 Figure 1 | The hidden dose-response curve. Each point represents a published treatment-control comparison. The fitted curves rise at low to moderate nitrogen additions, then weaken or decline at higher additions. Shading shows uncertainty. Reproduced without modification from Fig. 2 of the published article.
From an experimental curve to a changing map
We next combined the isoprene curve with observed and reconstructed nitrogen-deposition changes from 1980 to 2020. This calculation does not reproduce the exact isoprene released by every ecosystem. It estimates the relative change in emission potential associated with changing nitrogen deposition.
The directions differed among regions. During periods of rising nitrogen deposition, estimated isoprene emission potential increased by up to about 29% in tropical regions. China moved the other way. As deposition declined, its estimated isoprene emission potential fell by 3.1% from 2016 to 2020.
That contrast matters in a rapidly greening country. More leaves can raise capacity for plant emissions, while declining deposition pushes the physiological response the other way. Our results suggest that nitrogen controls may partly offset the greening-related increase, but not that the two effects cancel.
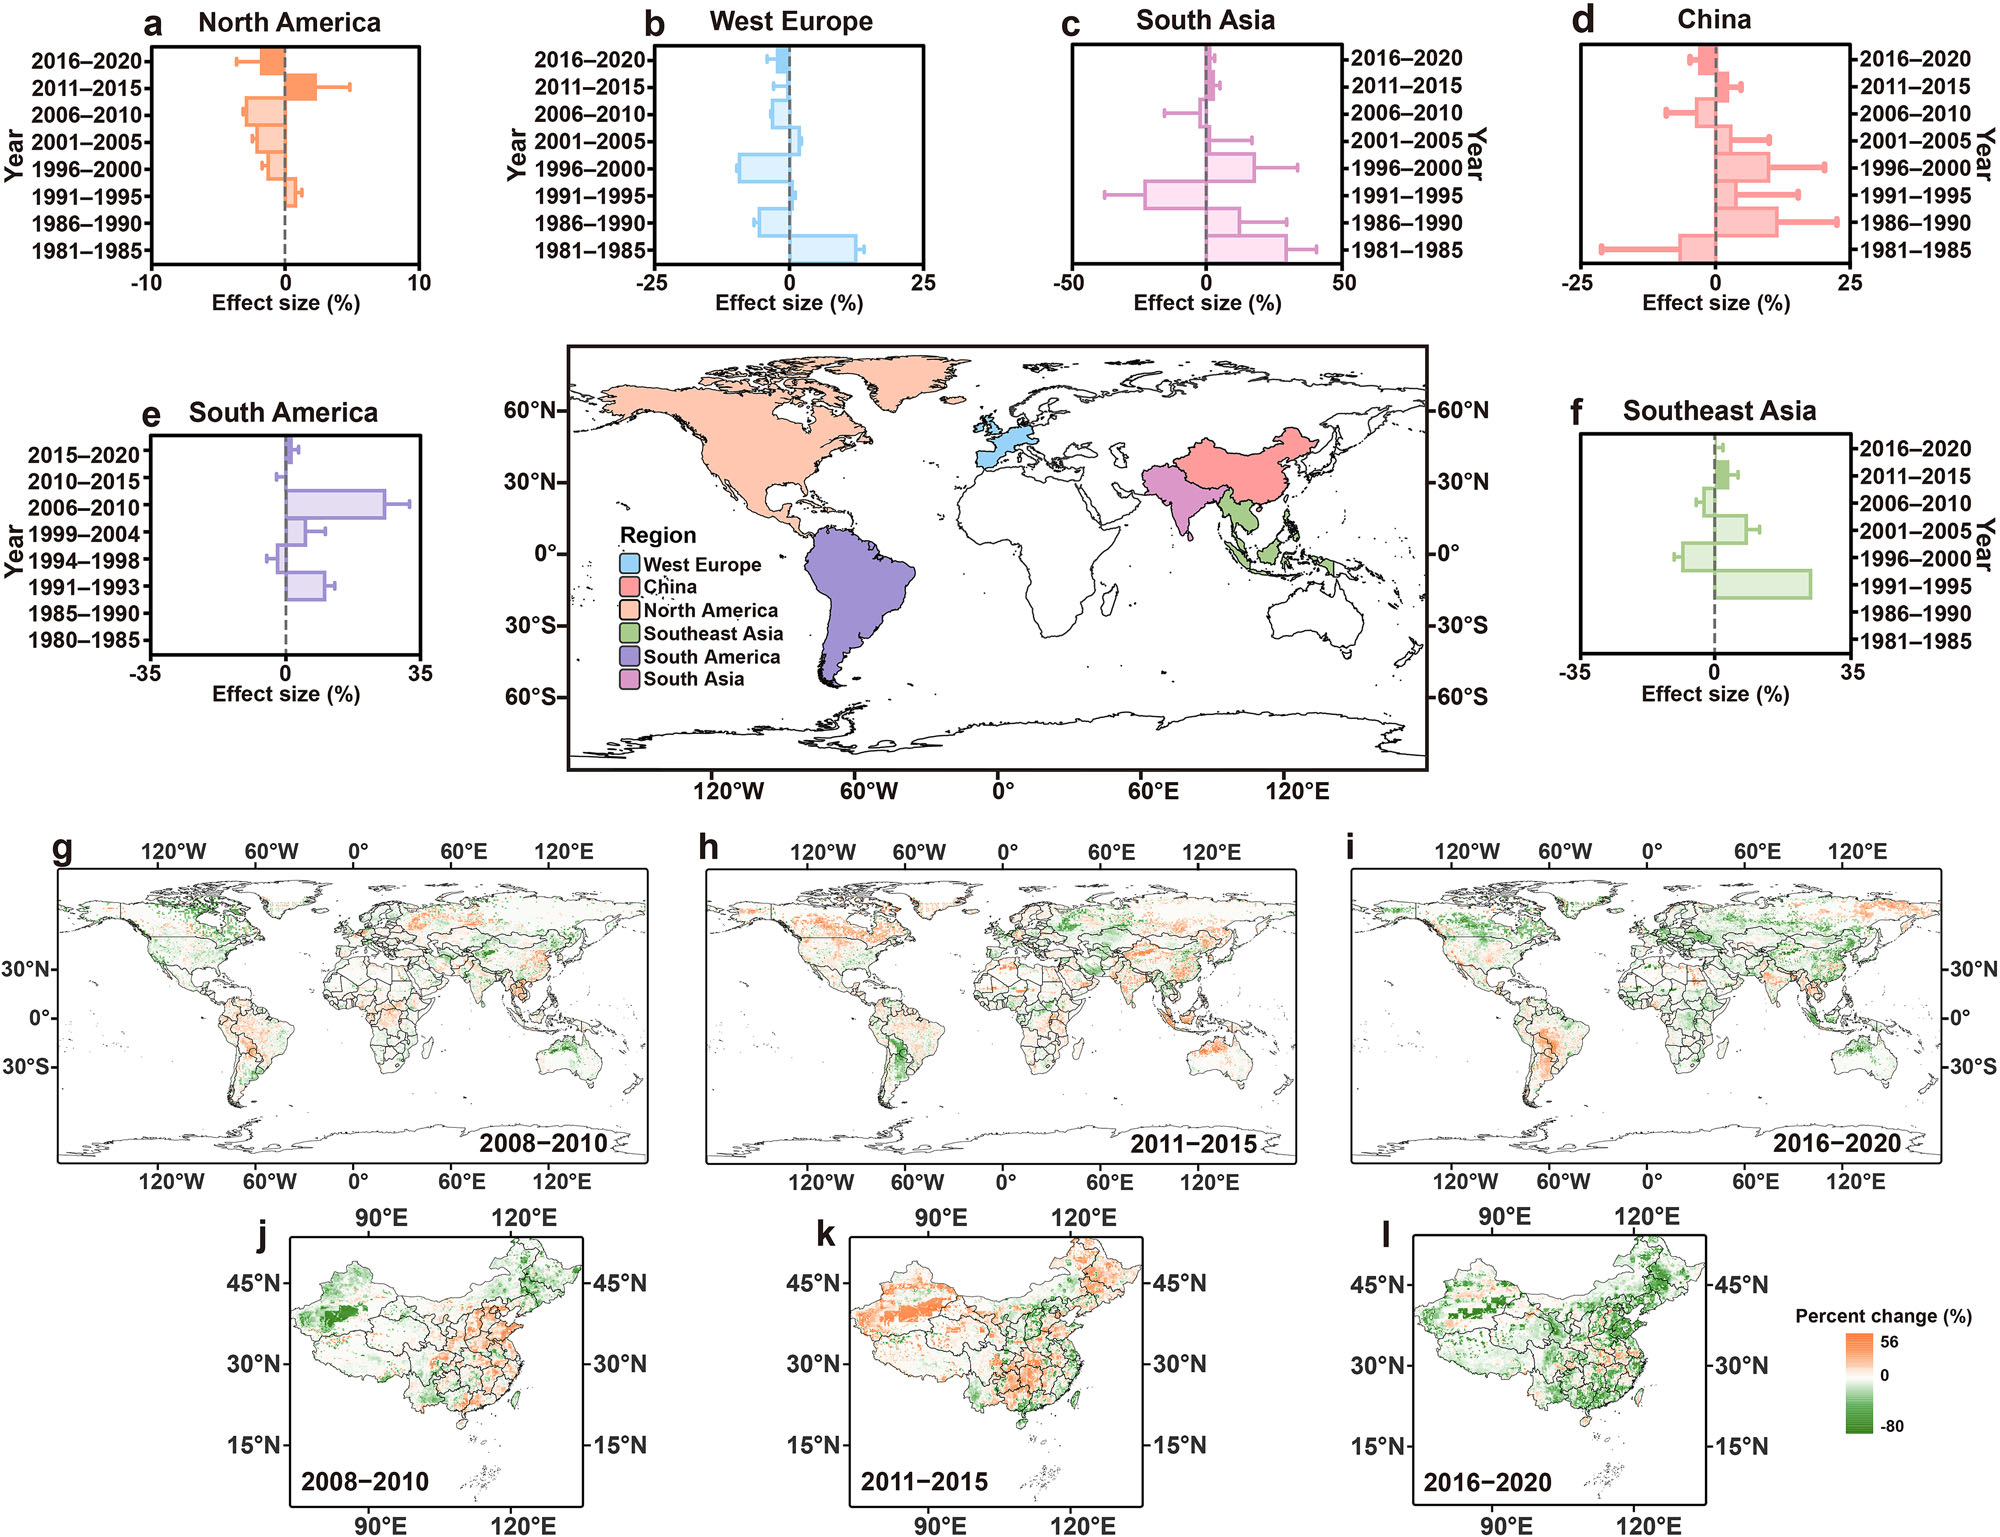 Figure 2 | One driver, different regional directions. Orange indicates increases and green indicates decreases in estimated isoprene emission potential associated with nitrogen-deposition changes. These are relative estimates, not absolute emission fluxes. Reproduced without modification from Fig. 3 of the published article.
Why this connection matters
Plant emissions are often treated as a fixed natural background, but that background moves with climate, vegetation and human activity. Adding a nitrogen-sensitive factor could help emission models represent one more part of that changing system.
The findings point to a possible air-quality co-benefit of nitrogen management. Lower deposition may reduce the plant-derived supply of compounds involved in ozone and particle formation. Atmospheric chemistry is complex, so fewer precursors do not guarantee the same outcome everywhere. Regional models must include weather, vegetation change and human emissions to quantify air-quality effects.
Like any global synthesis, ours inherits gaps in the available evidence. The dataset contains many tropical broadleaf evergreen trees, saplings and ammonium-nitrate treatments, but fewer observations for several other plant groups and nitrogen forms. The regional analysis estimates relative isoprene emission potential, not absolute emissions. It also does not fully resolve simultaneous changes in leaf area, temperature, sunlight, rainfall or land cover.
The most useful result was therefore not one percentage. It was recognising that disagreement can contain structure. Nitrogen is not an on-off switch for the chemical breath of plants; its influence depends on dose and context. Read the full study in Communications Earth & Environment.
Follow the Topic
-
Communications Earth & Environment
An open access journal from Nature Portfolio that publishes high-quality research, reviews and commentary in the Earth, environmental and planetary sciences.

Related Collections
With Collections, you can get published faster and increase your visibility.
Hazards in Mountain Regions
Publishing Model: Open Access
Deadline: Nov 02, 2026
Carbon Dioxide Removal
Publishing Model: Hybrid
Deadline: Jan 16, 2027