A 10-m map of ground-mounted photovoltaic power stations in China of 2020 has been released
Published in Electrical & Electronic Engineering and Computational Sciences
Photovoltaic (PV) power stations have been raised huge concerns in China recently (Fig. 1), due to the environmentally friendly way for energy utilization with few carbon emissions, showing a positive effect against global warming. According to statistics, the installed capacity of PV power in China was only 100 MW in 2007, but grew rapidly to 205,000 MW in 2019, with an average growth of 17,075 MW per year. It should be noted that China’s central government released the Carbon Peak and Carbon Neutrality strategy in 2020, which committed that China’s carbon emissions would reach the peak by 2030 and achieve carbon neutrality by 206. Therefore, it is predictable that PV power would play an increasingly essential role in the near future. The monitoring of PV power stations would be meaningful for both researchers and government officials.
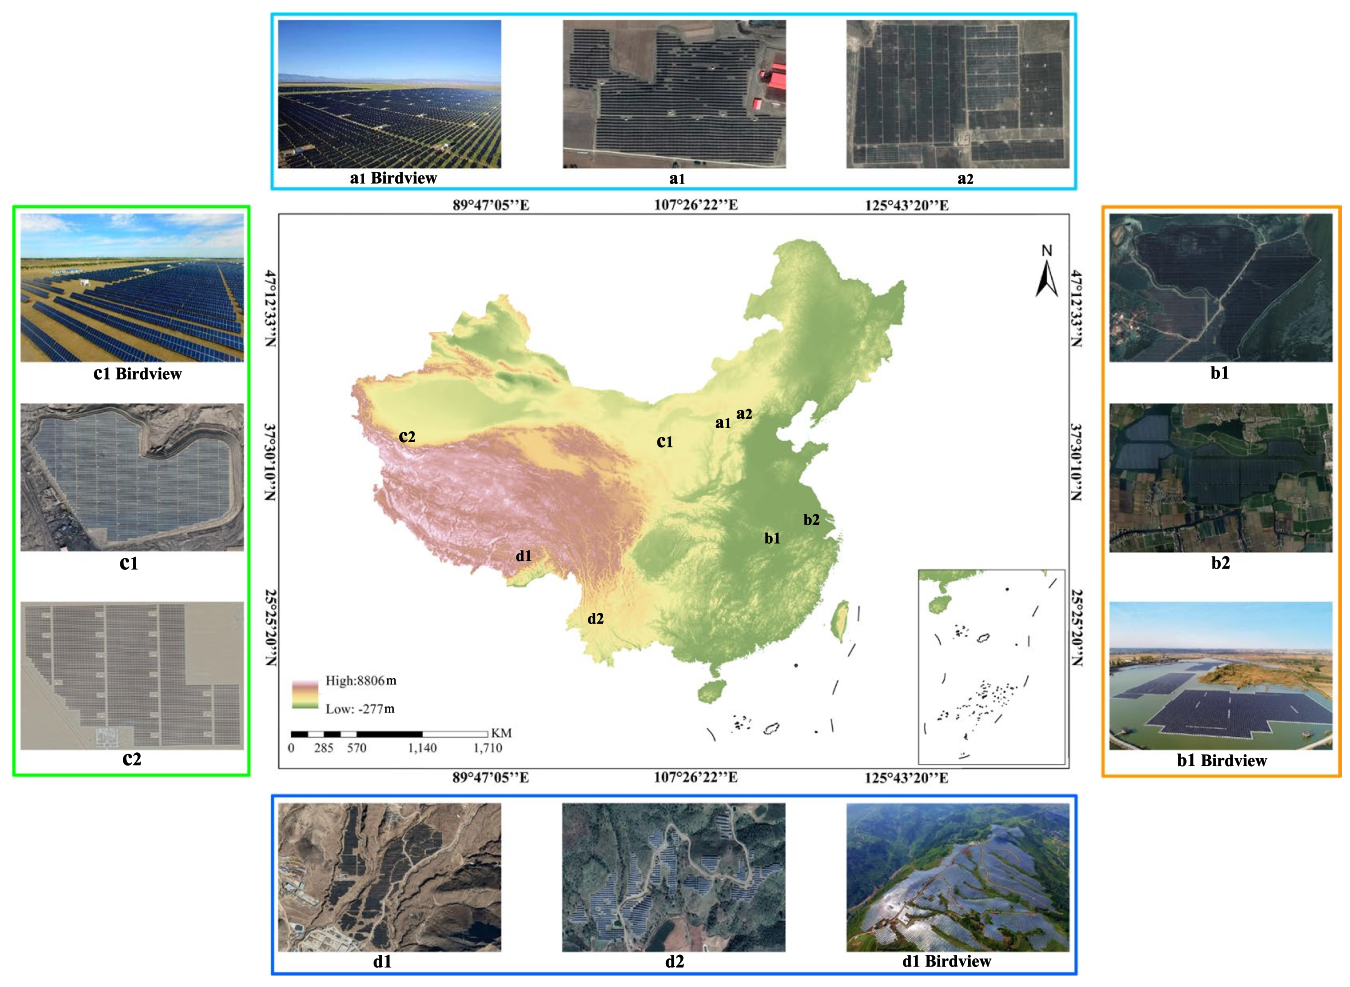
Fig. 1 Examples of PV power stations in China. The land used for PV power stations includes gobi (left), grassland (top), water bodies (right), mountain land (bottom), etc.
The objective of this study is to provide the first publicly released 10-m national map of ground-mounted PV power stations of China in 2020. Specifically, Sentinel-2 multi-spectral imagery was used as data sources, from which random forest (RF) classifier was utilized to predict these PV power stations via Google Earth Engine (GEE) cloud computing platform. Both partition modelling and active learning strategy were adopted to tackle the data unbalance problem in large-scale mapping. The released PV map of China would be of particular interest to the following research areas, including estimation and prediction of PV’s generating capacity, site selection for newly built PV power stations, land use and land change, energy policy. Besides, this dataset could also provide a large number of PV power station samples within China with high quality, which makes it possible to train a robust deep learning model in the near future.
During the PV dataset production, we adopt the partition methodology, where a series of RF classifiers have been built for each province of China to increase the model’s sensitivity to local samples. Afterwards, a multi-dimensional feature spacing could be constructed, which consists of spectral features, texture features and topographical features, aiming to increase the inter-class separability. Next, active learning is synthesized with RF classifier to perform a coarse-to-fine procedure for PV power station mapping. Finally, post-processing is adopted to remove the isolated noises while spatial statistics (i.e., zonal analysis) are performed for subsequent analysis. Technical validation has been carefully performed across China which achieved a satisfactory accuracy over 89%.
According to our research, China has a total of about 2468 km2 ground-mounted PV power stations in 2020. Fig. 2 illustrates that most of PV power stations lie in the northern part of China, especially in northwest and northeast China. Interestingly, a large number of PV power stations lie along the Great Wall (including the northern parts of Hebei, Shanxi, Shaanxi, Ningxia and Gansu Province) and the Silk Road (mainly refers to Gansu and Xinjiang Province). Meanwhile, in eastern China, PV power stations mainly locate in Anhui, Jiangsu, Shandong, Henan, Hubei and Jiangxi Province, while in southwestern China, Guizhou, Yunnan and Sichuan witnessed the most PV power stations.
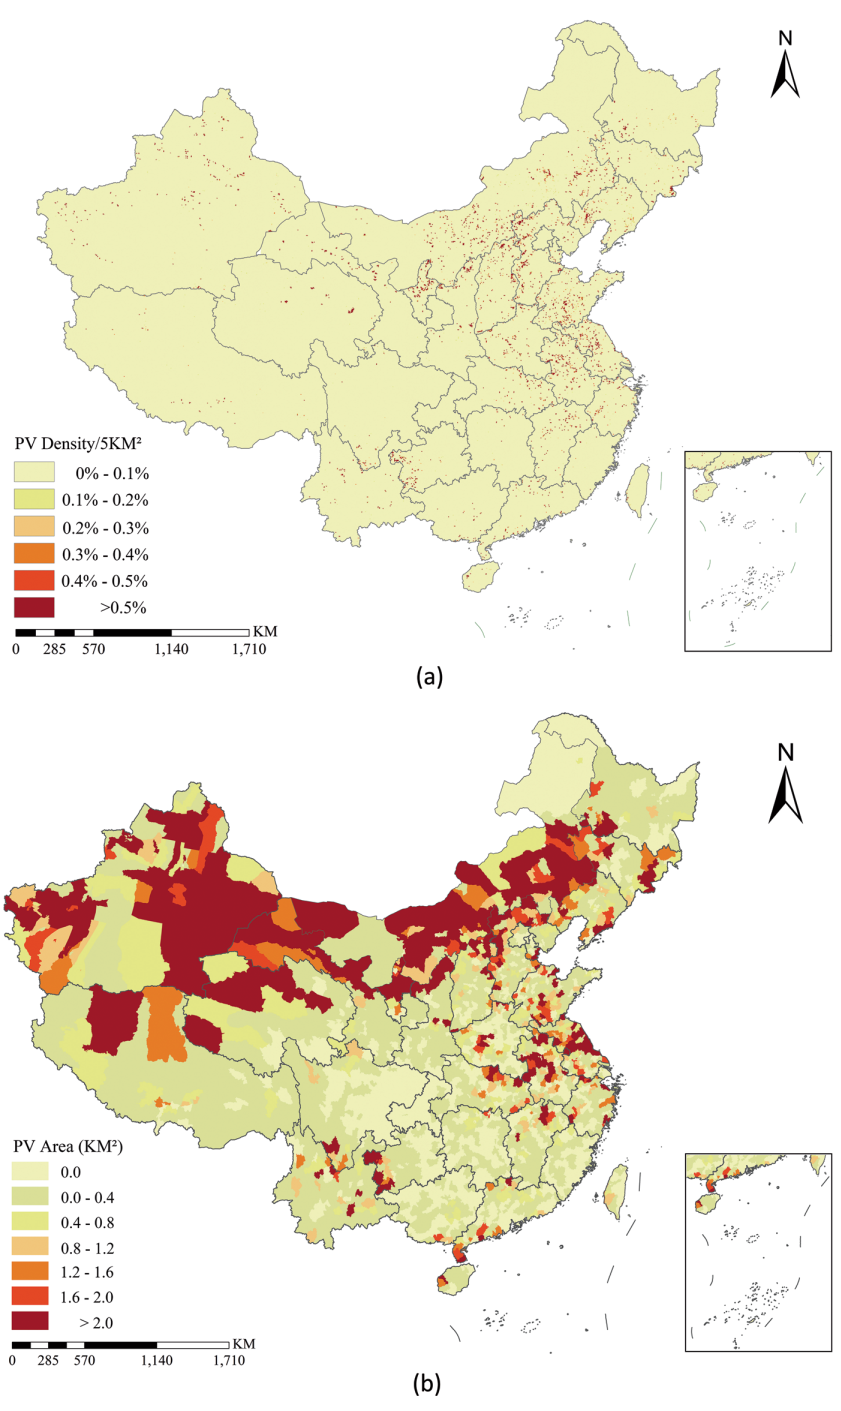
Fig. 2 (a) PV power stations density map across China; (b) PV power stations area map for each county of China.
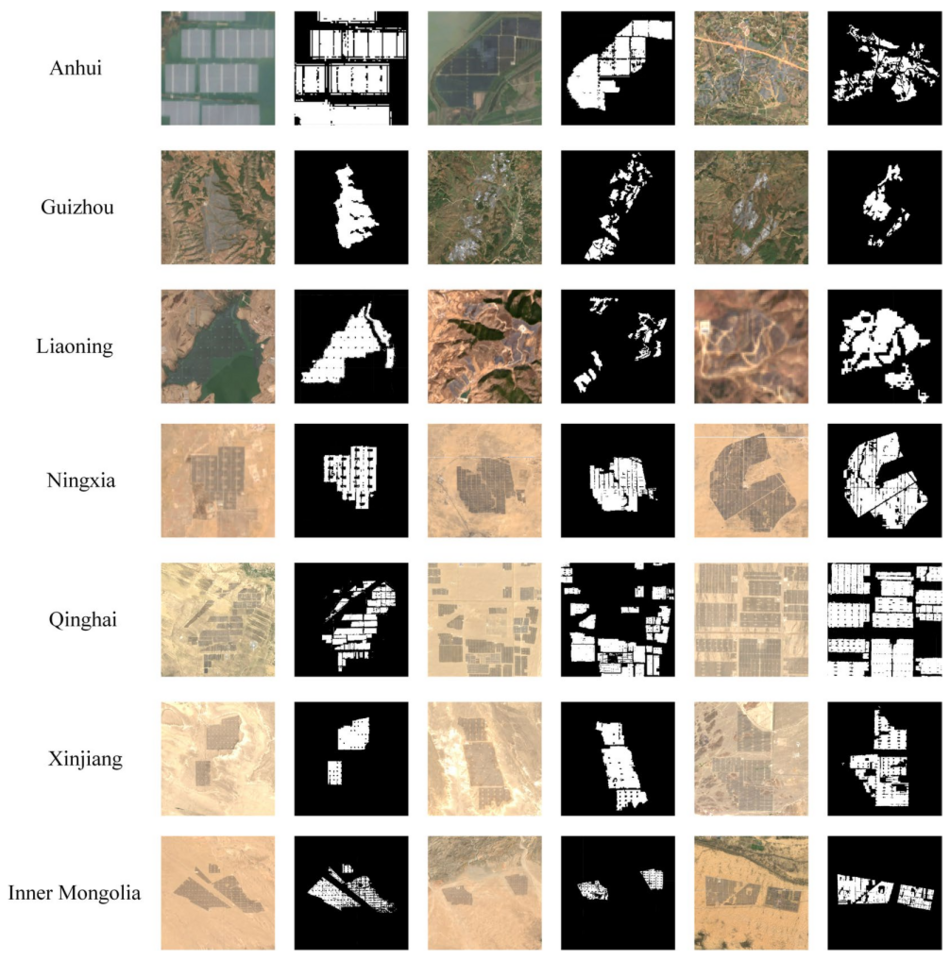
Apart from the grid map, we also calculated the areas of PV power stations in each county of China and put these data on map (Fig. 2b). Compared with the grid map, county-level PV map could provide the panel data of PV power stations of each county, which could facilitate in-depth analysis with socio-economic data, since most socio-economic data in China are in the units of county. Fig. 3 illustrates the detailed PV station maps generated, showing a good performance in boundary extraction.
As for the areas of PV power stations of China, the three largest provinces refer to Xinjiang, Inner Mongolia and Qinghai, whose PV area ratio are 14.92%, 12.49% and 11.26%, respectively, with a total of nearly 40% of all the PV power stations of China. Among the rest provinces, both Gansu, Ningxia, Hebei and Shaanxi witness a PV area ratio above 5%, which contributes to another 20% of China’s PV power stations in total. It should also be noted that with the rapid development of China’s PV industry, increasingly more eastern provinces built large-scale PV power stations, including Jiangsu, Anhui and Shandong Province.
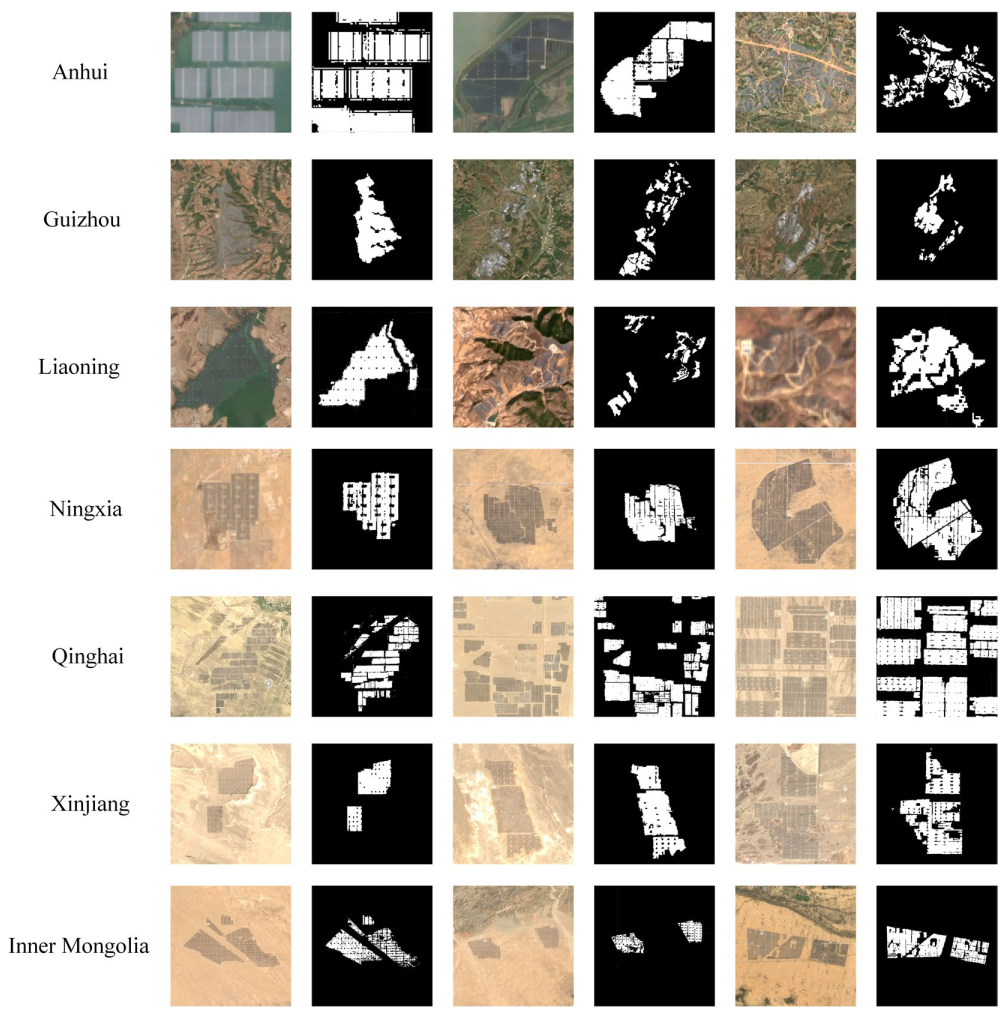
Fig. 3 Details of PV power stations map across China.
The released dataset is in the unit of province of China, which is freely available for all users at Science Data Bank (http://doi.org/10.57760/sciencedb.o00121.00001). The PV map is in the standard format of GeoTIFF, which could be easily further processed by both GIS software and coding language such as R and Python. The GEE code (https://github.com/MrSuperNiu/PV_ScientificData_Classification_Code) for generating PV map has also been released for the purpose of reproduction, including the calculation of each feature, random forest classification, etc. Besides, the released code could also provide a useful reference for other large-scale mapping applications such as cropland mapping, flood mapping, etc.
To sum up, we provide a 10-m map for China’s PV power stations to provide reference data to understand the spatial pattern of China’s PV industry. The dataset could also be used for other applications such as prediction of PV’s generating capacity and site selection for newly built PV power stations. Besides, the detailed PV map could also support for policy making of China’s clean energy and provide useful data for studies such as land use and land cover change.
The article has been published in Scientific Data as follows.
Feng, Q., Niu, B., Ren, Y. et al. A 10-m national-scale map of ground-mounted photovoltaic power stations in China of 2020. Sci Data 11, 198 (2024). https://doi.org/10.1038/s41597-024-02994-x
Follow the Topic
-
Scientific Data

A peer-reviewed, open-access journal for descriptions of datasets, and research that advances the sharing and reuse of scientific data.
Related Collections
With Collections, you can get published faster and increase your visibility.
Data for crop management
Publishing Model: Open Access
Deadline: Apr 17, 2026
Data to support drug discovery
Publishing Model: Open Access
Deadline: Apr 22, 2026



Please sign in or register for FREE
If you are a registered user on Research Communities by Springer Nature, please sign in