AI Decodes the Deluge: Unveiling Rising Rainfall Extremes in the Urbanizing Himalayan Foothills
Published in Earth & Environment and Statistics
A groundbreaking study led by Dr. Sumanta Das from the School of Environment and Disaster Management, Ramakrishna Mission Vivekananda Educational and Research Institute (RKMVERI) and The University of Queensland, in collaboration with scientists from Met Office, U. K. and the University of Petroleum and Energy Studies, unveils compelling new evidence of how urban expansion is reshaping rainfall dynamics and amplifying hydroclimatic extremes across the Indian Himalayan foothills. The study, recently published in Earth Systems and Environment (Springer Nature), offers the first comprehensive integration of machine learning and geospatial analytics to decode four decades of precipitation variability in Uttarakhand—one of India’s most fragile yet rapidly urbanizing mountain states.
Understanding the Urban Climate Paradox in the Himalayas
The Himalayas, long perceived as a pristine climatic buffer, are now confronting an unexpected transformation. Uttarakhand—once dominated by forested valleys and small agrarian settlements—has witnessed a surge in urban growth, industrialization, and tourism over the past three decades. This study was motivated by a critical question: How are these anthropogenic shifts altering rainfall behavior, and what might this mean for the region’s future hydroclimatic stability?
Urbanization modifies the landscape through impervious surfaces, heat island effects, and aerosol emissions, all of which influence local weather systems. Yet, the precise relationship between land-use change and precipitation extremes in the Himalayas has remained poorly understood. “Our research bridges this knowledge gap by combining statistical climatology, extreme event analysis, and artificial intelligence, providing a panoramic view of how urban-driven climate alterations manifest in a data-scarce, topographically complex environment,” said Dr. Das.
A Data-Driven Framework for Climate Insight
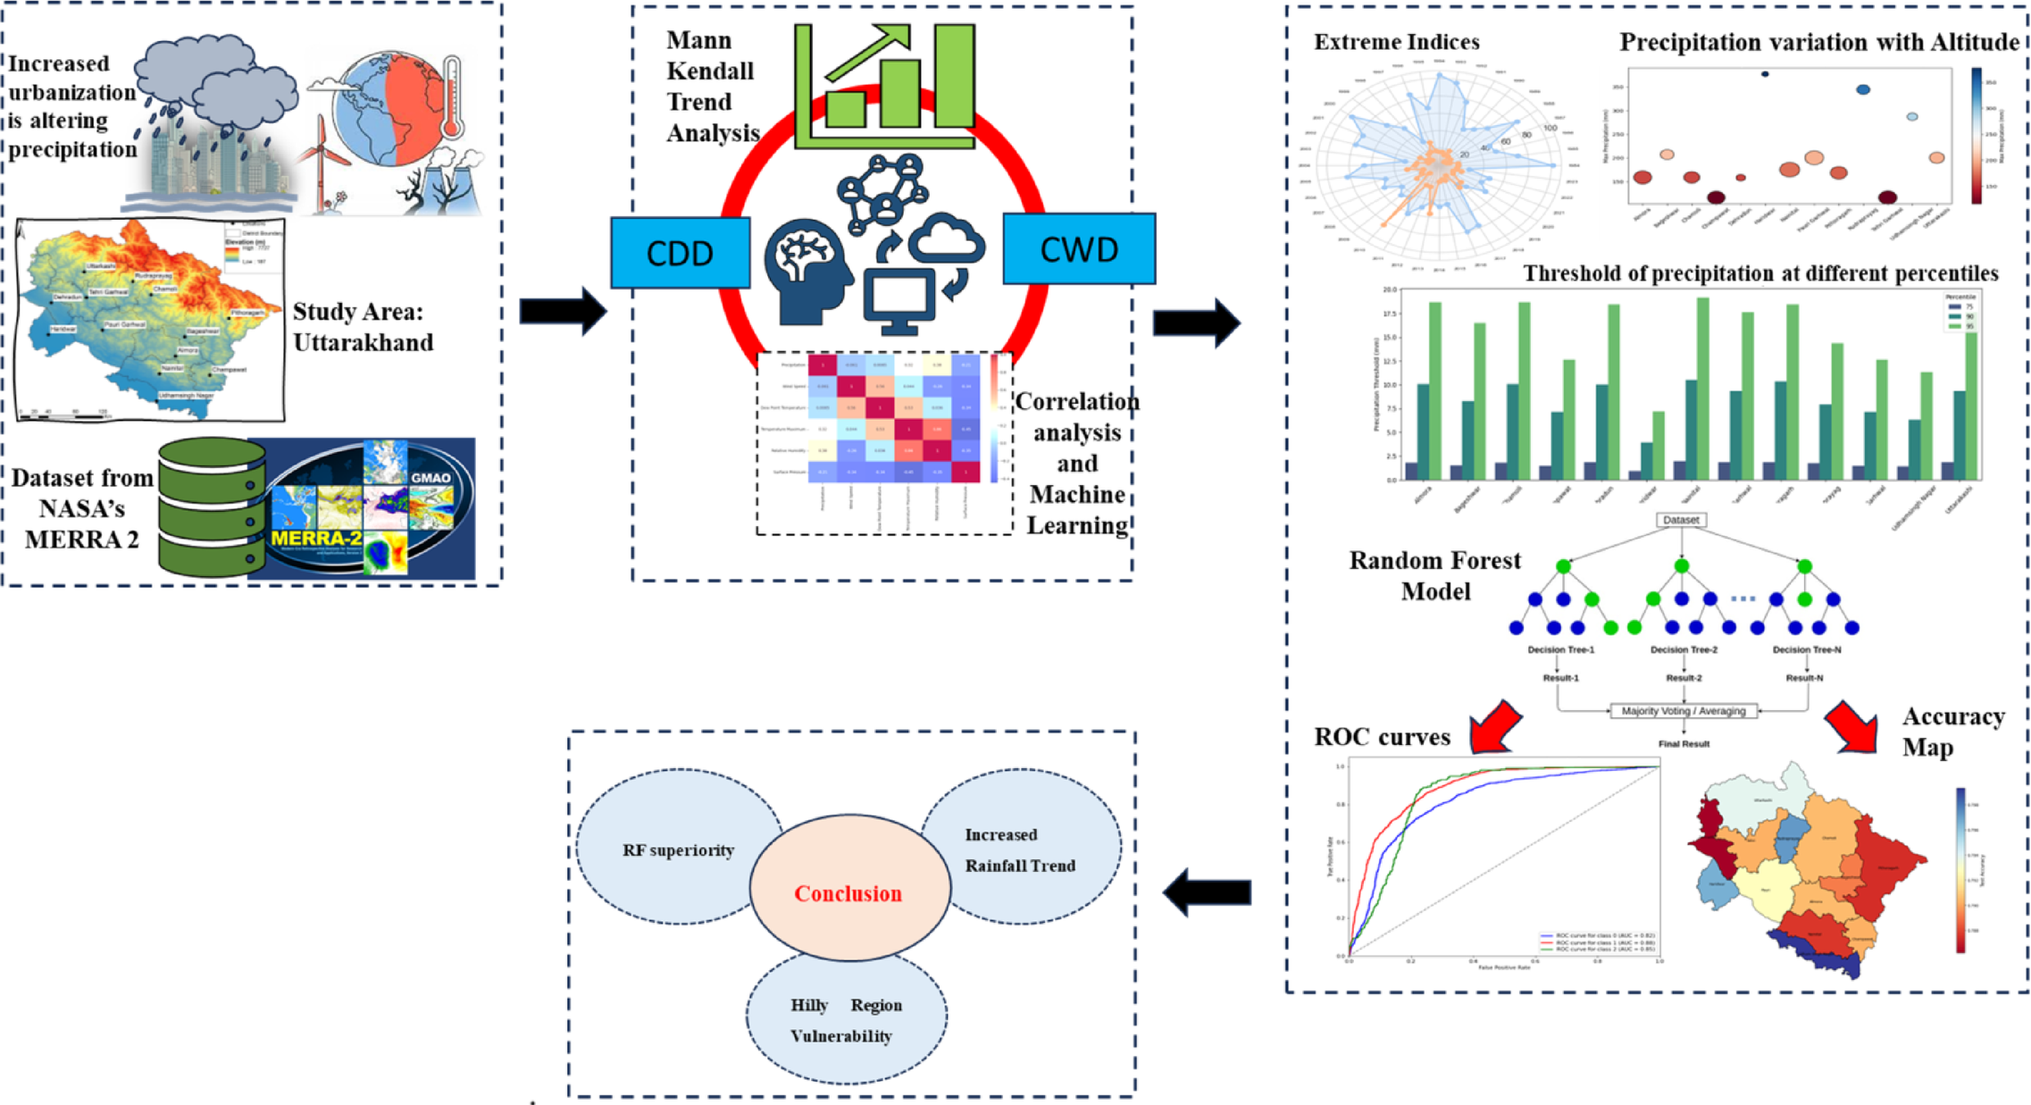
The study pioneers an integrated analytical framework combining advanced non-parametric statistical tools (Mann–Kendall and Sen’s slope) with machine learning classifiers (Random Forest and Support Vector Machine) to unravel 40 years (1984–2023) of high-resolution MERRA-2 reanalysis data. Three core innovations define this work:
-
Hybrid Statistical–AI Synergy:
Traditional trend detection techniques were coupled with AI-based classification models to identify both historical trends and predictive patterns of extreme rainfall events—marking a first-of-its-kind application in the Himalayan context. -
Fine-Scale Spatial Characterization:
The research dissected rainfall variability across all 13 districts of Uttarakhand, distinguishing between urban (e.g., Dehradun, Haridwar) and non-urban (e.g., Tehri Garhwal, Champawat) zones. This fine-grained mapping uncovered distinct microclimatic regimes shaped by land-use transformations and elevation gradients. -
Extreme Climate Index Integration:
Using the globally standardized ETCCDI indices—Consecutive Dry Days (CDD) and Consecutive Wet Days (CWD)—the study quantified the persistence and frequency of extreme wet and dry spells. By aligning these indices with meteorological covariates such as relative humidity, dew point, and surface pressure, the team identified the dominant climatic drivers of rainfall anomalies.
Himalayan Cities Rain More, but Also Dry Longer
The findings reveal striking contrasts between urban and rural landscapes:
-
Urban rainfall intensification:
Urban districts recorded substantially higher rainfall—Haridwar (377.64 mm) and Dehradun (158.4 mm)—compared to non-urban areas like Tehri Garhwal (116.18 mm). Dehradun, in particular, showed the strongest rising trend with a Sen’s slope of 9.06 × 10⁻⁵, signaling accelerated hydroclimatic transformation. -
Extremes on both ends:
Despite rising annual totals, urban centers are also witnessing prolonged dry phases—up to 81 consecutive dry days in 2022—followed by intensified wet spells lasting up to 58 days in 2023. This oscillation suggests a growing “climate duality” of drought and deluge, with profound implications for water management and disaster preparedness. -
AI-predicted extremes with 80% accuracy:
The machine learning models successfully classified extreme rainfall events with high accuracy. The Random Forest model slightly outperformed the Support Vector Machine, achieving up to 79.93% classification accuracy in the urban-industrial district of Udham Singh Nagar. -
Meteorological determinants:
Correlation analysis identified relative humidity, dew point temperature, and surface pressure as the dominant climatic controls influencing precipitation variability. These parameters exhibited strong positive correlations with rainfall, confirming their role as critical precursors of extreme events.
Global Context and Implications
The research transcends regional relevance. It aligns closely with the Intergovernmental Panel on Climate Change (IPCC, AR6) findings, which warn of intensifying hydroclimatic extremes under global warming. However, this study uniquely underscores how urbanization can locally amplify global climate trends, accelerating the frequency and magnitude of hydroclimatic hazards even in mid-altitude mountain systems.
“The Himalayan foothills are transitioning into a new hydroclimatic state,” Dr. Das emphasized. “Urban expansion and land-cover change are now as potent as global warming in modulating rainfall dynamics. This convergence demands integrated adaptation strategies that consider both global and local forcings.”
The findings also hold vital policy significance. They support India’s National Action Plan on Climate Change (NAPCC) and the Sustainable Development Goals (SDGs 6 and 13) by offering actionable insights into water security, disaster risk reduction, and urban climate resilience. The data-driven framework can inform regional early-warning systems, climate-resilient infrastructure design, and municipal planning to minimize flood and drought losses in rapidly expanding hill cities.
A New Vision for Mountain Urban Climatology
This study is not merely diagnostic—it represents a methodological breakthrough for data-sparse mountainous regions worldwide. By leveraging AI and remote sensing synergy, it provides a scalable template for similar analyses across the Himalayas, Andes, or East African Highlands. The integration of reanalysis datasets with machine learning reduces dependency on sparse ground-based rain gauges, offering an adaptable approach to climate surveillance under constrained data conditions.
Moreover, the study reinforces the urgency of urban environmental stewardship in mountain ecosystems. With Himalayan towns expanding at unprecedented rates, local authorities can use these insights to prioritize green infrastructure, stormwater harvesting, and land-use zoning to mitigate cascading impacts of extreme rainfall.
A Wake-up Call for a Warming Himalaya
In essence, Dr. Sumanta Das and his team have decoded the evolving “hydroclimatic fingerprint” of urbanizing Himalayan landscapes. Their results reveal an unsettling paradox—urban growth, while fostering economic expansion, is simultaneously exacerbating rainfall extremes and hydrological stress.
By integrating data science with environmental climatology, the research offers a pioneering step toward a more predictive, resilient, and climate-informed Himalayan future. The study’s innovative synthesis of statistical rigor, AI precision, and policy relevance not only deepens our understanding of mountain climate dynamics but also sends a clear message: cities in the clouds are reshaping their own weather.
Journal Reference:
Tandon, A., Awasthi, A., Pattnayak, K.C., & Das, S. (2025). Rainfall Variability and Rising Extremes in Urbanizing Himalayan Foothills: A Machine Learning and Data-driven Exploration of Hydroclimatic Shifts in Uttarakhand, India. Earth Systems and Environment. DOI: 10.1007/s41748-025-00881-y
Follow the Topic
-
Earth Systems and Environment
This is a multidisciplinary journal publishing peer-reviewed research on Earth System sciences and environment-related topics.


Please sign in or register for FREE
If you are a registered user on Research Communities by Springer Nature, please sign in