Artificial intelligence enables precise integration of spatial transcriptomics data
Published in Computational Sciences
The challenge of integrating spatial transcriptomics data
The spatial location of cells in tissues and organs is critically important for them to perform specific functions. In recent years, ST technology has allowed for the simultaneous measurement of gene expression and spatial location information in tissue slices. This provides researchers with the tools to decipher the spatial structure of tissues and understand how the surrounding environment influences gene expression in cells. For example, we developed a graph attention auto-encoder model to decipher spatial domains in tissue1. Further, we introduced the saliency map technique of deep learning to extract spatially variable genes from ST data2.
With the continuous accumulation of ST data, integrating and analyzing multiple slices can provide biological insights that cannot be obtained from individual slices alone3. However, there are inevitable batch effects between ST data from different sources. Eliminating batch effects while preserving true biological differences between batches is a major challenge in achieving data integration. Although current single-cell transcriptomic data integration methods can also be used for multi-slice integration, their results are prone to be influenced by technical noise and lack of clear spatial boundaries due to the absence of spatial information4. On the other hand, a recent spatial integration method, PASTE5, requires biological/technical replicates with high similarity, which is often violated in real heterogeneous tissue. We therefore aimed to develop an effective method that allows precise integration of heterogeneous ST slices.
The proposed method STAligner
We developed an artificial intelligence tool STAligner for integrating multiple ST slices. In each ST slice, we constructed a spatial neighbor graph based on the spatial coordinates of each spot, and each node on the graph carries gene expression information. Graph neural network is a type of newest neural network designed for such graph-structured data, and we adopted it to leverage information from neighboring nodes to enhance the representation of the current node. As a result, STAligner obtains low-dimensional representation including both expression and spatial information (Figure 1a). Then, using this low-dimensional representation, STAligner searches confident triplets across slices to guide the model to remove batch effects. Finally, the batch-corrected representation is used for subsequent clustering analysis to identify tissue structures with similar spatial expression patterns.
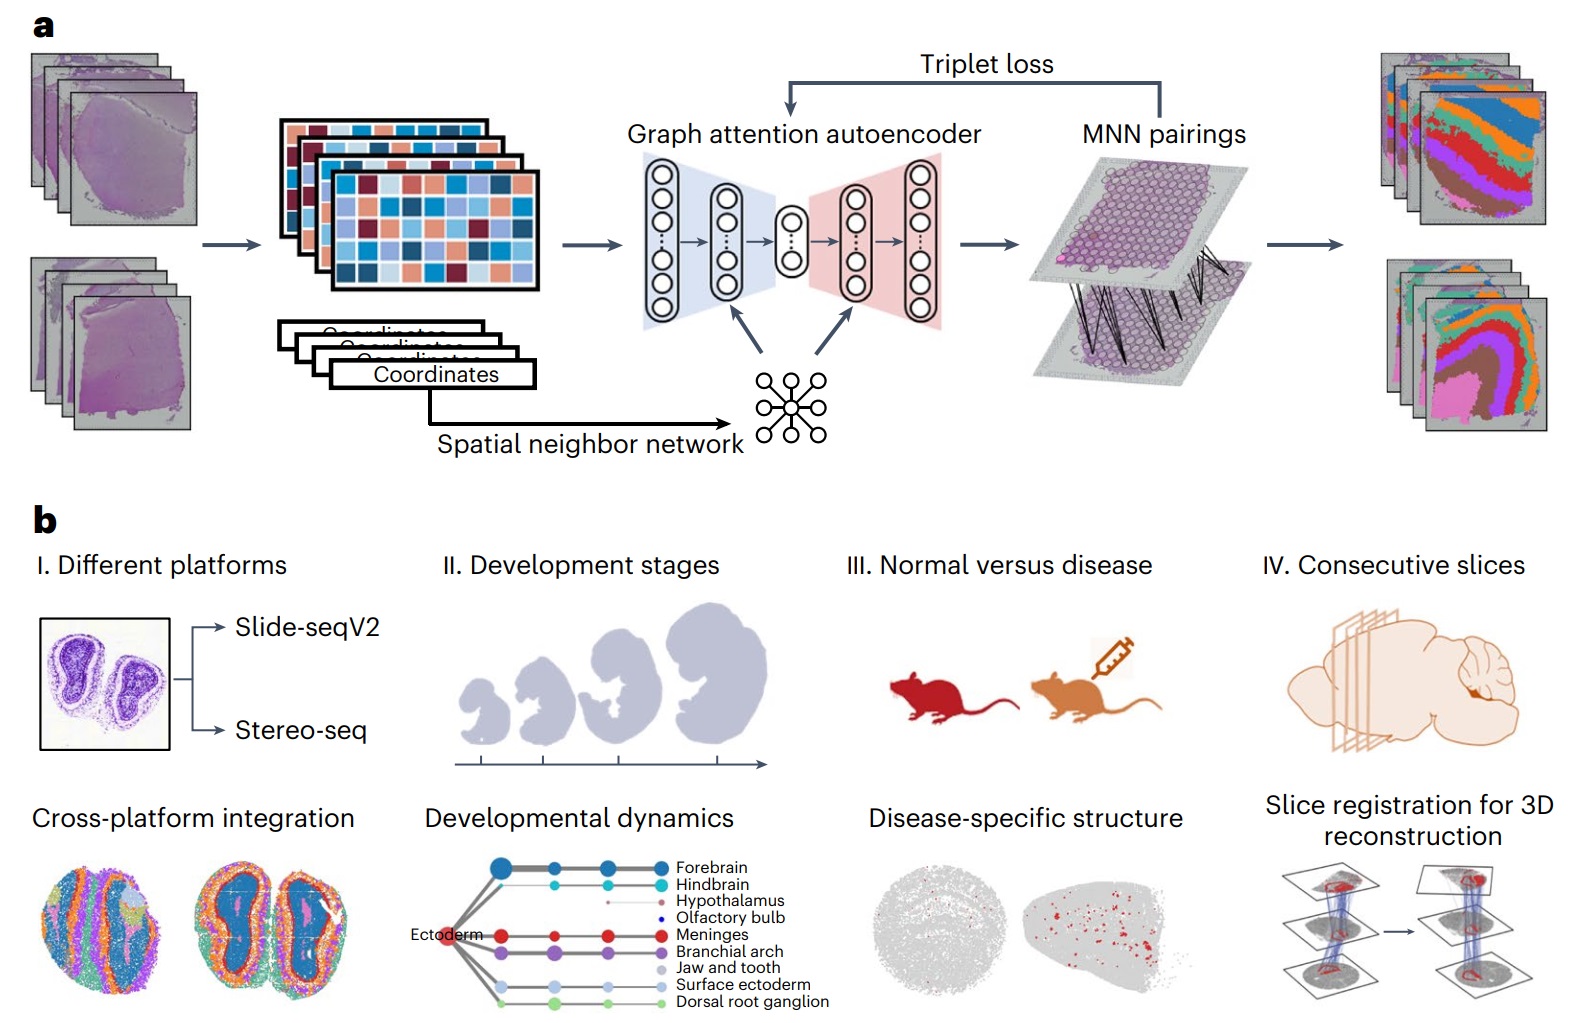
Figure 1. Overview of STAligner.
Biological applications
We applied STAligner to a diverse set of ST datasets, including human cortical slices from different samples, mouse olfactory bulb slices generated using two different profiling techniques, spatiotemporal atlases of mouse organogenesis, and mouse hippocampus tissue slices in normal and Alzheimer's disease conditions (Figure 1b). STAligner effectively captures common tissue structures across distinct slices, tracks the dynamic changes in tissue structures during mouse embryonic development, and detects disease-related substructures. Furthermore, the spatial domains shared between slices and the nearest neighbor pairs identified by STAligner can be utilized as corresponding pairs to guide the 3D reconstruction of consecutive slices. This approach achieves more accurate local structure-guided registration compared to existing methods, such as PASTE. With these successful applications, we believe STAligner can be used by biologists as a new tool to uncover new important biological insights when performing spatial transcriptomics analysis.
Future directions
Since STAligner’s 3D reconstruction is based on the iterative closest point (ICP) algorithm6, it can only achieve linear transformation (for example, rotation and translation) and cannot account for nonlinear distortions. Thus, promising future work is to develop a nonlinear alignment approach guided by common spatial domains, which may involve two key steps. Firstly, we could employ an ICP-based method to establish an initial coarse alignment. Subsequently, nonlinear alignment is performed to finely adjust the localized warped coordinates. This hybrid transformation strategy may align slices from different samples while accounting for anatomical variations across samples. We envision that this approach holds promise in establishing a unified reference for organs across different individuals and in constructing an ST atlas in the future. Another direction is to extend the current model to integrate multimodal data, such as histological images and epigenomic data. We anticipate that advancements in these directions will facilitate a more comprehensive exploration of biological phenomena.
References
[1] Dong K, Zhang S. Deciphering spatial domains from spatially resolved transcriptomics with an adaptive graph attention auto-encoder. Nature Communications 13:1739 (2022).
[2] Zhang C, Dong K, Aihara K, Chen L, Zhang S. STAMarker: determining spatial domain-specific variable genes with saliency maps in deep learning. Nucleic Acids Research, gkad801 (2023).
[3] Chen, S. et al. Spatially resolved transcriptomics reveals genes associated with the vulnerability of middle temporal gyrus in Alzheimer’s disease. Acta Neuropathologica Communications 10, 1-24 (2022).
[4] Korsunsky, I. et al. Fast, sensitive and accurate integration of single-cell data with Harmony. Nature Methods 16, 1289-1296 (2019).
[5] Zeira, R., Land, M., Strzalkowski, A. & Raphael, B. Alignment and integration of spatial transcriptomics data. Nature Methods 19, 567-575 (2022).
[6] Umeyama, S. Least-squares estimation of transformation parameters between two point patterns. IEEE Transactions on Pattern Analysis Machine Intelligence 13, 376-380 (1991).
Follow the Topic
-
Nature Computational Science

A multidisciplinary journal that focuses on the development and use of computational techniques and mathematical models, as well as their application to address complex problems across a range of scientific disciplines.
Related Collections
With Collections, you can get published faster and increase your visibility.
Physics-Informed Machine Learning
Publishing Model: Hybrid
Deadline: May 31, 2026


Please sign in or register for FREE
If you are a registered user on Research Communities by Springer Nature, please sign in