Battling Swamps and Pollution – A GIS Journey Through India’s Mangrove Crisis
Published in Agricultural & Food Science
Explore the Research

 sciencedirect.com
Just a moment...
Skip to main content
https://www.sciencedirect.com/science/article/pii/S1872203216300816


Our team assessed 16 physicochemical parameters across 18 sites, from industrial runoff zones to oil-spill-affected creeks.
The results were alarming:
Key Findings
1. Pollution Hotspots:
- COD levels 4–24× higher than safe limits due to sewage and agricultural runoff.
- Oil & grease contamination (0.36–1.68 mg/L) from spills, coating roots and suffocating marine life.
- Extreme water hardness (6,250 mg/L, 12× seawater norms) from Ca²⁺/Mg²⁺ overload, threatening mangrove physiology.
2. GIS to the Rescue:
- Inverse Distance Weighted (IDW) mapping revealed pollution gradients .

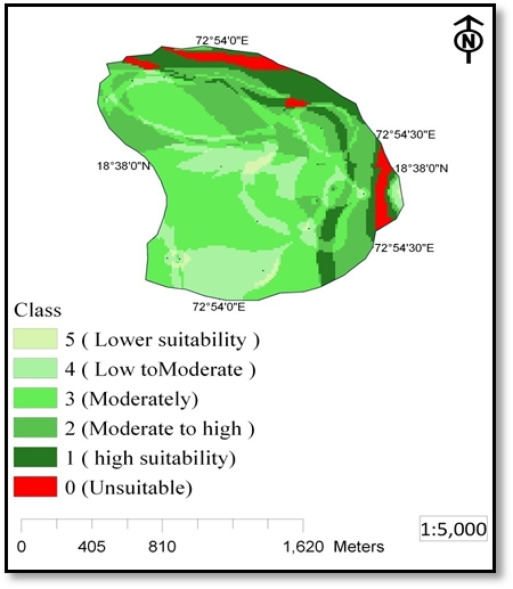
- Suitability maps classified areas into:
- Class 1–2: Urgent protection needed (near industrial zones).
- Class 3–4: Ideal for replanting nRhizophora mucronata with community support.
- Class 5–6: "Red zones" requiring immediate mitigation.
3. The Human Cost:
- Lateritic soils forced farmers to overuse fertilizers, poisoning waterways with NO₃⁻/PO₄³⁻.
- Coastal urbanization doubled salinity (66.82 ppt vs. 19 ppt in healthy mangroves).
Why This Matters
Mangroves are Earth’s carbon sinks and coastal shields, yet 50% have vanished in India. Our study proved GIS-based monitoring could guide targeted restoration—but it also exposed a harsh truth: without curbing industrial discharges and agricultural runoff, even the hardiest Avicennia stands little chance.
A Call to Action
To fellow researchers:
- How can we scale GIS tools for real-time mangrove pollution tracking?
- Could phytoremediation hybrids (e.g., salt-tolerant Bruguiera cylindrica) combat metal toxicity?
Explore the Data:
- [Full paper](DOI: 10.1016/j.chnaes.2017.06.017)
Please sign in or register for FREE
If you are a registered user on Research Communities by Springer Nature, please sign in