Democratising the use of global occurrence data using bees
Published in Research Data

All good scientists value the sharing of data and those data have really started to accumulate! Data aggregators like Global Biodiversity Information Facility (GBIF) and Symbiota Collection of Arthropod Network (SCAN) have worked towards gathering and making these data available to anyone with a computer and internet connection. More recently websites like iNaturalist have, with the help of photographers and expert identifiers, started to allow citizen scientists to also contribute to our understandings of the natural world by collecting occurrence data. The result is an absolute treasure trove of information!
That is, of course, until you want to use that treasure. When you open your first large occurrence dataset you might realise that you have opened something more akin to Pandora’s box. People looking to actually use these data will, after that initial excitement of a download fades, start to ask some serious questions. Do I only need to download data from one place? Are my data really fit for purpose? Is this datum really unique? There is a very long list of possible questions to ask and few good answers. Importantly as well, are you asking all of the right questions? Do you really have any of the answers? The result is a lot of confusion, uncertainty, and often it’s easier to just give up on the data or worse, simply use them as they come.
I’ve asked all of these questions and more and, when you really dig down to it, the task of making occurrence data fit-for-use is overwhelming. Or at least, it has been up until recently. Three R packages have recently been released. Together, the packages CoordinateCleaner (Zizka et al. 2019), bdc (Ribeiro et al. 2022), and now BeeBDC (Dorey et al. 2023) are a complimentary arsenal for ecologists to reliably mobilise occurrence datasets. These tools are not only critical for robust research, but for democratising science. You no longer need to be part of a massive research organisation or laboratory to use occurrence data, now anyone with a little R knowledge can contribute to science in ways that were previously closed to them.
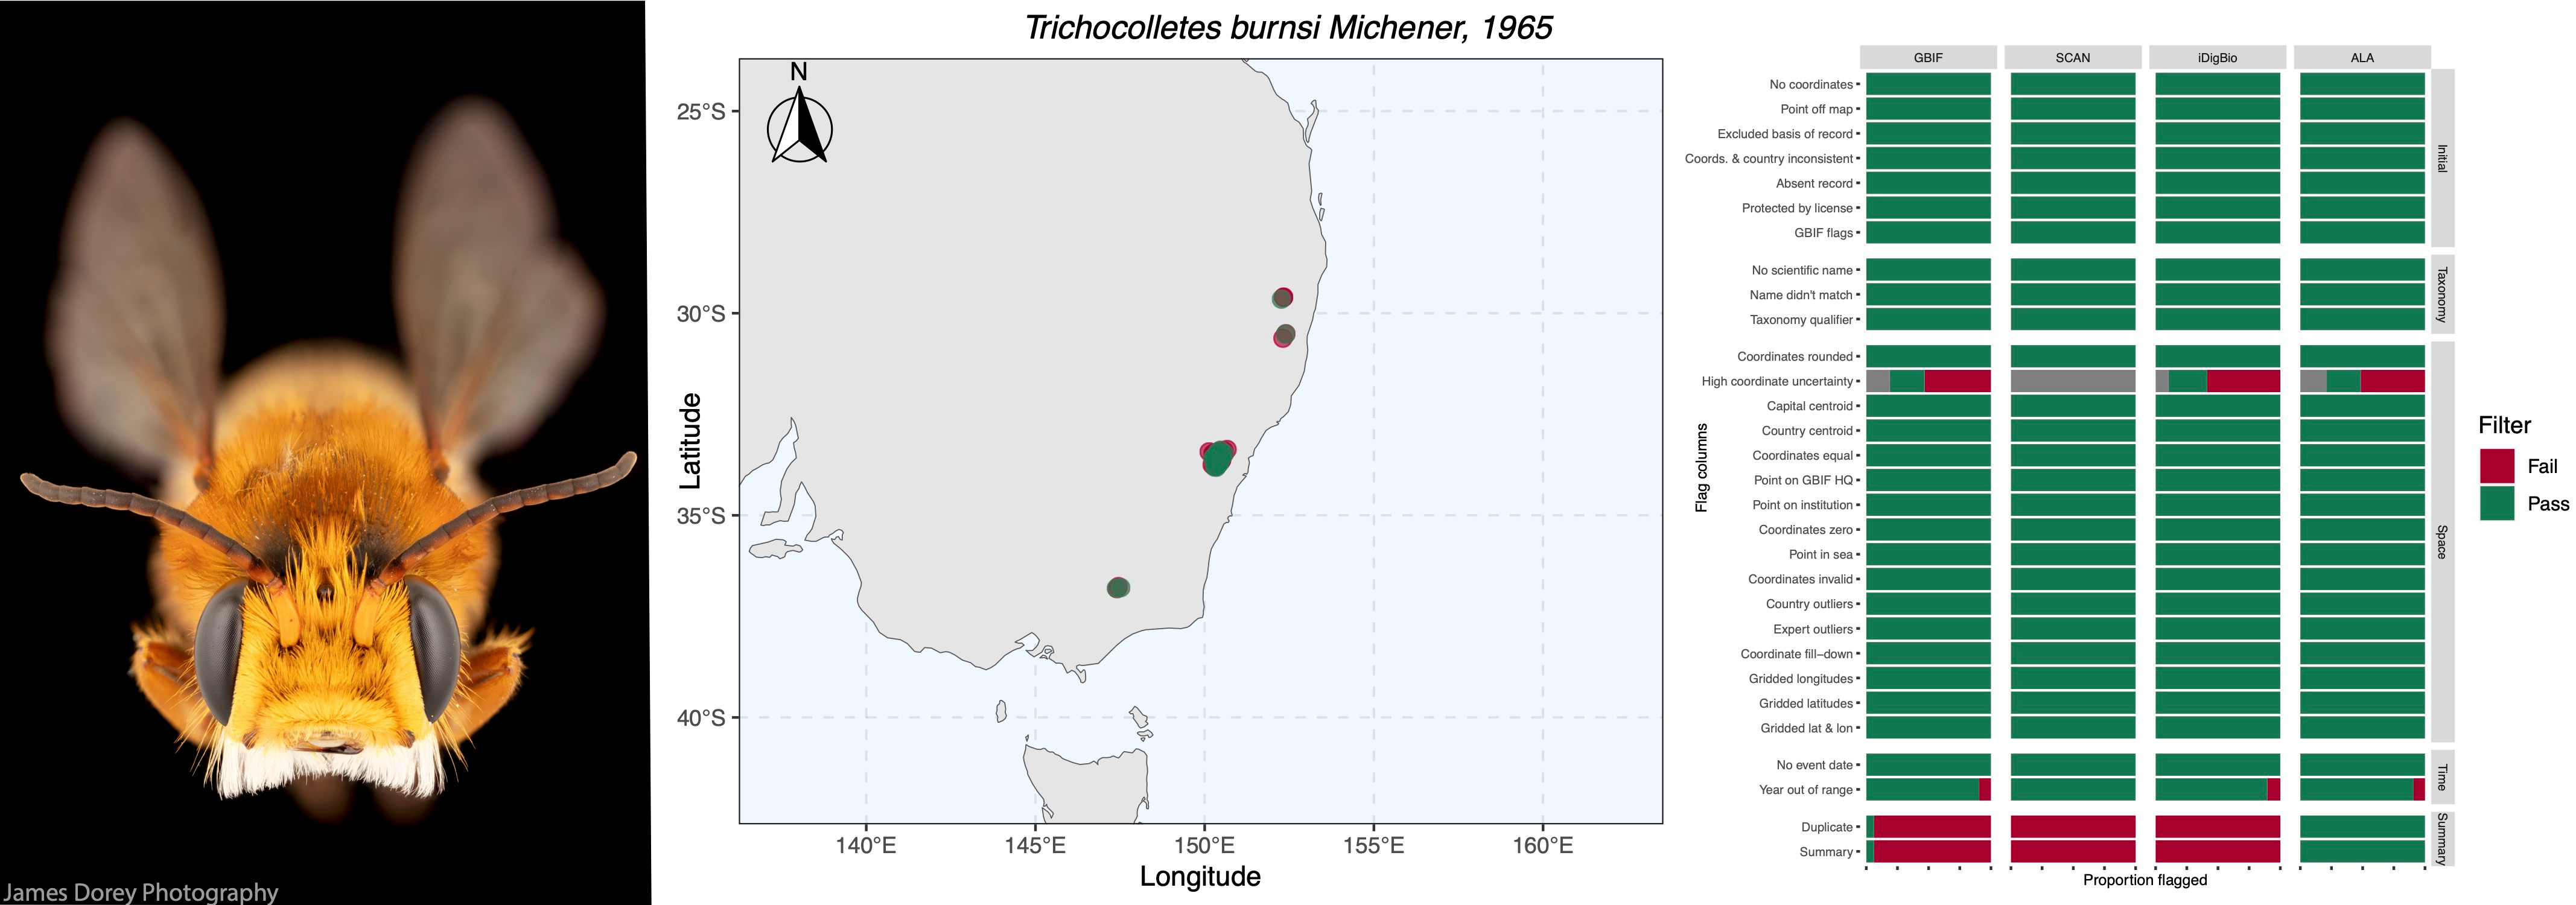
The BeeBDC package also provides an integrated workflow and vignette for all three packages to be used together. Beyond that, it opens the doors for researchers to develop taxon-specific datasets that are almost ready made for use! For example, we have collated over 18.3 million bee occurrence records from public and private repositories, flagged and corrected aspects of this massive dataset in order to make available a dataset that can be quickly mobilised to answer a variety of questions or further flagged using the BeeBDC workflow. Users can also download the globally cleaned dataset of 6.9 million records and start answering their hypotheses almost straight away.
I hope that by now, you are feeling excited about the possibility of having millions of data points suddenly at your disposal! That is, you know, without the months to years of confusion, tears, and uncertainty that would otherwise be involved with getting such data ready.
.jpg)
If you’re not yet convinced, I can tell you that this bee dataset is already being used by researchers on every continent except for Africa and Antarctica (and it has only just officially been released!). While I don’t expect bee research in Antarctica for some years I would certainly be thrilled to see the data used by researchers in Africa! We really hope that by democratising these data more research will be possible everywhere, but especially in under-funded and under-represented parts of the world. For example, Asia and Africa should have very high bee diversity but, according to the cleaned dataset, they are data dark-spots.
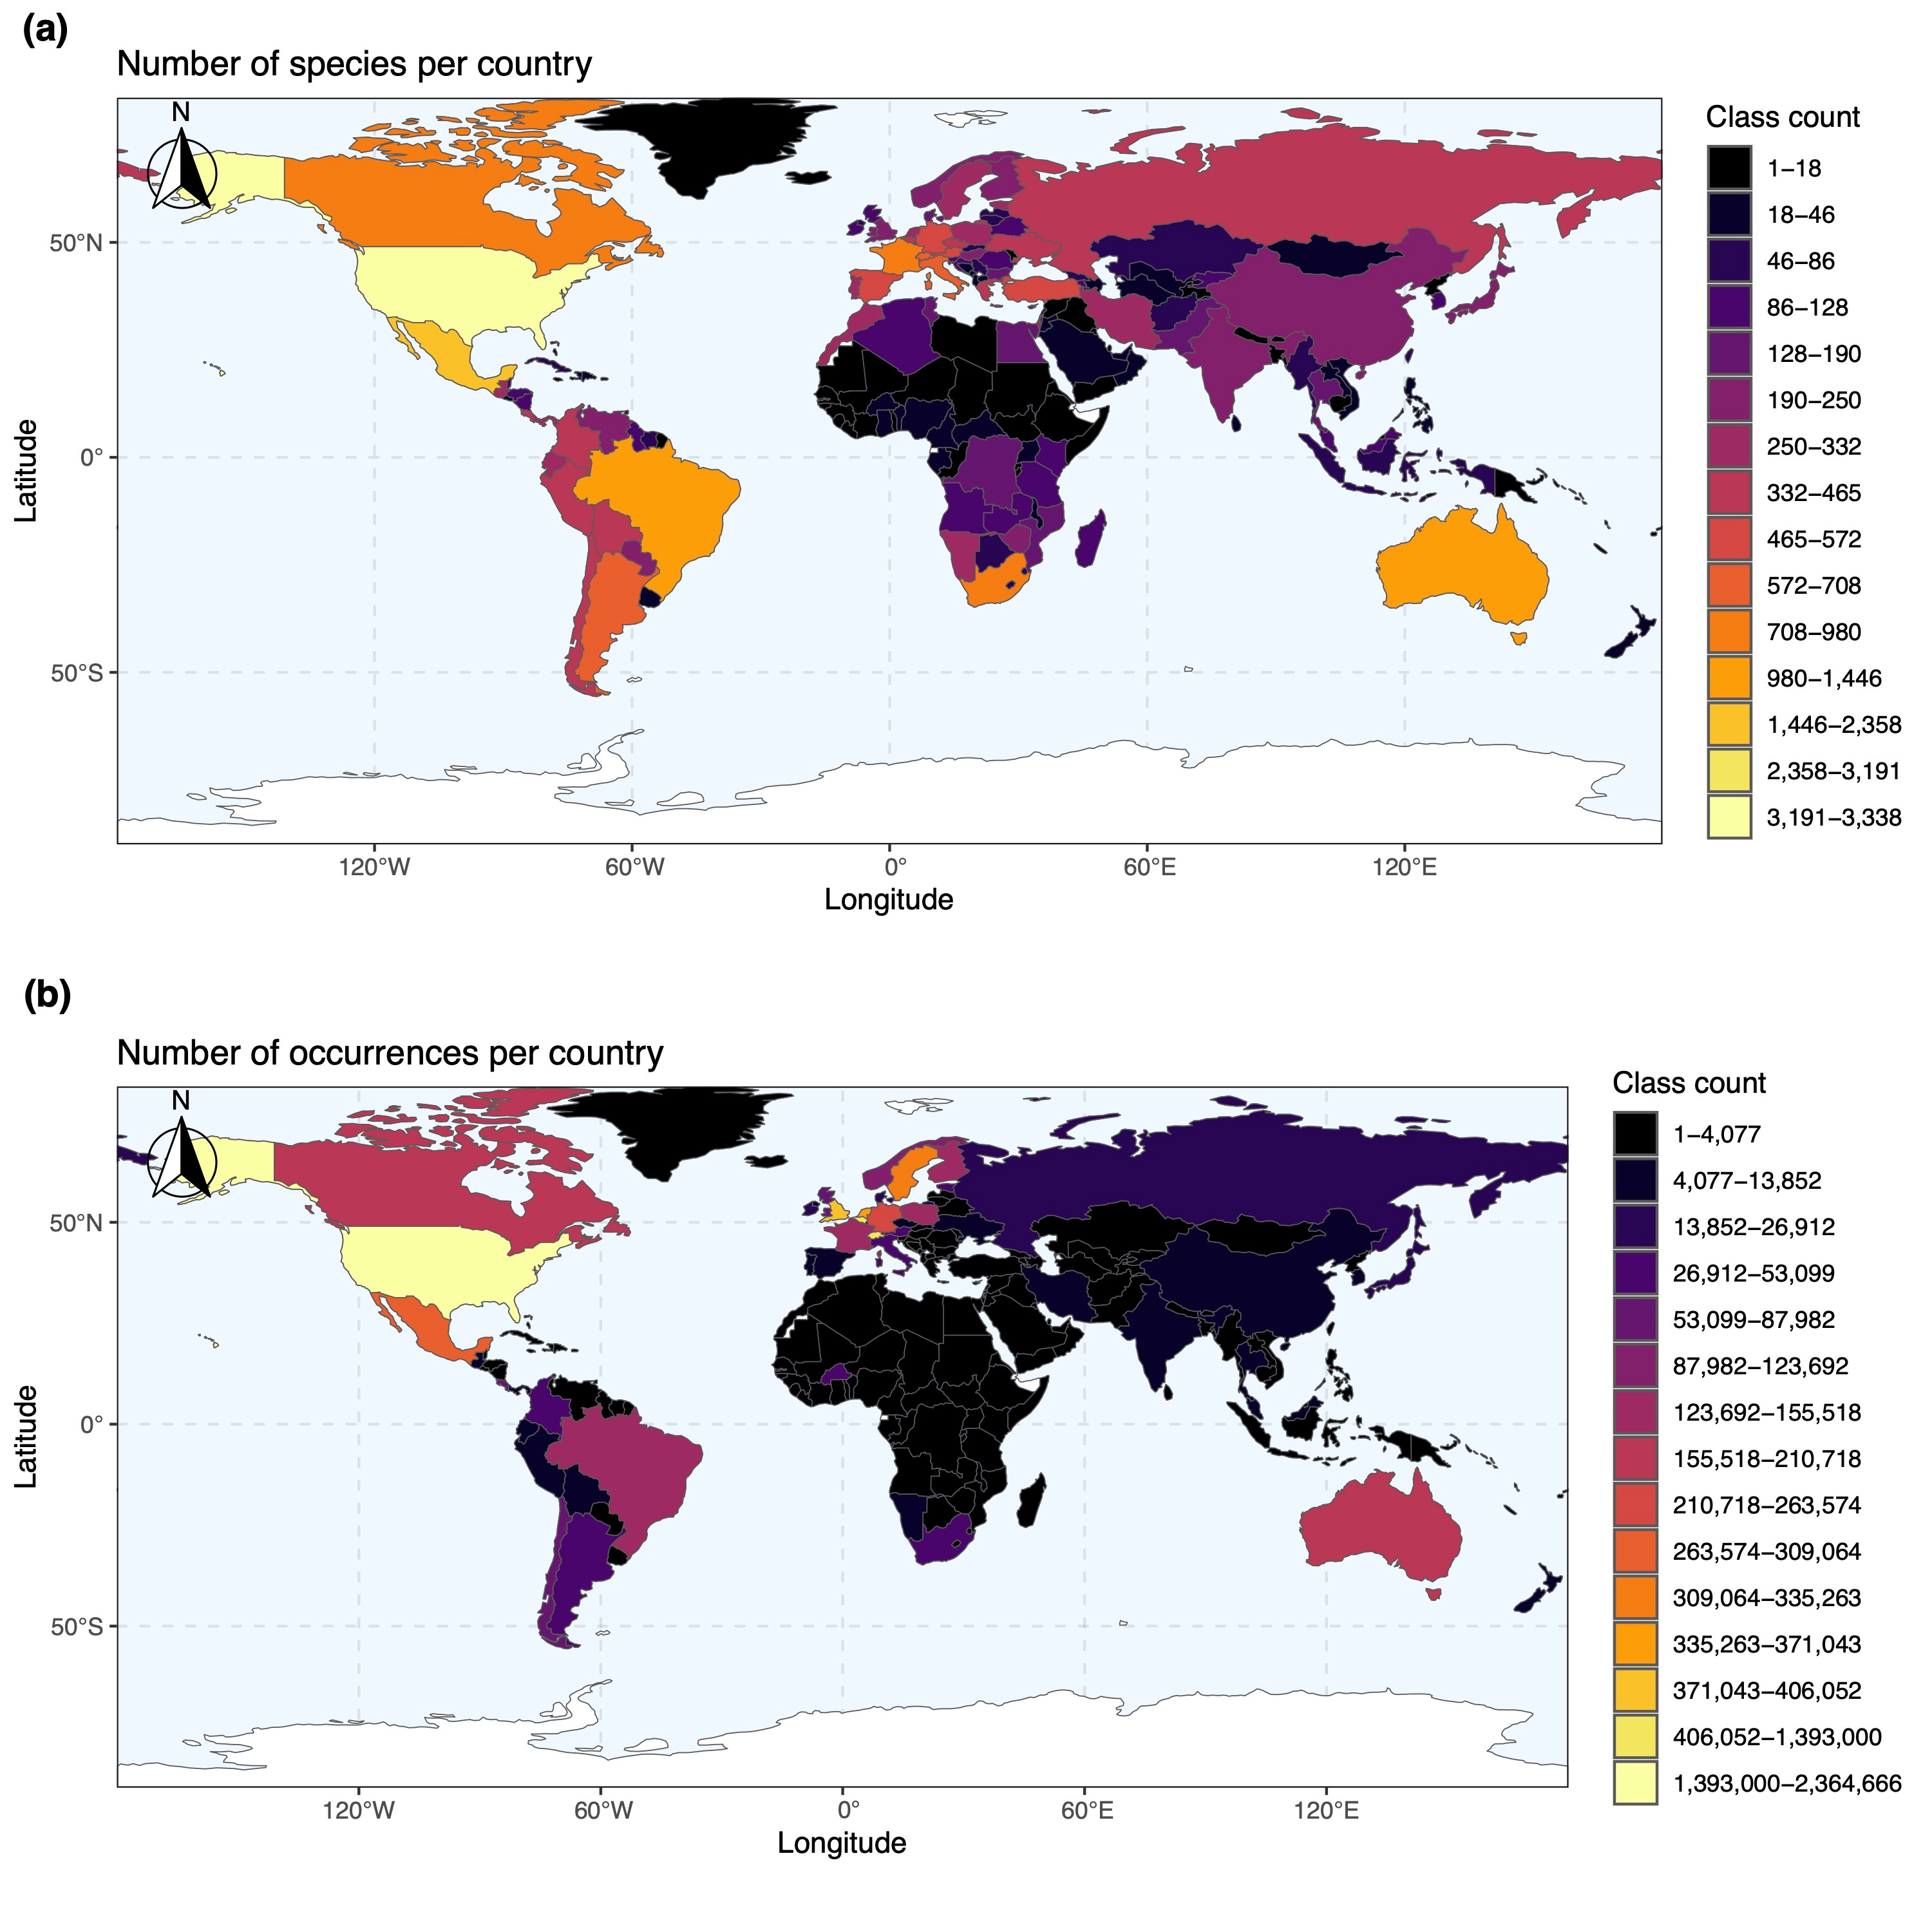
Figure 3. Occurrence-country summary maps created using the cleaned data indicating the (a) number of species per country and (b) number of occurrences per country from the filtered data. Colours indicate the number of (a) species or (b) occurrences where dark colours are low and yellow colours are high. Class intervals were defined using a “fisher” method.
Researchers are already using these data to answer important continental and clade- wide questions of (i) bee ecology and evolution, (ii) bee-plant interactions, (iii) bee-bee competition, and (iv) the potential impacts of the recently established Varroa mite in Australia. The possibilities are endless and suddenly very open to interrogation.

The package and dataset will also be a major milestone for the International Union for Conservation of Nature’s (IUCN) Wild Bee Specialist Groups (WBSG), allowing them to spring into the task of assessing and conserving the world’s bee diversity.
As always, the guiding principle behind our R package, workflow, and dataset is the fair democratisation of data so that researchers of the natural world can solve more problems better and faster!
Citation: Dorey, J. B., Fischer, E. E., Chesshire, P. R., Nava-Bolaños, A., O’Reilly, R. L., Bossert, S., . . . Cobb, N. S. (2023). A globally synthesised and flagged bee occurrence dataset and cleaning workflow. Scientific Data. doi:https://www.doi.org/10.1038/S41597-023-02626-W
Follow the Topic
-
Scientific Data

A peer-reviewed, open-access journal for descriptions of datasets, and research that advances the sharing and reuse of scientific data.
Related Collections
With Collections, you can get published faster and increase your visibility.
Data for crop management
Publishing Model: Open Access
Deadline: Apr 17, 2026
Data to support drug discovery
Publishing Model: Open Access
Deadline: Apr 22, 2026




Please sign in or register for FREE
If you are a registered user on Research Communities by Springer Nature, please sign in