Evidence integration and decision confidence are modulated by stimulus consistency
Published in Social Sciences

Integration of evidence to a decision boundary
Consider a judge deliberating whether a defendant is guilty or not, or a medical doctor diagnosing a patient's disease. Such decisions require the integration of multiple, potentially contradictory, pieces of evidence. But what is the exact mechanism used to integrate the evidence and decide when to terminate the decision process? An optimal decision algorithm that provides the fastest response time for a required accuracy is integration-to-boundary. This algorithm, first used by Alan Turing in the breaking of the Enigma-code, assumes that evidence is integrated till one of two boundaries is reached (for example, guilty or not guilty; see Figure 1A for illustration). The integration-to-boundary mechanism was supported by various behavioral and neural studies. However, despite this extensive research, there is still a considerable debate about the shape of the decision-boundary (whether it remains fixed or collapses across time, Figure 1A-B), as well as about how different decision-biases distort the integration process. One of the most well-known decision biases is the confirmation-bias – a tendency to give higher weight to information which is consistent with previous decisions or beliefs.
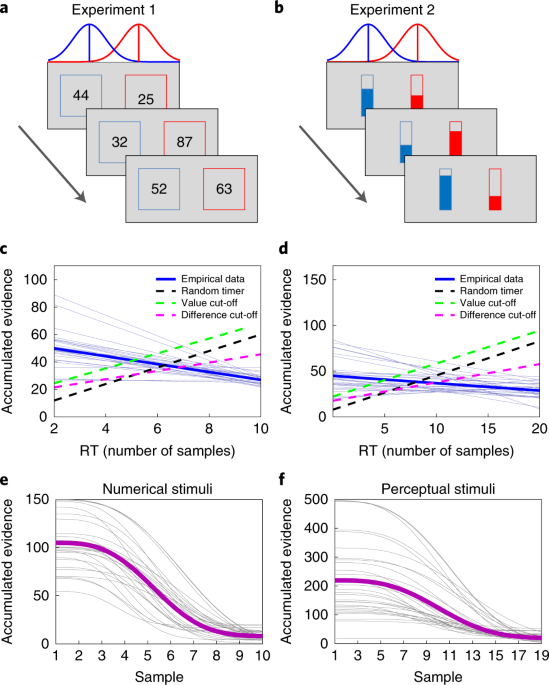
In this study, we addressed these issues using an experimental paradigm in which human observers were sequentially presented with samples of evidence (Figure 1C). In each trial, pairs of two digit numbers, sampled from two overlapping distributions were rapidly presented to participants (2 pairs/second). The task was to choose the sequence that was sampled from the distribution with the higher mean (red distribution in Figure 1C). In each frame, the left number may be higher than the right one (44 > 25, Figure 1C, first frame) – a situation equivalent to evidence supporting the defendant's guilt, or the right number may be higher than the left one (32 < 87, Figure 1C, second frame) – a situation equivalent to evidence supporting the defendant's innocence. The absolute difference between the numbers indicates the strength of the evidence.
One way to characterize the decision boundary is by using mathematical models. The problem is, however, that these models estimate the boundary while assuming arbitrary functional assumptions; thus the extracted boundary is model-dependent. Here, we developed a model-free method which allowed us to directly asses the shapes of the boundary (Figure 1D, upper panel). Using this method, we showed that the decision boundaries collapses across time (that is, less evidence is required to reach a decision; Figure 1D, lower panel).
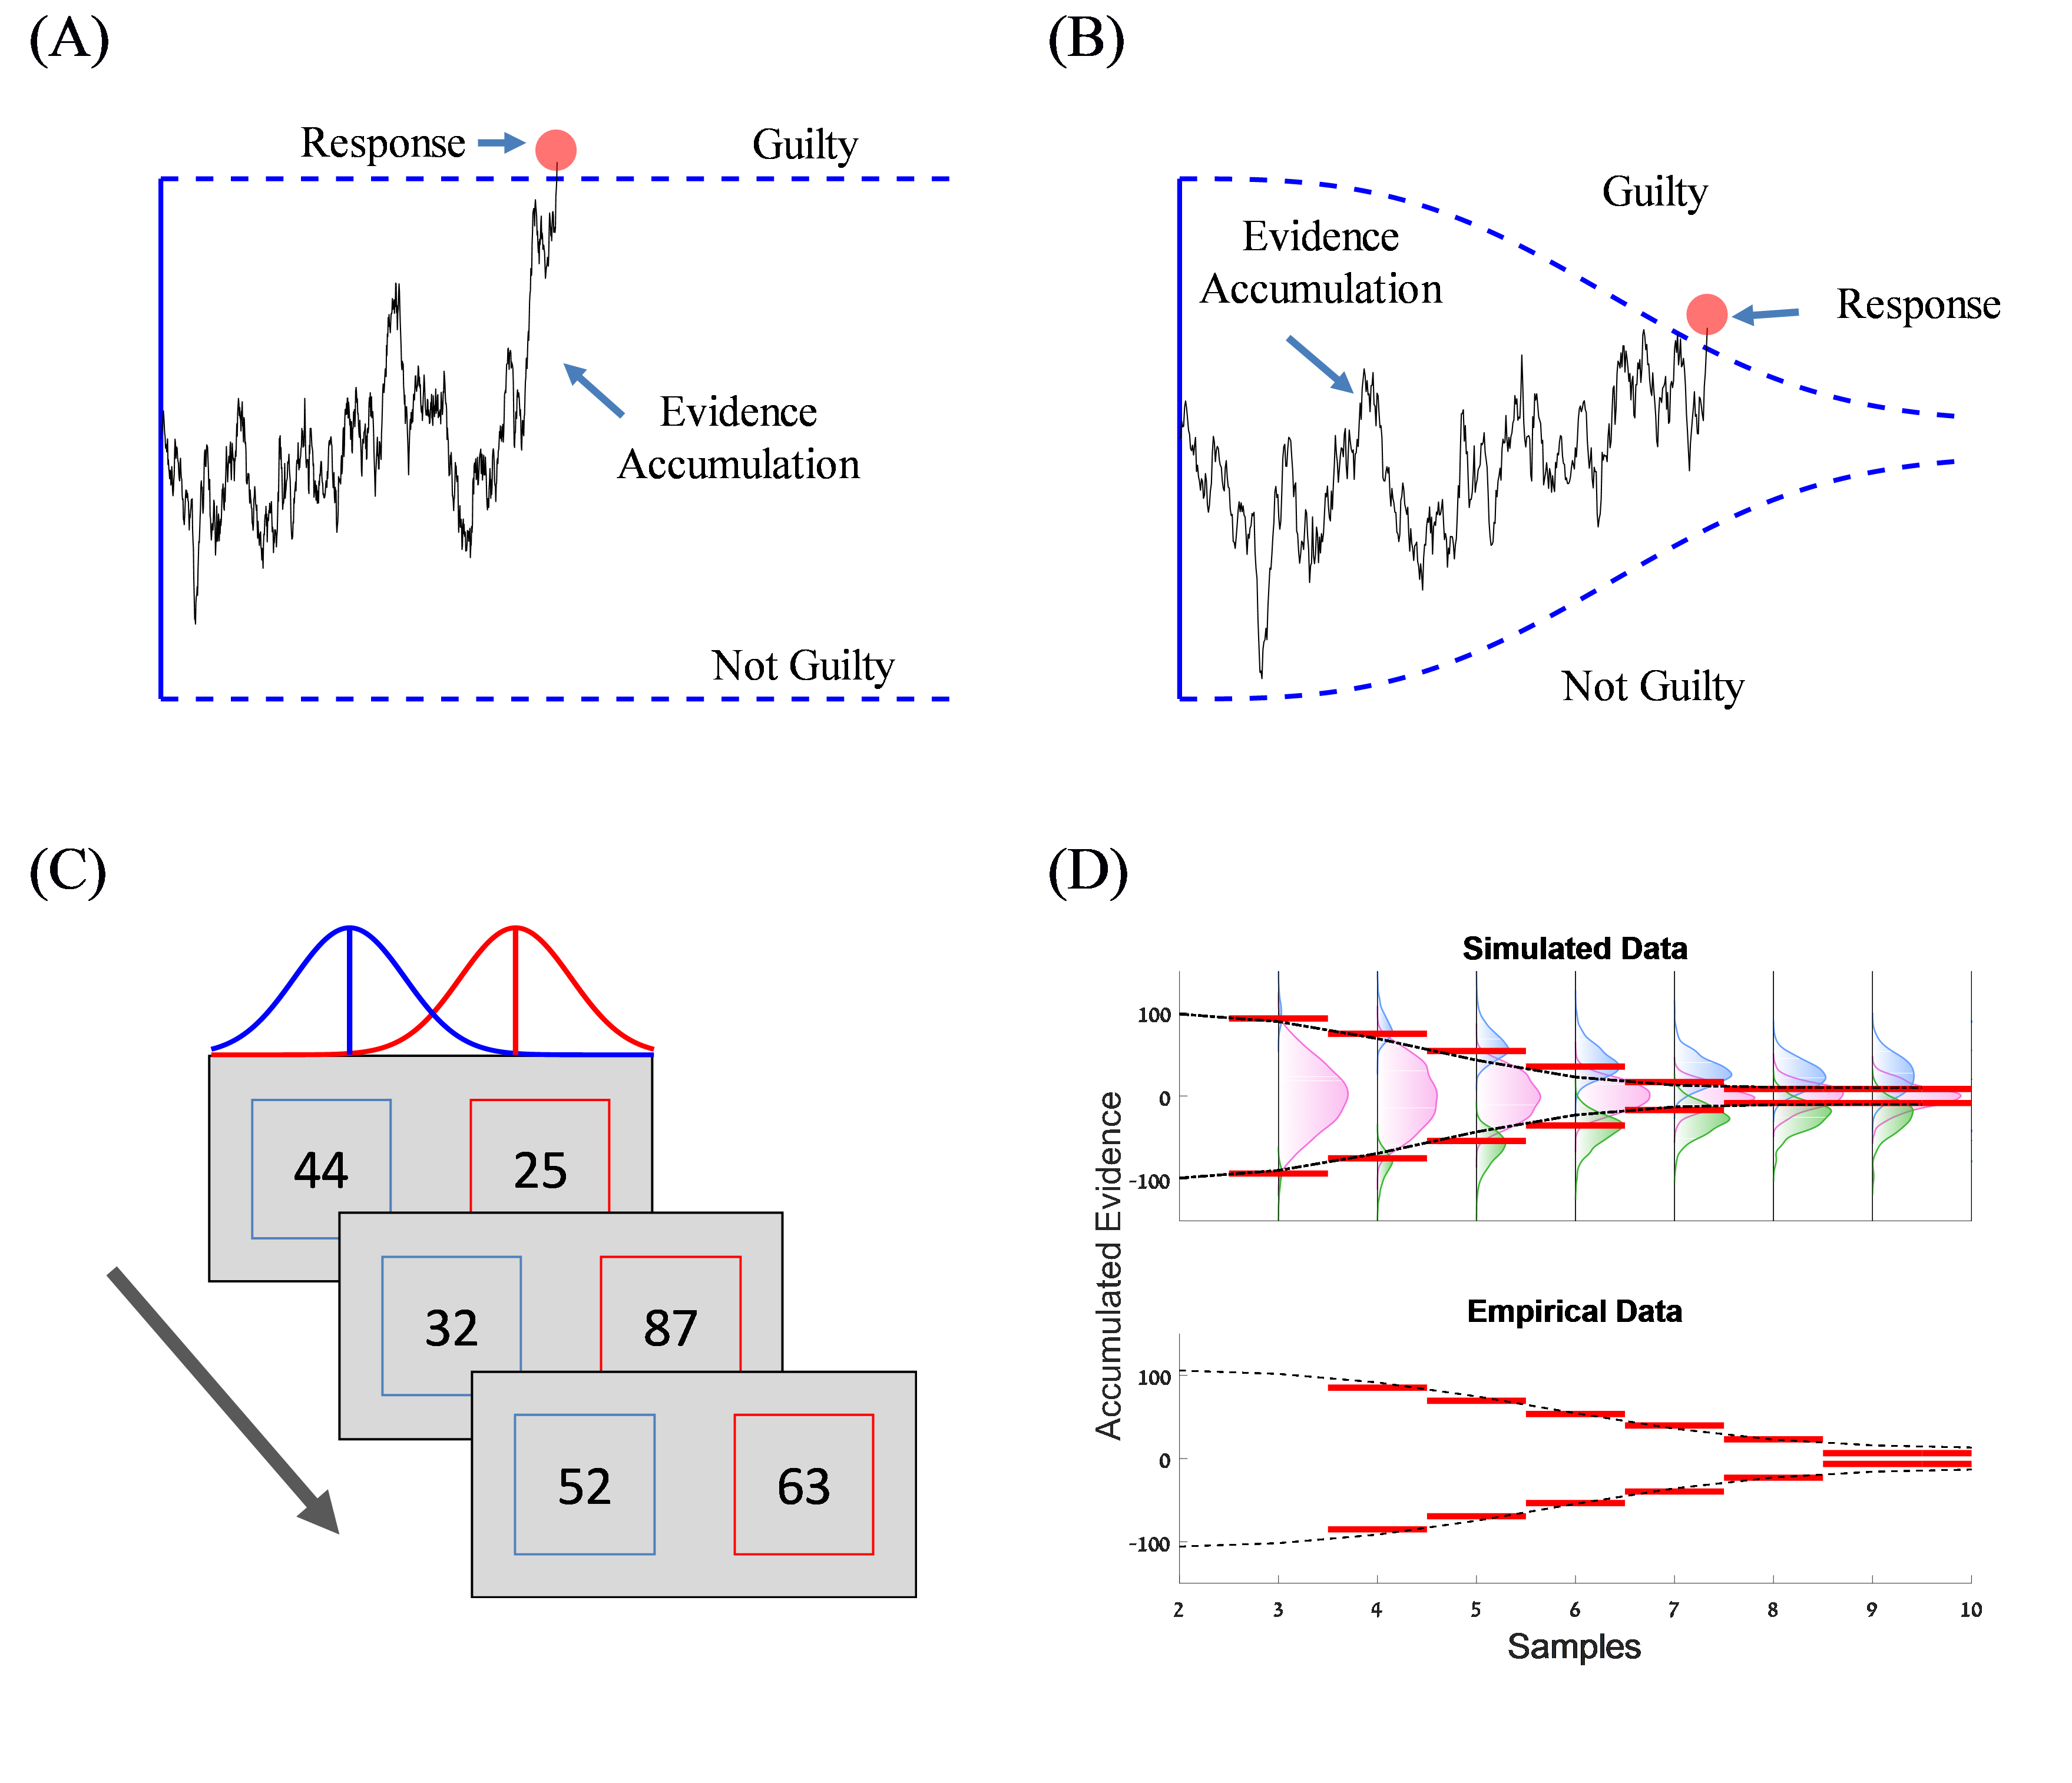
Figure 1. Integration-to-boundary and experimental paradigm. (A) Schematic illustration of the integration-to-boundary algorithm. Evidence is integrated towards a decision boundary. Decision is triggered when the accumulated evidence reaches one of the decision boundaries (guilty or not-guilty). (B) Evidence integration to a collapsing boundary. As time elapses, less evidence is required to reach a decision, and as a result accuracy is decreased. (C) Experimental paradigm. Participants were presented with pairs of numerical values sampled from two overlapping Normal distributions, and were asked to choose which sequence was drawn from a distribution with a higher mean value. (D) Upper panel: Model-free extraction of the decision boundary for simulated data (red lines). The black dashed line corresponds to the original boundary with which the model was simulated. The pink distributions correspond to data points within each trial in which the simulated participant continued sampling, while the blue and green distributions correspond to frames in which trials were terminated. The total area under the pink, blue and green distributions was normalized for each frame. Lower panel: Extraction of the decision boundary for a representative participant using our model-free method (red lines), and the traditional model-fitting procedure (black line). Both methods show high agreement, and suggest that the boundary collapses across time.
Humans assign higher weight to information that is consistent with preceding evidence
In this study, we identified a novel integration bias, which is associated with confirmation-bias, but operates during, rather than after, the formation of a decision. We labeled this bias, consistency-bias, as it modulates the relative weighting assigned to each sample of evidence, based on its consistency with preceding samples of evidence (Figure 2A, dark blue line). Thus, we find that the same piece of evidence receives a higher weight if it comes after a piece of evidence favoring the same alternative (rather than one favoring the opposite alternative). For example, a judge will give more weight to evidence supporting the guilt of a defendant, if it was preceded by other evidence in the same direction. The consistency-bias was robustly observed in a wide range of experimental conditions, such as different types of stimuli (numerical values, bars and arrays of dots), presentation rates and response protocols.
Notably, consistency-bias did not affect only the decision accuracy (Figure 2B), but also altered the confidence participants had in their decisions, such that consistent evidence facilitated high decision confidence (even after controlling for the total amount of evidence; Figure 2C). Critically, consistency did not merely exert a biasing influence on confidence, but improved participants' meta-cognitive abilities as measured by confidence resolution (i.e., confidence in correct responses compared to confidence in error ones). Indeed, the difference in confidence between correct and incorrect responses was higher when the evidence was consistent than when it was inconsistent.
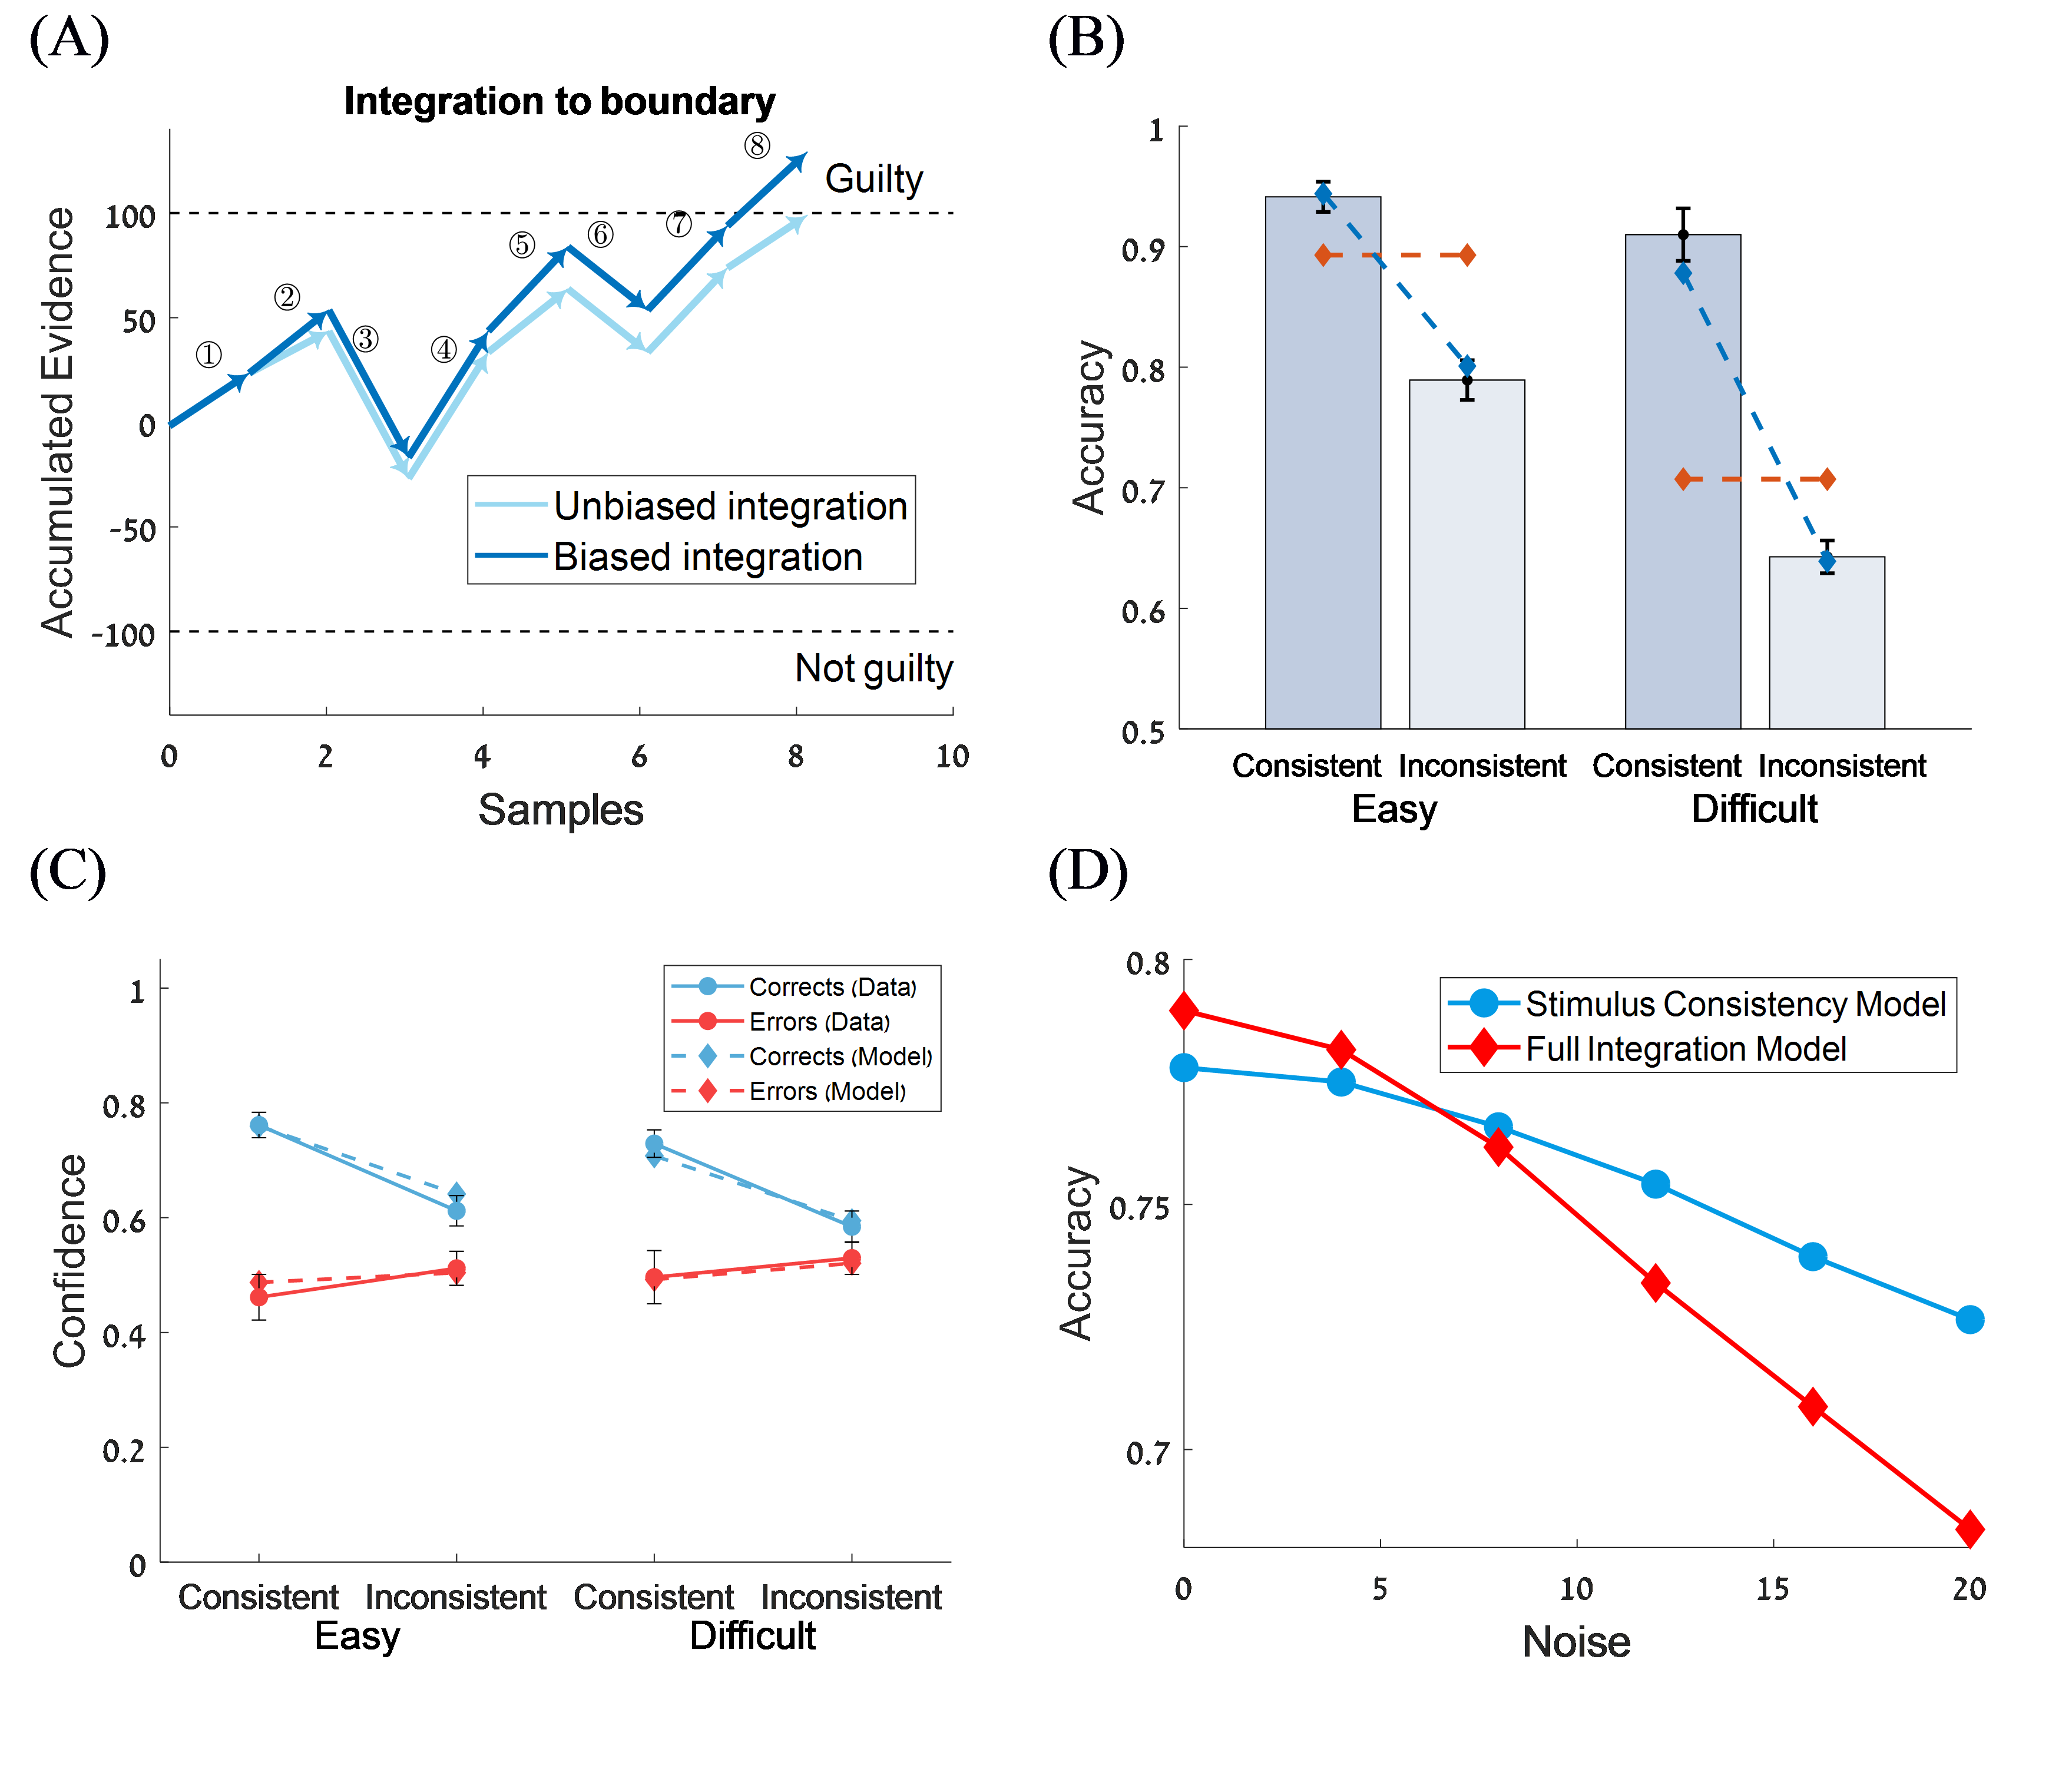
Figure 2. Stimulus consistency bias. (A) Illustration of the stimulus consistency bias. The light blue line corresponds to unbiased integration process, while the dark blue line corresponds to a biased integration process, whereby pieces of evidence which are consistent with previous ones (1st & 2nd; 4th & 5th; 7th & 8th samples) are given higher weights. Circled numbers correspond to the serial position of the samples. (B) Choice accuracy as a function of difficulty (separation between the sampling distributions: easy vs. difficult) and consistency (changes in the direction of the evidence: consistent vs. inconsistent). Participants were more accurate in consistent than in inconsistent trials, both for the easy and difficult conditions. This pattern of results was accounted for by a model assuming stimulus-consistency bias (dashed blue lines), but not by a full integration model assuming unbiased integration (dashed red lines). (C) Confidence as a function of difficulty and consistency for correct (blue lines) and incorrect (red lines) responses. Data are shown with solid lines and circle symbols and model predictions are shown with dashed lines and diamond symbols. As shown, cognitive resolution (difference in the confidence levels of correct and incorrect responses) was higher for consistent trials as compared to inconsistent trials. (D) Accuracy as a function of noise, shown separately for the full integration (red line) and stimulus consistency (blue line) models. The full integration model produces more accurate response than the stimulus-consistency model for low levels of noise, however, the opposite pattern of results is obtained for high levels of noise, suggesting that in the latter case the consistency bias provides protection against integration noise.
Consistency bias can mitigate the corrupting effect of noise
These results raise the question of why do humans give more weight to consistent pieces of evidence? At face value, this distortion introduces a gap between the accumulated evidence and the actual evidence and thus should reduce accuracy. Indeed, this is the case in the absence of (or for low) levels of integration noise (i.e., noise arising during decision formation). However, in our study we show that as noise increases, the consistency modulation makes the decision mechanism more robust to the corrupting impact of this noise (see the cross-over between the red and blue lines in Figure 2D). This happens because evidence samples that are consistent with their predecessors are more likely to carry stronger evidence in favor of the correct alternative. Thus, inflating the weight of consistent evidence provides extra protection from the corrupting effect of accumulation noise, resulting in increased decision accuracy. These findings contribute to a growing literature on biases in information-processing being ‘paradoxically’ adaptive, as they counteract the corrupting influence of noise processes in the brain.
Summary and future research directions
In conclusion, in the present study we unraveled a novel evidence integration distortion, associated with confirmation-bias, whereby incoming evidence is modulated based on its consistency with preceding information. Strikingly, despite its seeming sub-optimality, the consistency-bias fosters performance by enhancing robustness to integration noise. Future studies should investigate to what extent consistency and confirmation biases are related, and whether and how consistency bias is related to a broad range of individual traits such as the need for cognitive closure, political radicalism and dogmatism, or to psychiatric conditions such as obsessive compulsive disorders. Finally, future research in neuroscience can identify the brain mechanisms and neural circuits underling the consistency bias we report.
Follow the Topic
-
Nature Human Behaviour

Drawing from a broad spectrum of social, biological, health, and physical science disciplines, this journal publishes research of outstanding significance into any aspect of individual or collective human behaviour.
Please sign in or register for FREE
If you are a registered user on Research Communities by Springer Nature, please sign in