Evolving antibiotic resistance: a cheap spatial ecology lab
Published in Ecology & Evolution

Just some observations that led us to this paper on antibiotics...
Consider the following rationale for treating patients with antibiotics.
It seems obvious enough: the more antibiotic we use the lower the number of pathogens we see, so the fewer the mutations that arise and, therefore, the lower the likelihood of seeing drug resistance mutations during treatment of a patient. (Click here for a study of how drug resistance can arise during a clinical antibiotic treatment - so we know it does.) This is the key idea for treating with antibiotics.
But we can't sustain antibiotic dosages at high levels everywhere, all the time, so what might be good for one patient has downstream consequences for the rest of us. Eventually, if the drug molecules don't degrade too quickly, some bacteria will come into contact with those molecules in concentrations where there will be enough cells around for evolution to happen. This might occur within a patient, or it might be in a puddle somewhere.
But, as we often wonder in our lab meetings, is it true that if we ply bacteria with antibiotics at high levels, they cannot evolve drug resistance? To test this, Carlos Reding, a post-doc in our lab, and Jessica Plucain, who used to work in our lab, performed an experiment using several antibiotics at different dosages, producing datasets like the following image where they used the drug streptomycin:

Figure 1. This image shows sizes of replicate E.coli populations stacked row-by-row in a heat map where the populations have been propagated day-by-day for 7, 24h-long seasons: white is hot (denoting large population sizes) and black is cool (for low population sizes).
Black-to-white transitions from left to right show adaptation to the presence of the drug because population sizes are increasing with each round of treatment.
Each row in the data shows a different replicate population cultured for 7x24h at various drug doses: first there is the data above the '1xMIC' marker, the clinically relevant concentration, and the same for 2xMIC and 4xMIC. The latter are double and quadruple clinical dosages, respectively.
If no drug is present in the culture (like the 4 rows at the bottom where it says 'no drug') we get lots of E.coli so the data is white hot. In the rows in the '1xMIC' zone we see darker spots representing smaller populations that become hotter by the day - so resistance may be evolving here. In the '2xMIC' zone we see the columns of data getting hotter by the day, but not quite as hot as when no drug is used and only a few of the replicate populations are heating up. At 4x clinical dose we barely see any growth at all - the squares are black.
This answers our lab's question: we can detect growth at high dosages but there is less of it (apologies, no P-value here) and it takes a few days of treatment to show up.
Carlos and Jessica repeated this experiment using 7 antibiotic classes and doxycycline showed a similar effect, as the following image shows:

The data even looks quite 'hot' in the 2xMIC zone of doxycycline by the 7th round of treatment (called seasons in the image).
We thought we'd dig into this a bit more by studying a strain of E.coli by propagating it for about a week of treatment but now using a wider range of drug concentrations, from low to high.
While trying to make sense of what we might find, we started to think a little more about the basic ecology of antibiotics. After all, antibiotics decrease the E. coli population size (a.k.a "K" in the world of ecology) and growth rate (a.k.a "r") by design, so would mutations restore growth rate during a drug treatment, or population size, or both?
Note here that a larger K does not necessarily mean a larger r (although some data analyses in the literature do assume this - it's the ones that take a log of K, divide by time, and call it r). We mean something else: for us r is the largest per capita growth rate experienced in exponential phase throughout the period of growth and K is the largest observed population size, so r and K are not linked in any way. A high K population could have low or high r values, and vice versa.
Our heat map data doesn't tell us how r and K are related but we reasoned from some old ecological theory that we might expect a tradeoff: mutations that restore r could see K go down and vice versa. As our reviewers for this paper were at pains to point out, rK theory has fallen out of favour in recent years but there was still no harm in measuring r and K in the lab and seeing what drug resistance mutations do to both of these measures of population growth.
Mark Hewlett, a PhD student at the time and now officially "a PhD", again applied doxycycline at a high 2xMIC dose to E. coli and noticed that growth rate 'r' was restored during treatment to the same value that the un-evolved 'ancestral' E.coli had when cultured with no drug. This figure taken from our paper (with some edits) shows that:
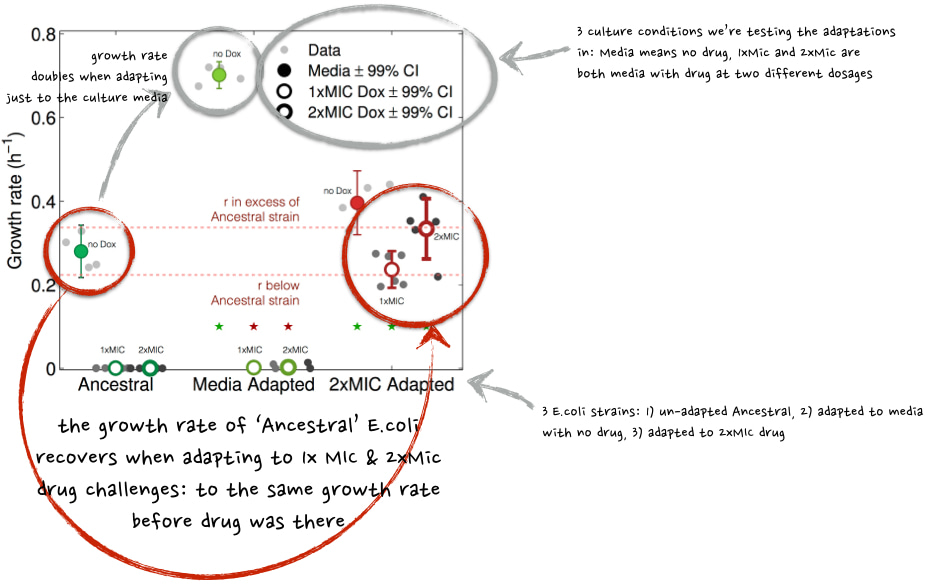
Figure 2. This is what we expected to happen: data in the two red circles show that 2xMIC (i.e. high drug)-adapted populations recover their growth rates (r) in the presence of antibiotic.
And so should population size (K) take a hit then, as a side effect? Or not? It turned out that K did not take a hit - not at all: this image shows not only does K not go down, it goes up!
And to 3 times the value of the un-evolved 'Ancestral' strain of E. coli which sets the benchmark:
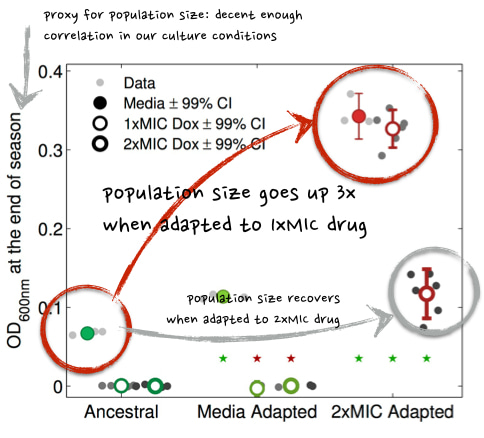
Figure 3. Population sizes of high-drug adapted populations are higher than the ancestral strain, the data in the red circles shows this, when the assay culture conditions are 1x MIC or just media with no drug in it at all. In 2xMIC culture conditions, the population size of the 2xMIC Adapted strain is the same as the Ancestral strain cultured in the absence of drug - which makes sense.
In other words, the data says that a high-drug adapted population will see an increase in population size when the drug is reduced in dose or even taken away.
So it seems that drug resistance mutations can both increase growth rate and population size. But what are those mutations?
The genomic changes of the high-K, drug-resistant strains that Mark uncovered are interesting: the strains have gained an efflux pump operon but lost an entire prophage, called dlp12. This is a large piece of E.coli DNA (20Kb, or so) that was deleted from the chromosome only in the drug-treated populations that were able to grow to high densities in the presence of doxycycline. This prophage is known to aid in stress resistance, but we're still not entirely sure why losing it was quite so beneficial in our study - the loss of lysins from within that prophage?
Our finding that r and K can be boosted, through evolution, by the presence of an antibiotic led us on a quest to study the relationship between r, K and antibiotic resistance in more depth. We needed to revisit several ideas about r and K and we developed a brief mechanistic theory of r and K relationships which shows that they don't need to trade off at all.We managed to corroborate this theory in a variety of strains of E.coli and using clinical strains of the fungal pathogen, Candida albicans. Interestingly, the rK relationships we found seem to have properties that depend on whether the strains were isolated from diabetic or non-diabetic patients. In fact, our theory never seems to fail and, at this point, we've used about 7 or 8 different species in the lab to test it, although most of the data remains unpublished.
This project originally started with a desire among various people who passed through our lab (including Rafael Pena Miller, Ayari Fuentes Hernandez and Fabio Gori - who all helped out with various bits of kit, data and code) to look at drug-resistance adaptation that takes place in experiments routinely performed in hospitals. Like the one shown in the following image:
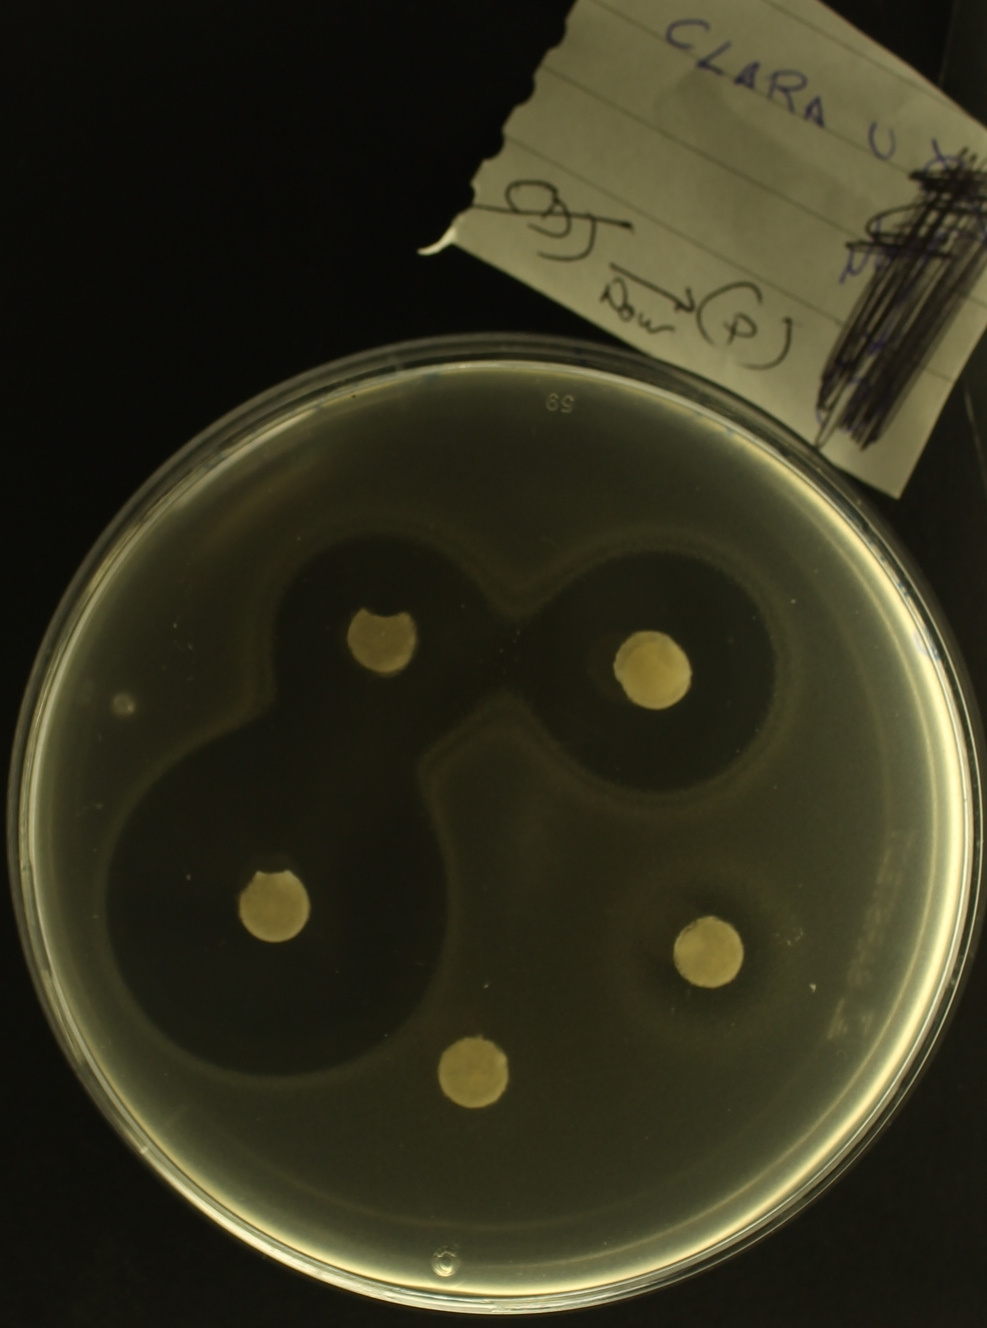
Figure 4. A home-made antibiogram that shows how susceptible E.coli is to a penicillin drug, except that 'Clara U' is an undergraduate at the University of Exeter that produced the image - this didn't come from a hospital.
In the image the white paper disks contain antibiotics that diffuse out into the agar which prevents the bacteria from growing, producing a dark region around the disk called a 'zone of inhibition'. Some disks are soaked with lots of drug whereas other disks contain very little, which explains the different sized zones of inhibition. Notice, if you look closely, how the border between the dark and light areas seem to have 'double halos'. This is what we were so interested in studying before we found ourselves waylaid by experiments about rK evolution in different antibiotic dosages that don't even have this clinically-relevant spatial feature to them!
It might seem strange to say this, given this is a 'Behind the Paper' blog entry of a published article but several things have stopped us from performing the study we really want to. First, we needed some way of reading the spatial location of different bacterial strains on an agar plate. So, to remedy this, we made a device to do this and it produced the following image in which E.coli has been tagged with two different coloured proteins, one yellow and one blue:
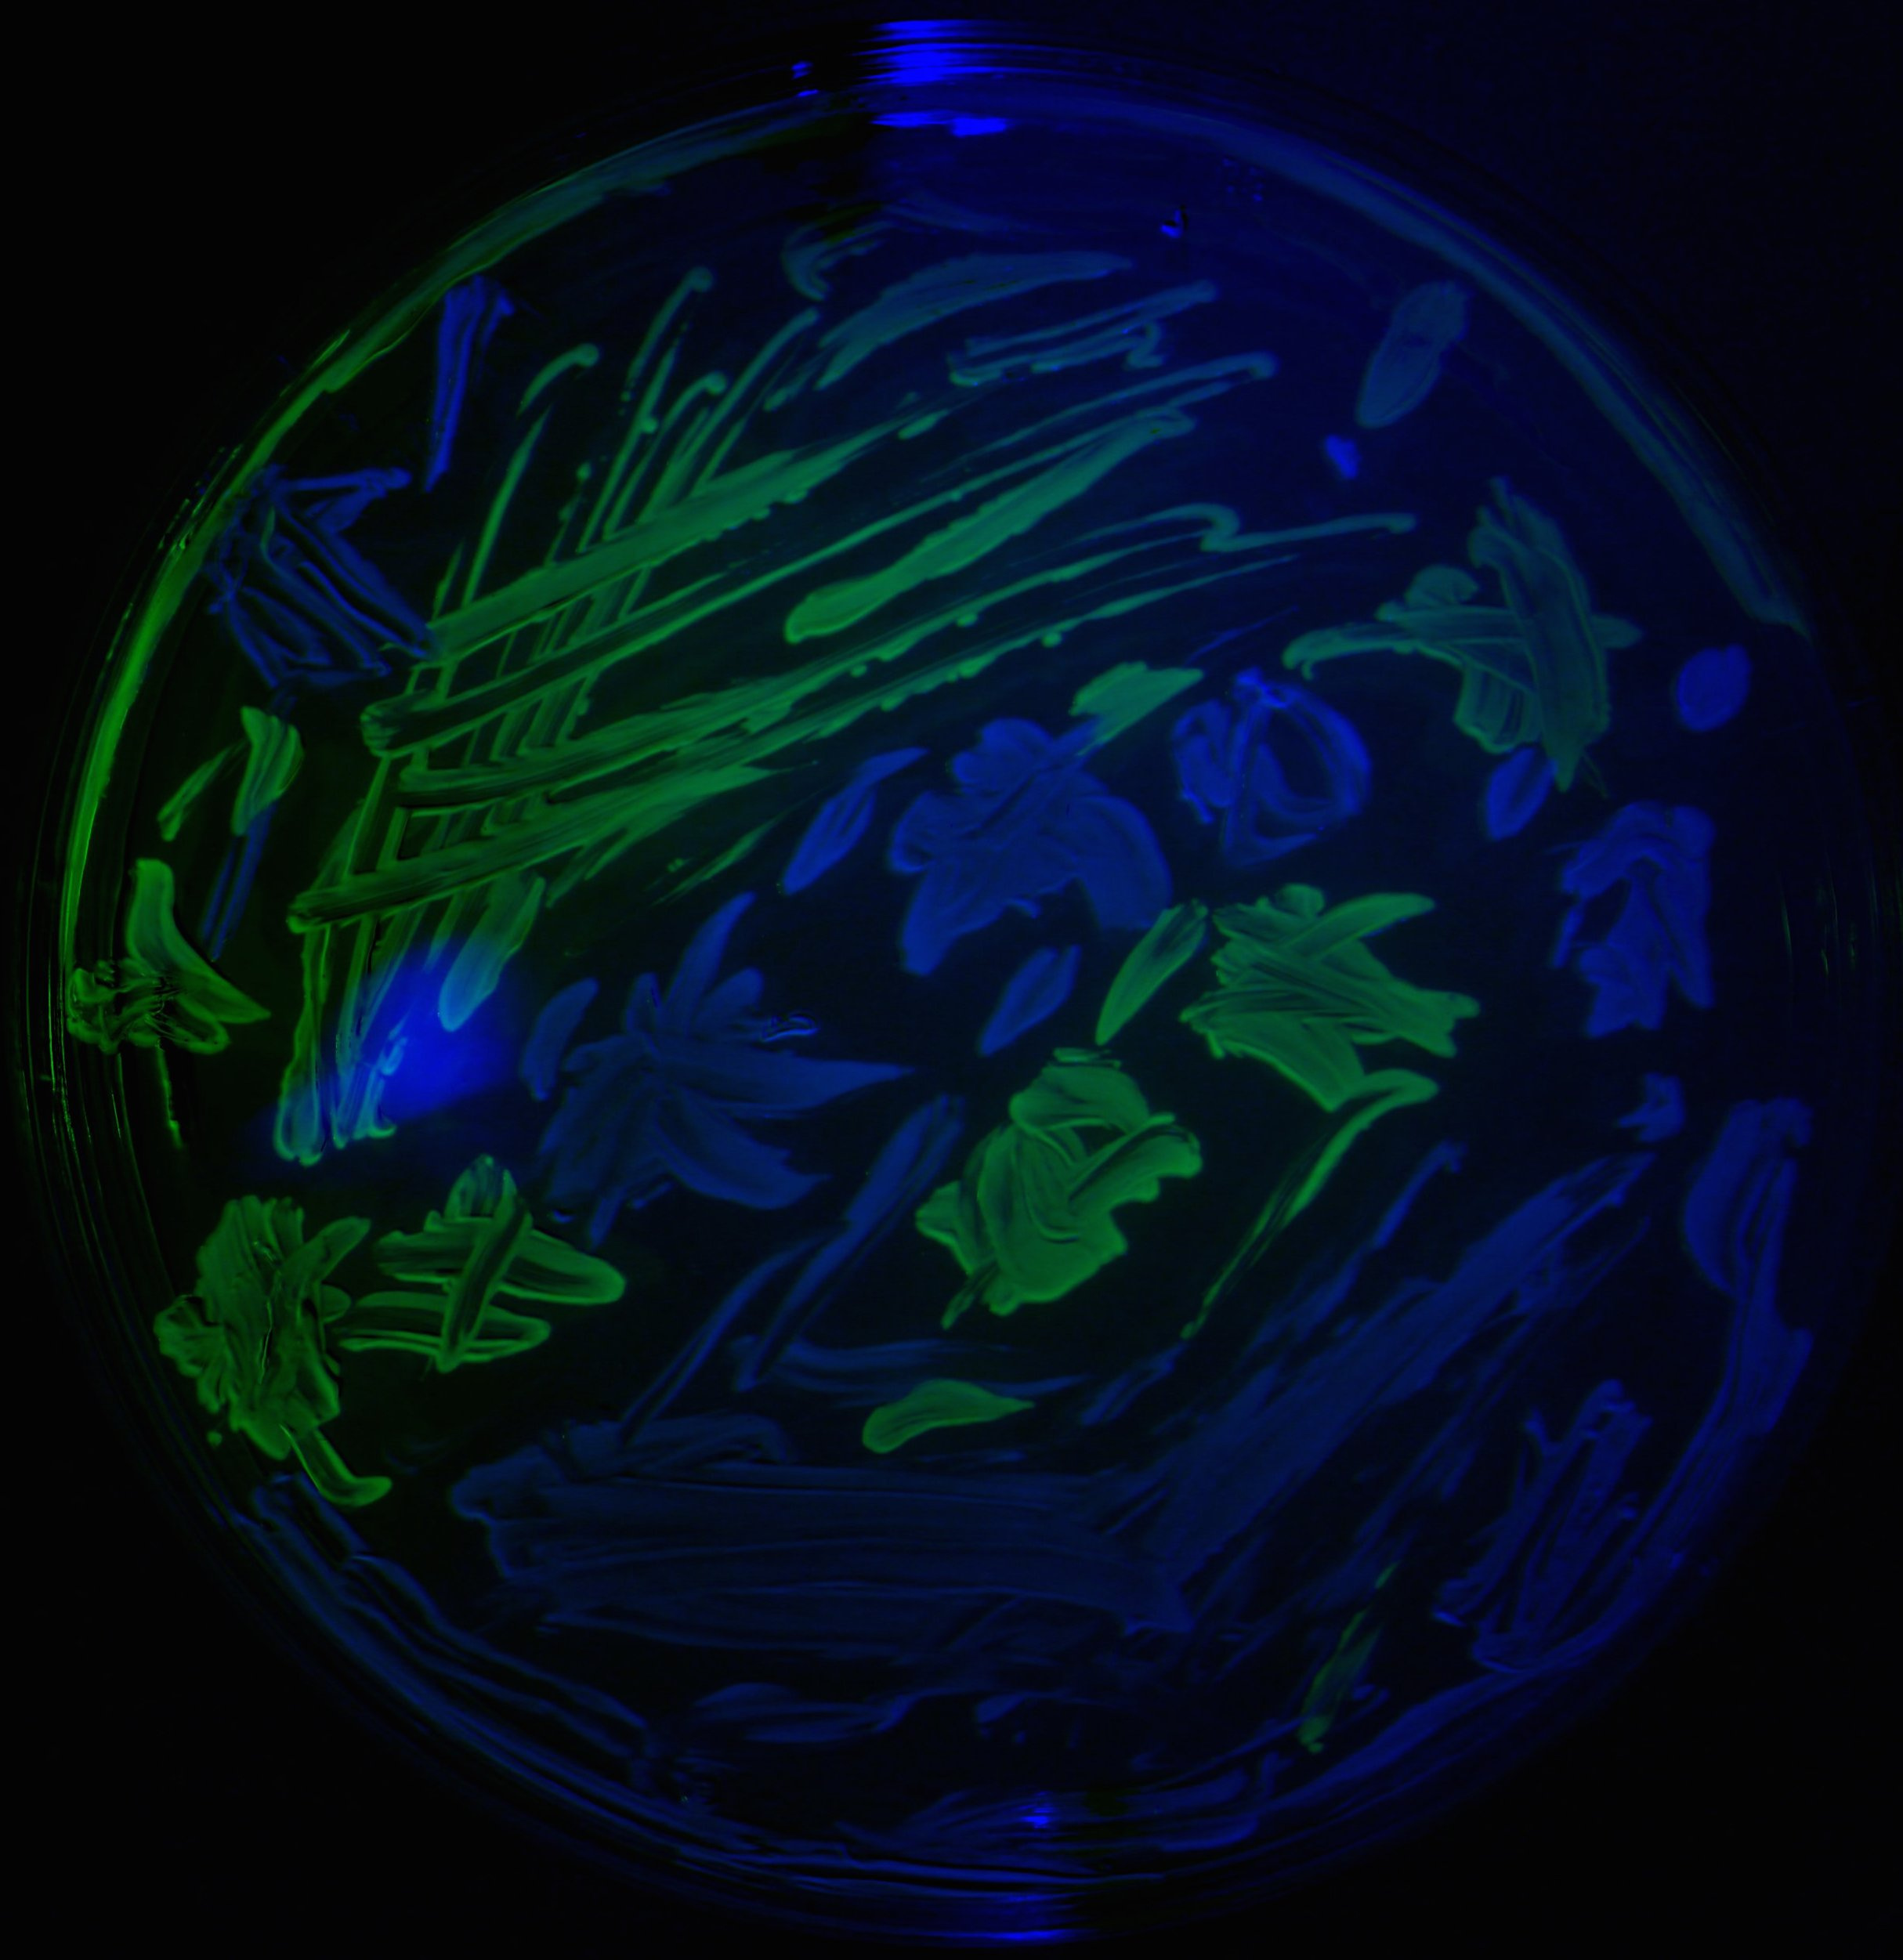
Figure 5. The yellow and blue E. coli are clearly visible (and spatially segregated by the experimentalist, Carlos again) in this image.
This device of ours is a very low-cost thing, little more than a webcam, some light filters and a servo-controlled small robotic arm. Which is handy, particularly since our lab almost ran out of funds halfway through this study.
That unfortunate set of circumstances had a silver lining because it led us to thinking about ways we might make low cost devices that are useful for studying antibiotic resistance in ways that would make our research more sustainable when research funds are tight.
As a result of the hard work of many people in our group, we now have a few of the devices we need in the pipeline. We even have a workshop that we started rent this year to make them in - it's in the site of an disused pottery factory in Stoke-on-Trent (UK) called Spode:

Figure 6. This is our "maker lab" in Stoke the day we moved the furniture in. The second thing we did was paint a blackboard on the wall.
Although it is cheap to do in principle, the spatial ecology studies we want to do will take time - there are many things we need to get right. Like ensuring fluorescent lighting conditions are consistent across a plate and so we are making LED panels controlled by a Raspberry Pi to resolve that problem:
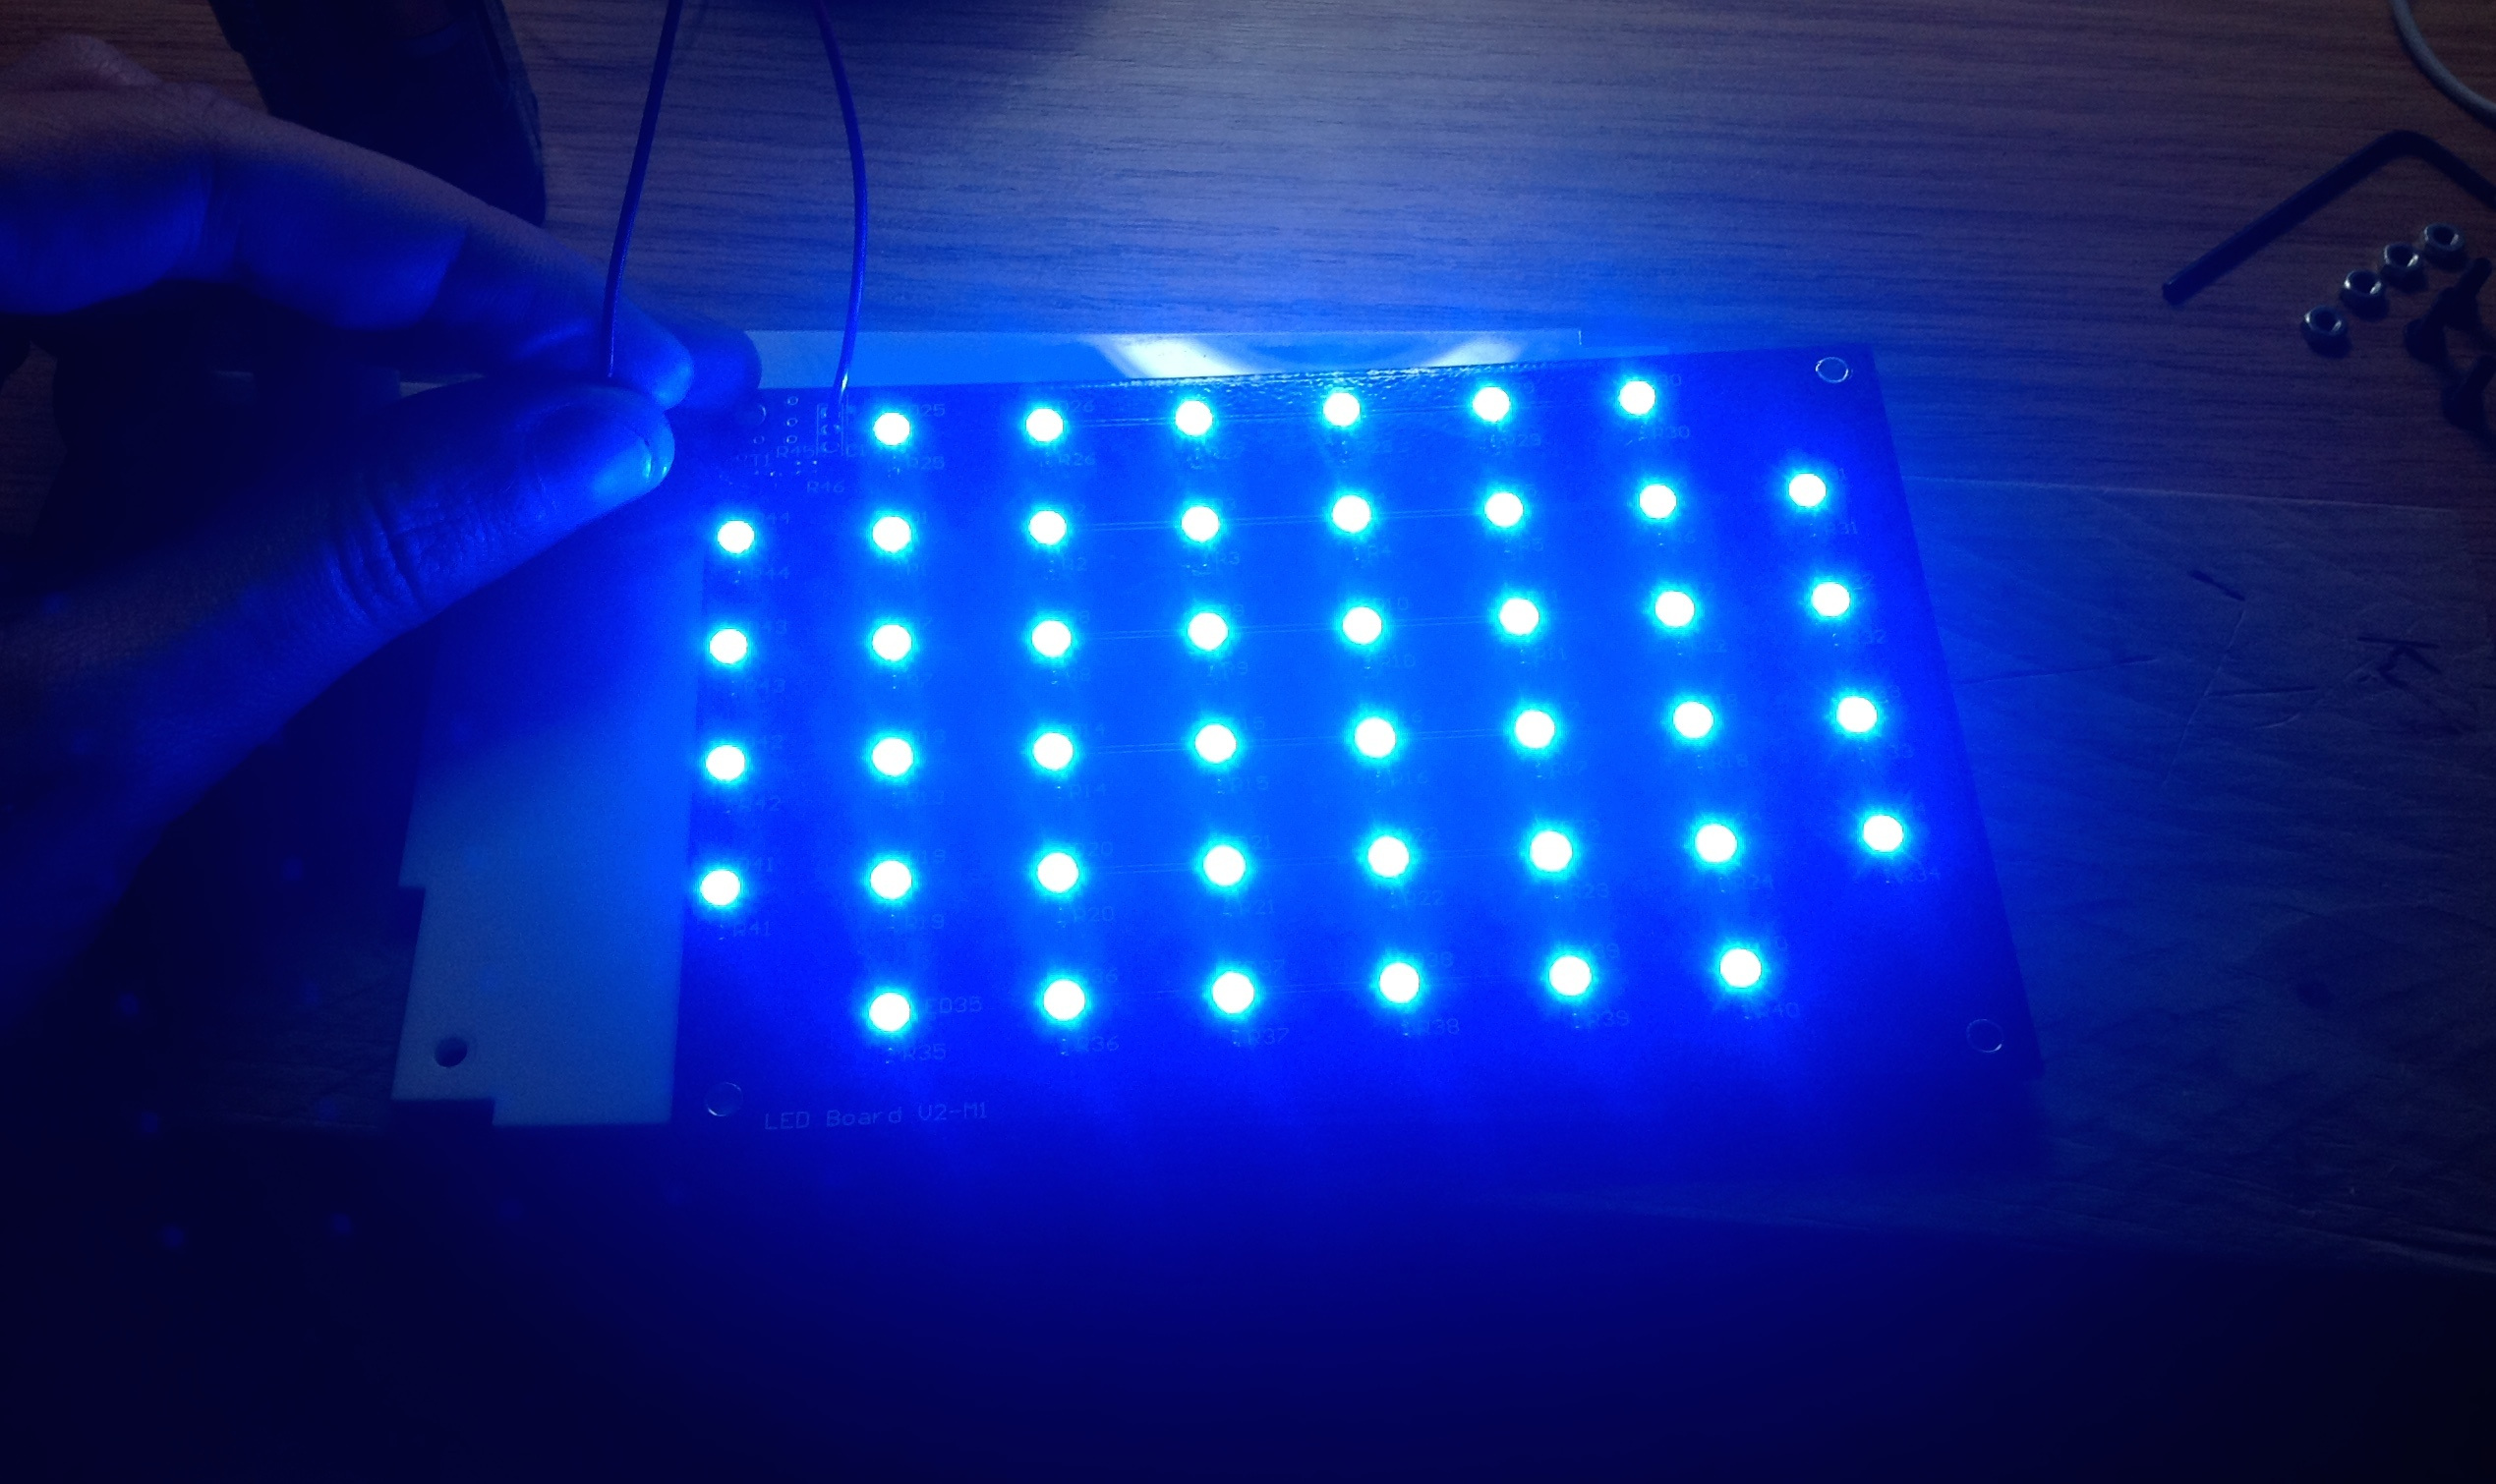
Figure 7. You can just see a hand next to a blue light LED plate
We also need to make sure that the agar conditions are as reliable as possible, without breaking the bank that is (although the purchase of antibiotic E-strips can do that - fyi!). And we can't be just using different scraps of paper for our tests. But, again, we have a cheap device for helping with that too:
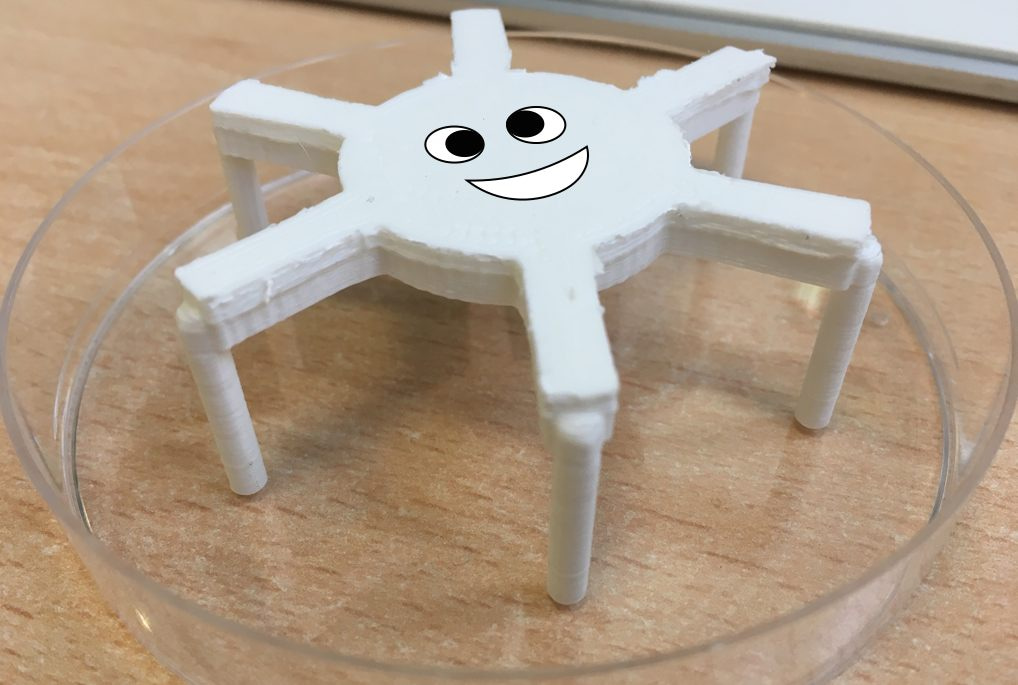
Figure 8. This 3d-printed '6-legged spider' makes holes in agar of a fixed depth, width and at uniform distances that helps with antibiotic assay repeatability.
And if you've ever used a 96-pin replicator in an evolutionary experiment, and many labs around the world do, you will know they cost upwards of £1000. But we have a design that can be 3d-printed for a $1:
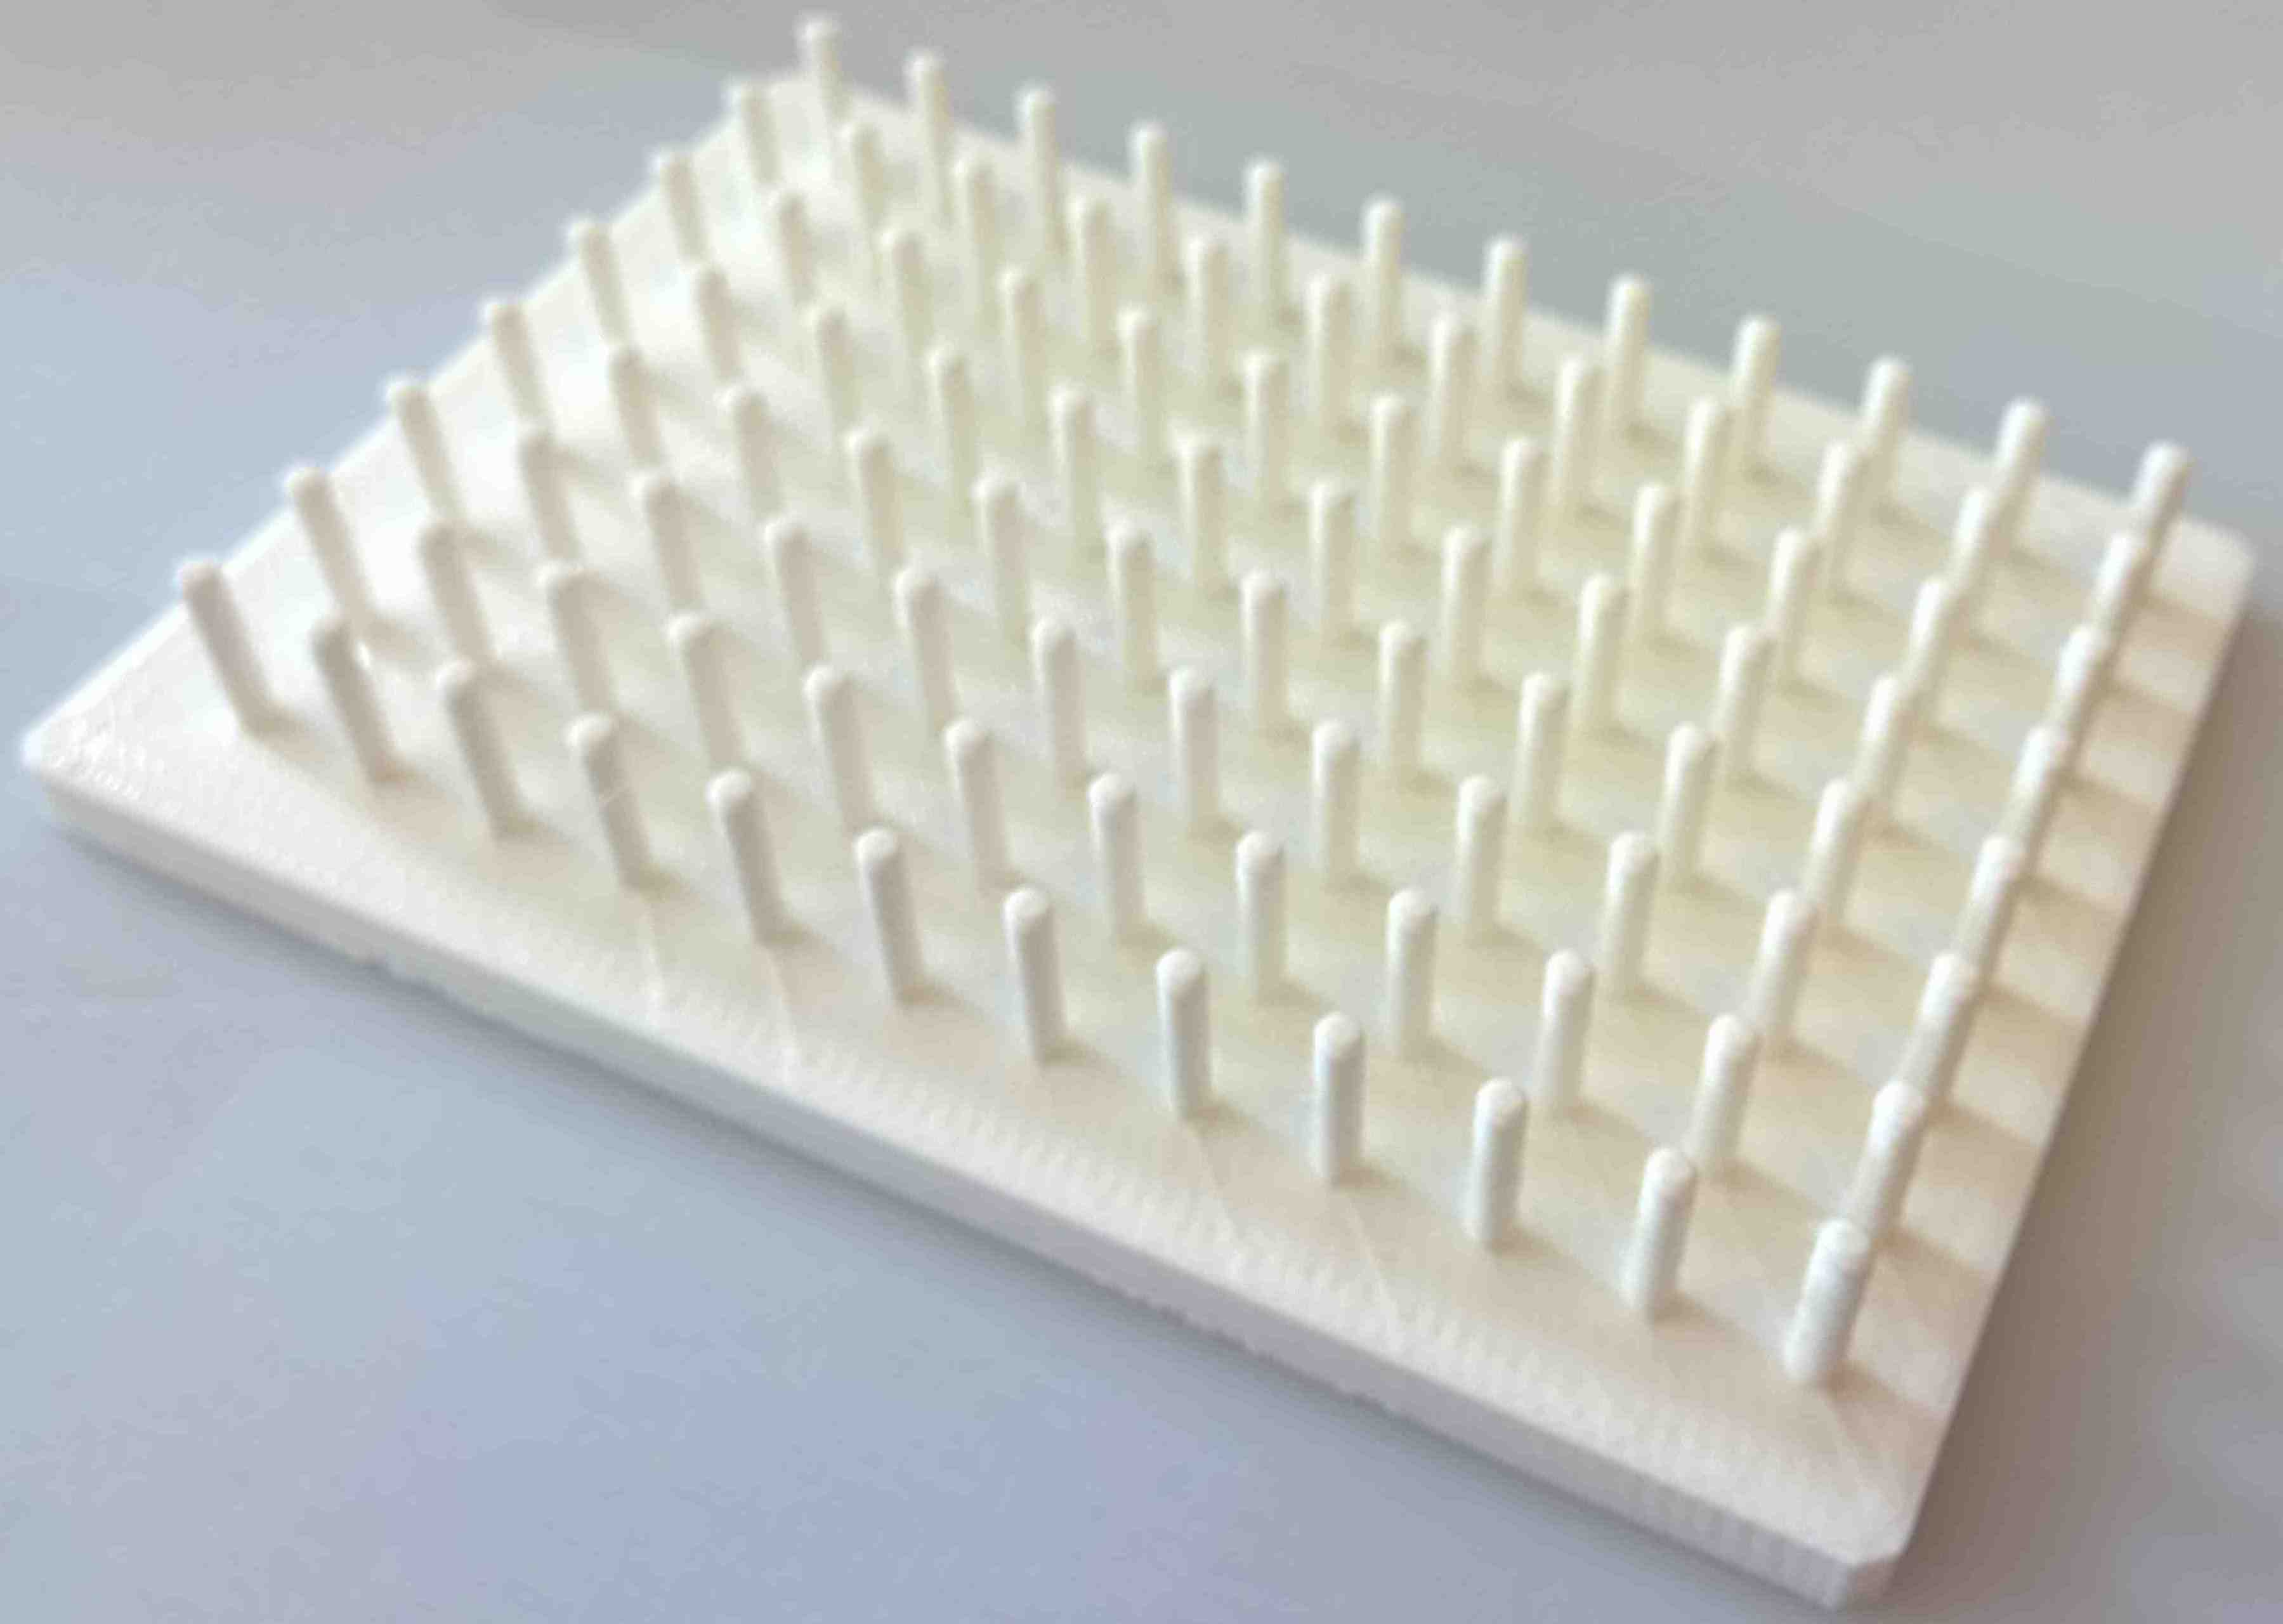
Figure 9. Each pin slots inside one of the 96 wells on a standard microtitre plate which we use to take small samples of biomass from each well.
So, hopefully, we'll be able to publish the results from one of these thrifty experiments quite soon. But we are fairly certain that, when we do, the data we'll obtain by letting E.coli grow and evolve in an antibiotic gradient on a plate of agar for 24 or 48h will be harder to understand, and much more interesting, than any hypothesis we can cook up in advance of doing the experiments.
And our lab is grateful to both the EPSRC and ERC (that funds Ivana Gudelj) who kept our work going just as we were about to run out of money with equipment repair bills mounting. Thanks too to Tim Quine (University of Exeter DVC for Education) who helped us fund the Spode maker lab that we use as a facility to help give local school students access to scientific research.


Please sign in or register for FREE
If you are a registered user on Research Communities by Springer Nature, please sign in