Global Runoff in Google Earth Engine
Published in Earth & Environment
Global runoff estimation is necessary to better quantify and verify the various components of the hydrologic cycle. Runoff response to rainfall remains a complex relationship that relies on a multitude of interweaving meteorological factors such as (type, intensity, duration, amount of rainfall), as well as land surface characteristics (vegetation, land use, soil type and structure, slope, elevation, topography). Among many existing and more complex rainfall-runoff models lies the simple Curve Number method, which is a semi-empirical engineering approach used for hydrologic modeling and design purposes. Our data descriptor published two years ago in Nature’s Scientific Data (https://www.nature.com/articles/s41597-019-0155-x) details the methodology and the validation behind generating curve numbers from soil type, land use, surface condition, and antecedent runoff conditions. We had then generated three global 250-m gridded datasets of curve numbers for each of the dry, average, and wet runoff conditions that will affect the rainfall-runoff relationship at a defined location on Earth. Since then, we have been working on turning this dataset into a dynamic application, one that allows users to automate runoff calculations on the cloud from near-real-time datasets that are continuously ingested in Googles Earth Engine, the leading planetary-scale geospatial analysis platform that provides a powerful cloud-computing environment to process big data in minutes.
How do we do it?
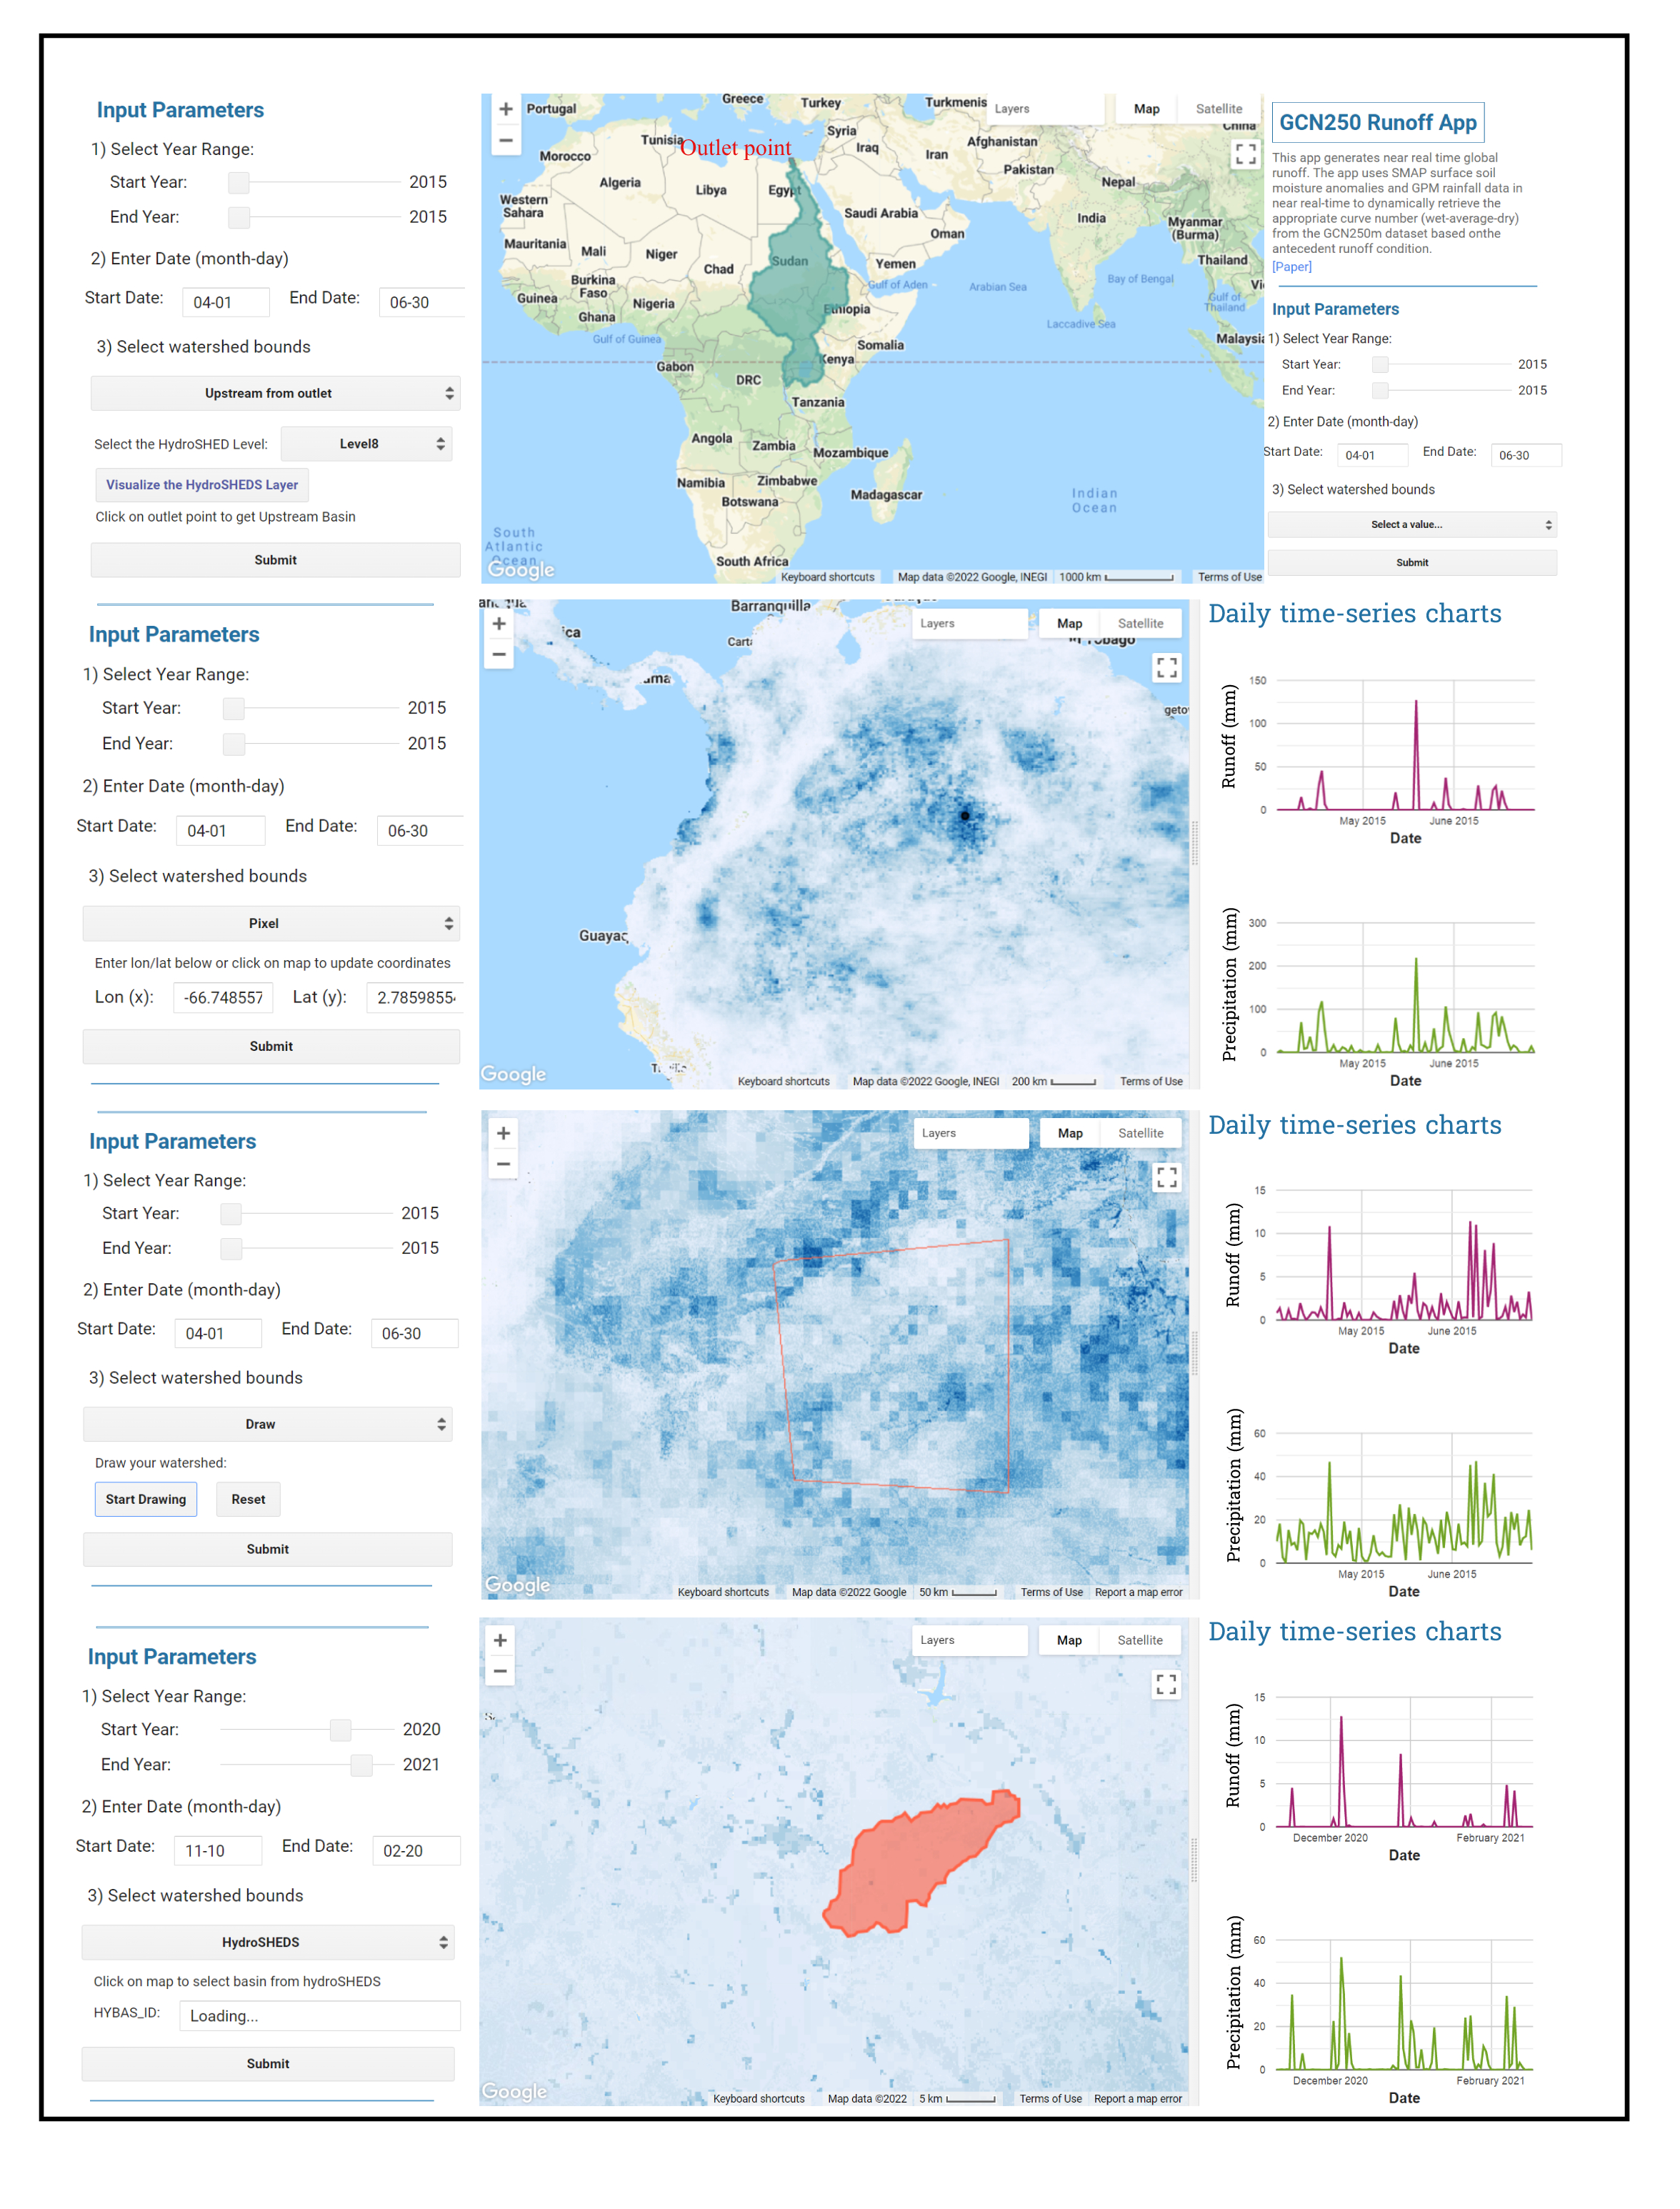
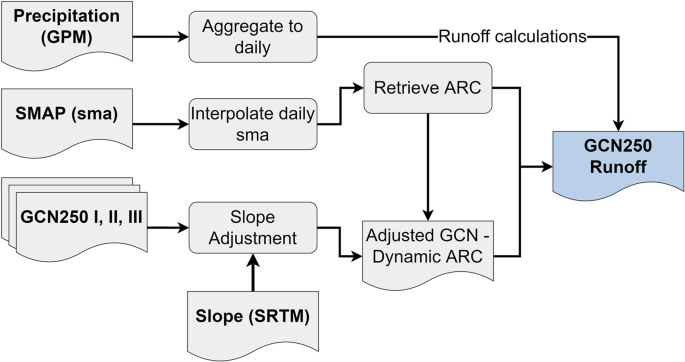
In our study, published last week in Nature’s Scientific Data (https://www.nature.com/articles/s41597-022-01834-0), we developed a readily usable method to estimate runoff at the pixel, watershed, regional, and global scale. Our runoff generator estimates surface runoff using the GCN250m, NASA’s SMAP (Soil Moisture Active Passive, an Earth satellite mission that measures and maps Earth's soil moisture) surface soil moisture anomalies, precipitation from NASA’s Global Precipitation Measurement Mission (GPM), and elevation data from NASA’s Shuttle Radar Topography Mission (SRTM). We use the SMAP surface soil moisture anomalies to dynamically retrieve the appropriate curve number dataset (we, average, dry) from the GCN250m, and we use the Global elevation data from the Shuttle Radar Topography Mission (SRTM) to adjust the GCN250m to slope. We develop a GEE application (accessible through https://jaafarhadi.users.earthengine.app/view/runoff-from-gcn250), and a monthly mean global runoff dataset (covering April 2015 – December 2021, hosted on GEE as an Image Collection https://bit.ly/3T321KH).
Developing the application was not free of challenge. First, SMAP mission measures soil moisture every 2-3 days, so we had to interpolate the values to obtain daily SMAP soil moisture anomalies that will define the antecedent runoff conditions. Finding the most suitable soil moisture anomalies threshold to be used for dynamically retrieving the antecedent runoff condition (wet, dry, and average curve number) was another challenge that we faced. We found that the best results are obtained when a range of -1.5 to +1.5 soil moisture anomalies are used.
We validate our results with daily discharge observed data from USGS streamflow, and annual runoff data from NASA’s Global Land Data Assimilation System (GLDAS) and from the European Centre for Medium-Range Weather Forecasts (ECMWF). It was a bit challenging to find watersheds for validation that are small in area so that the CN method could be applicable, as well as spread over multiple hydrologic units and have enough stream flow data record for comparison with our runoff data. Delineating upstream basins from clicked point using the hydro-basins feature collection required we use of dictionaries and create a look up for the matching basin IDs, which needed iterations as well as computational resources and time. The results show that mean annual global runoff from GCN250 and GLDAS were within 11% of each other for 2020 – 2021. Mean global runoff for 2021 was 62 mm/year. The annual runoff data for 2021 is stored on in the Figshare database (https://doi.org/10.6084/m9.figshare.19596157).
Our first of-its-kind GEE application (RGCN250) provides users with on-click time-series of runoff over the point of interest or watershed of interest. Moreover, the application delineates upstream basins automatically using the HydroBASINS product available on GEE, with an option to export the upstream basin as a GIS shapefile. Without the need to import or store any data required for runoff calculation, users can export a time series of rainfall-runoff for any watershed for an extended period of record instantaneously reducing the time and effort needed in generating runoff. We are certain that hydrologic modelling is made more efficient and effective with the availability of such global runoff dataset. We believe that the developed runoff application is a an informative and simple runoff generation tool making it of great value and interest to the scientific and practitioners’ community who may want a rapid estimate of flood estimation in ungauged basins.
Follow the Topic
-
Scientific Data
A peer-reviewed, open-access journal for descriptions of datasets, and research that advances the sharing and reuse of scientific data.

Related Collections
With Collections, you can get published faster and increase your visibility.
Computer vision in plant science and agriculture
Publishing Model: Open Access
Deadline: Oct 10, 2026
Wearable and Computer Vision Data for Health and Behaviour Research
Publishing Model: Open Access
Deadline: Aug 08, 2026
Please sign in or register for FREE
If you are a registered user on Research Communities by Springer Nature, please sign in