
When a colony of western honey bees becomes too crowded, the queen bee and ten thousand worker bees set out to find a new hive. Thousands of honey bee workers and a queen cling to one another to form a dense cluster-like "swarm" and hang from a tree branch for days until they find a new hive location. This is a precarious time in the life of a honey bee colony: if the queen bee is lost or killed, the entire colony is doomed. For decades, scientists have been investigating the behavior of swarming bees. However, since the swarm is opaque and 3D, many questions, such as how the weight of the swarm is distributed between the bees to maintain its mechanical stability, have remained unanswered. Now, for the first time, we use x-ray CT scans to image the arrangement of individual bees inside honey bee swarms and determine the laws that govern the swarm structure.
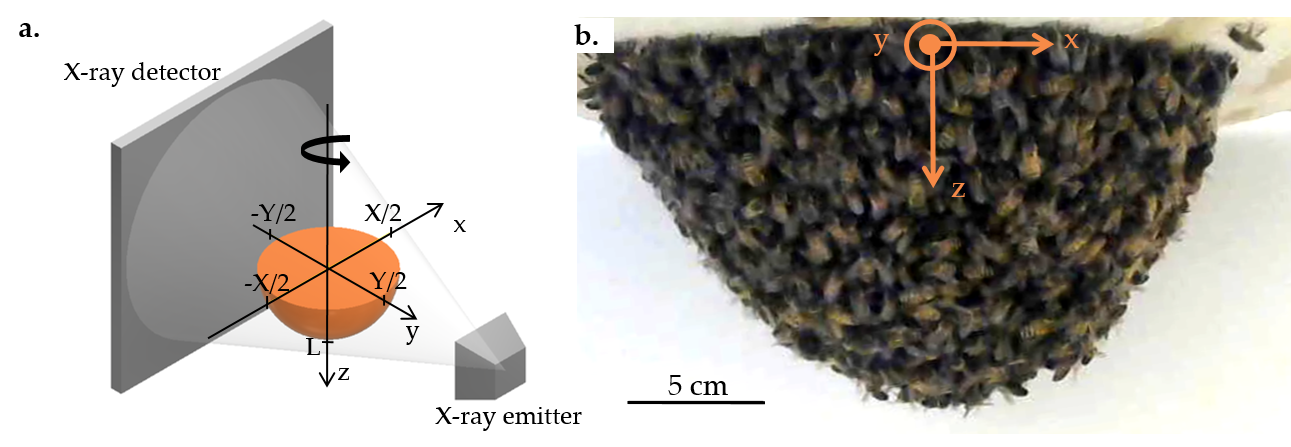
We begin our studies of the distribution of bees in a swarm by convincing the bees to build a swarm in the laboratory. We attach a caged queen bee to the center of a motorized wooden board, and the worker bees follow her pheromones to form a swarm around her. We place the swarm in between an x-ray emitter and x-ray detector, as is shown in Figure 1a. The swarm rotates about the vertical axis while the x-ray takes images. Figure 1b shows a photograph of an example swarm in the x-ray setup.
We then reconstruct 3D models of the arrangement of bees in the swarm from the x-ray images. Figure 2 shows a video of an example 3D reconstruction from different angles.
Figure 2: A 3D rendering of the swarm in Figure 1(a), rotated to show its side view, top view at the base, bottom view, and rotation about the vertical axis.
To understand how the bees in the swarm, particularly those in the top layer, support the weight of all of the other bees, we first look at the distribution of bees in the swarm. We find that the layers near the base of the swarm are the most densely packed and have the largest area, forming a supporting layer of bees for the swarm. These bees support the bulk of the swarm, but they are not overloaded: on average, a bee in the top layer supports the weight of 3.8 other bees. This is about ten times less than the maximum grip strength of the connection between two bees.
Finally, we find a scaling law that describes the distribution of bees within the swarm. We plot the weight supported by each layer, W(z), as a function of the mass of each layer divided by the layer thickness, M(z), on a log-log scale in Figure 3a. We find that there is a power law scaling between W(z) and M(z):
W(z) ∼M(z)a
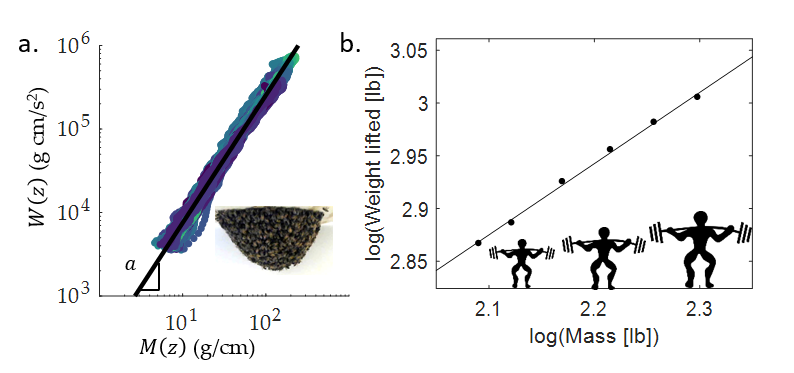
For all of our sample reconstructions, we find that a=1.53±0.12. There is no relationship between that exponent and the mass of a swarm, suggesting that both small and large swarms have the same structure. Similarly, studies show that the maximum weight a person can lift scales with the person's mass to the ⅔ power, as in Figure 3b (Lietzke, 1956).
How does a ≈ 1.5 arise? We use a force balance model of the swarm and dimensional analysis to show that this exponent results in each horizontal layer of the swarm exerting the same fraction of its maximum strength. If the swarm's mass distribution had an exponent of a < 0 or a →∞ , the top layers of the swarm would use a much greater fraction of the maximum strength, putting larger swarms at risk of collapse. If the exponent was 1 <a < 1.5, the swarm would approach one flat layer of bees with each bee only supporting its own weight, which would have an advantage in mechanical stability. However, a swarm with this mass distribution would be either a very densely packed flat layer or a very wide flat layer, putting the bees at risk of predators and making thermoregulation challenging.
In this study, we take the first x-ray CT scans of a swarm of honey bees to show how the swarming bees remain mechanically stable while maintaining a clusterlike shape that protects the individuals inside. We also find that a simple power law governs the distribution of bees in swarms of all sizes. This power law is unique in that, unlike other known power laws that describe the metabolic rate or weightlifting capacity of organisms based on their mass, our power law describes the strength and mass distribution within a superorganism. This is only the beginning of potential applications of x-ray CT scans to understanding the structure of honey bee swarms, and there is much more to be learned about the behavior of individual bees inside swarms at different environmental conditions.
Read the full study here: https://www.nature.com/articles/s41598-022-21347-5
References
Lietzke, M. H. "Relation between weight-lifting totals and body weight." Science 124.3220 (1956): 486-487.
Follow the Topic
-
Scientific Reports
An open access journal publishing original research from across all areas of the natural sciences, psychology, medicine and engineering.

Related Collections
With Collections, you can get published faster and increase your visibility.
Phytochemicals and health
Publishing Model: Open Access
Deadline: Jul 28, 2026
Health Policy and Systems Research
Publishing Model: Hybrid
Deadline: Jul 14, 2026


Please sign in or register for FREE
If you are a registered user on Research Communities by Springer Nature, please sign in