In recent years, great efforts have been made by academics, journals, and funding bodies to encourage researchers to make their data openly available. As the reproducible science movement has gained traction, however, it has become clear that having access to original study data is not sufficient on its own to reproduce a result. Without knowing what steps authors took to wrangle their data, reproducing a result is still disappointingly difficult. Yet very few studies make their code available, and among those studies that do, even fewer enable others to reproduce their results (or even run at all).
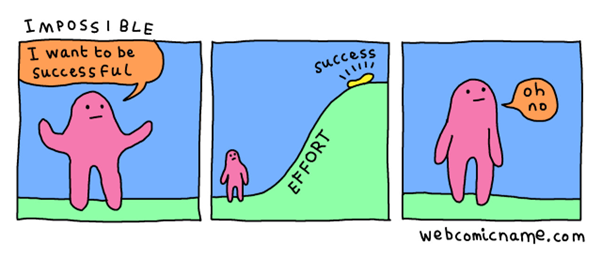
Open data science tools can make it easier to improve reproducibility, but learning and teaching these tools often requires huge investments of time and effort. Given the already high demands on academics to teach courses, publish papers, apply for grants and communicate findings to the public, the additional demands to learn, engage and teach open science practices may feel to many like an unrealistic, unachievable expectation. In our own reading, we became frustrated that most papers we saw about better open science practices suggested learning a new tool that could take months or even years to master and implement.

Over the past several years, we have learned about code reproducibility by making tools to support it for the Atlas of Living Australia (ALA). The {galah} package, an interface to download biodiversity data from Living Atlases, and ALA Labs, an online resource to learn ecological coding, aim to make good coding practices easier. Creating these tools has been a big learning curve for us about reproducibility, too.
To share what we’ve learned, and to combat feelings that open science is unachievable, we’ve compiled some small steps people can take to improve the reproducibility of their R code with big impacts. The idea is that doing just a few of these steps (not necessarily all of them) can help improve whether an analysis can be run again and shared with others. While we have focussed on R, comparable approaches exist in other coding languages like Python or Julia.
1. Aim to make your work environment sharable
One of the main benefits of using code for an analysis is that the code can be shared. However, as many researchers are self-taught coders, they may have initially learned more manual methods for setting their working directories, loading files or saving their working environments. These methods can sometimes break an analytic workflow when shared.
R and R Studio have tools to help make setting and saving work environments more automatic. Rather than setting working directories using code at the top of a script, using R Projects to automatically set the working directory when you open them can help avoid risks of manually setting file paths. Similarly, the {here} package works with R Projects to help users write shorter paths to files without needing to write slashes, making these paths less likely to break on other systems. The {renv} package lets users document which packages they used in an analysis and load them again with just 3 functions. Finally, using an online repository like GitHub allows analyses to be backed up even if your computer explodes. GitHub offers other useful features like front-facing README files to describe what your code is for, and version control for reversing code missteps.
2. Readable code, readable notes
Naming things is hard, and over the long process of an analysis, object names can become…unruly. Avoid saving objects with names full of abbreviations and acronyms. It’s ok to use longer words if they make it clearer or easier to remember what an object is (‘bandicoots_filtered’, not ‘dat_band_occsFB’). Avoid vague names of plots and functions and aim for informative but brief names that describe exactly what a plot is (‘barplot_birds_high_temp’, not ‘plot1.occMod’) or what a function does (‘filter_outliers’, not ‘func1’).

A similar philosophy applies to writing in-code notes. Try to write in simple language what a chunk of code does (e.g., “Tests the effects of temperature and fire frequency on species abundance”). If you run an analysis, be sure to write what the model found, whether the result was hypothesised or not, and any next steps the result led you to make. Doing this allows you to document your analytical decisions.
3. Render your code into a document (with middle steps included)
For years, R users have been able to use R Markdown files to render documents into html files, Word documents and PDFs. With the recent release of Quarto, files render faster and look nicer than ever before.
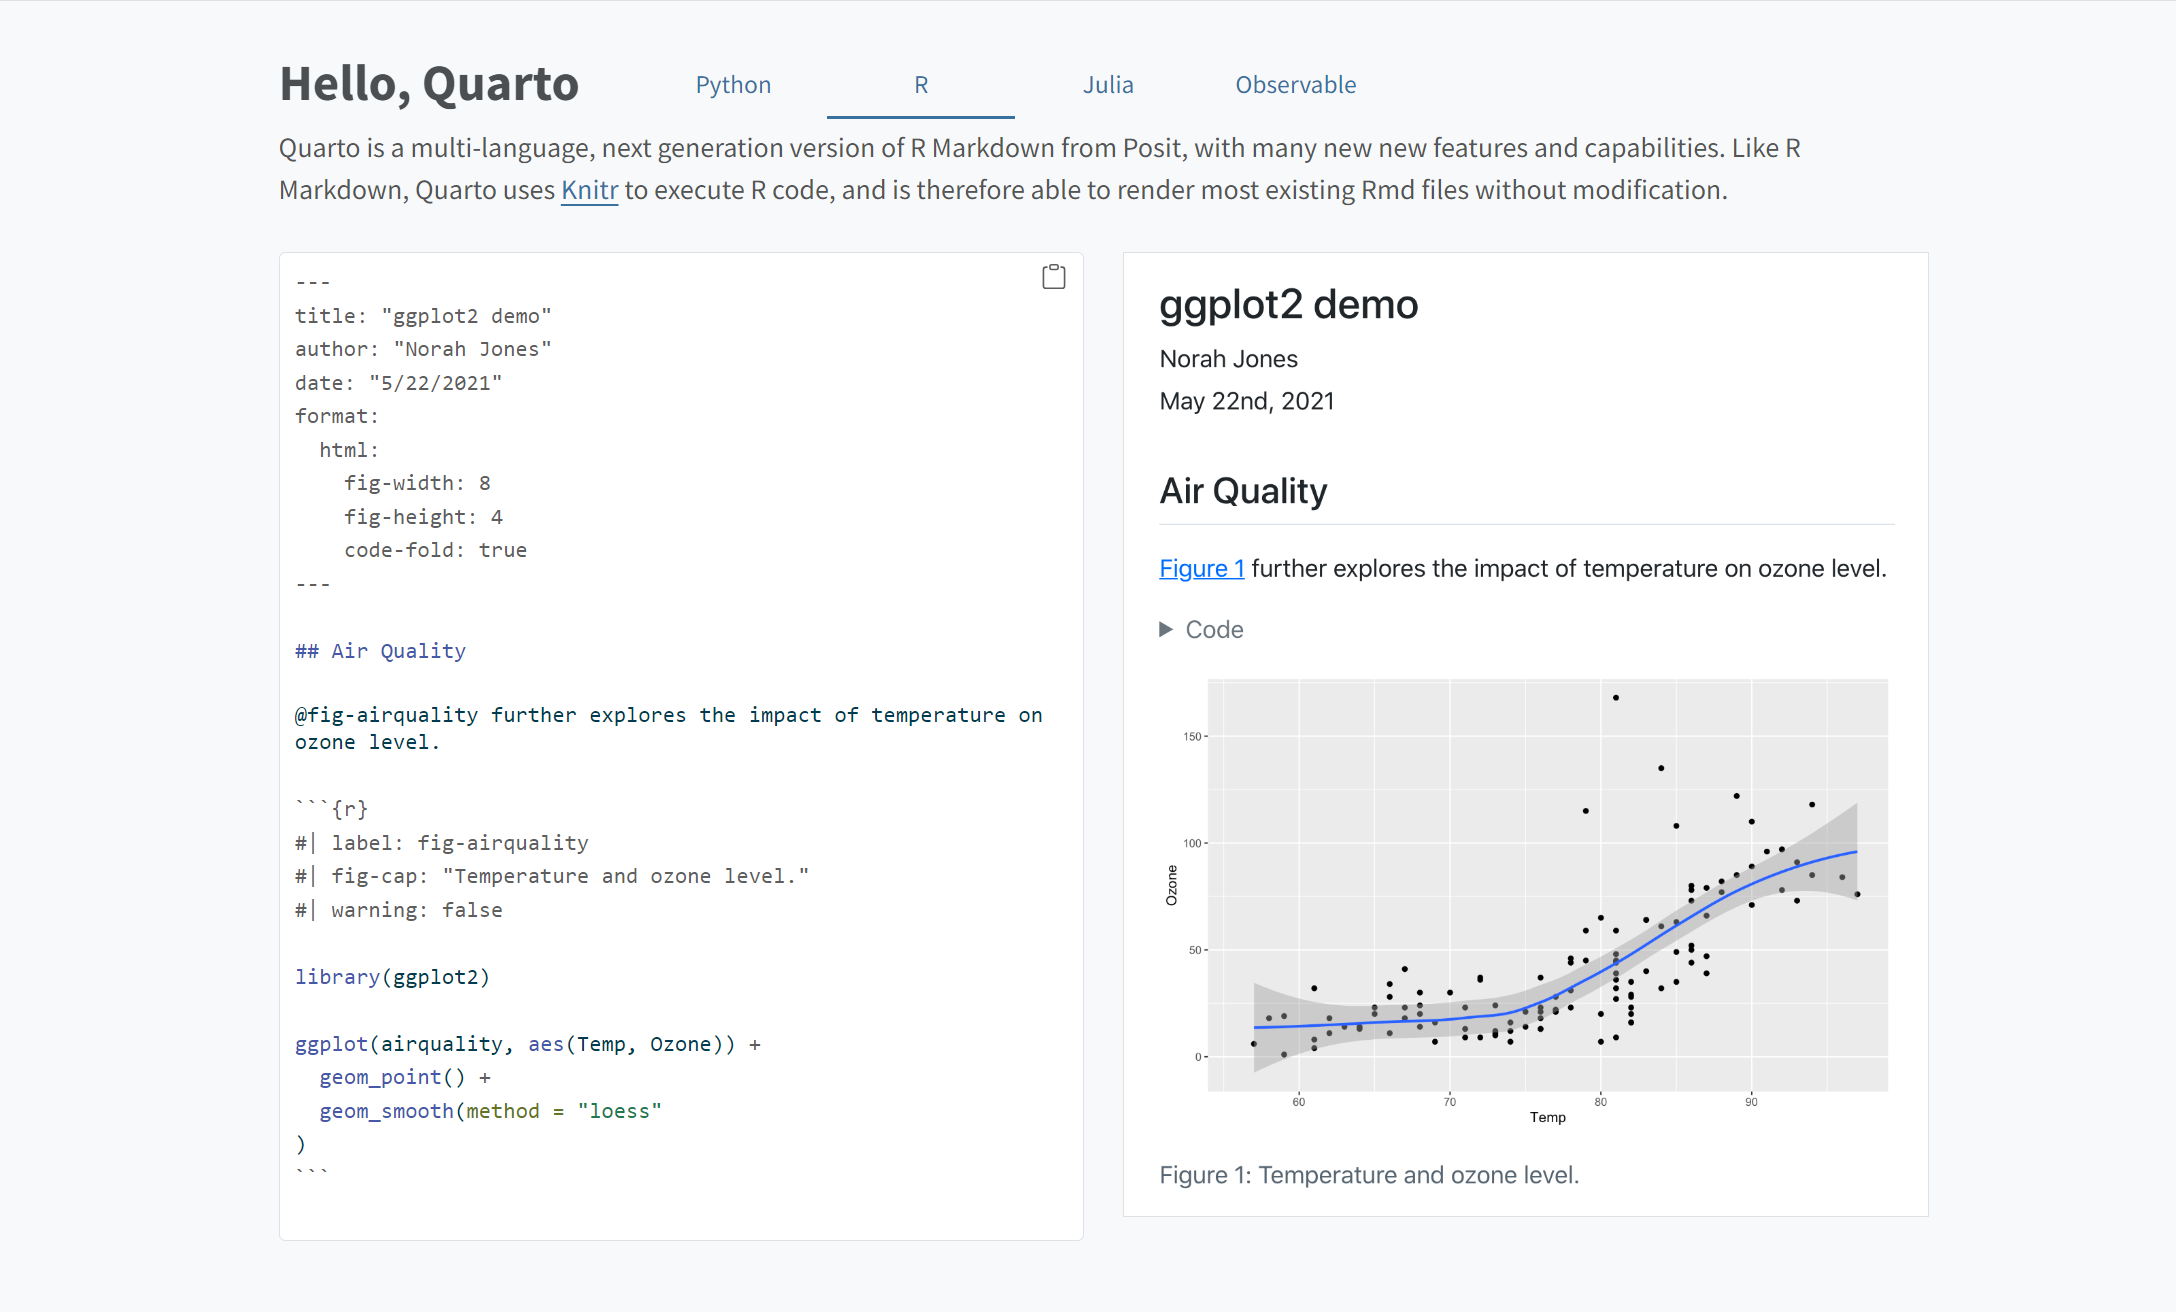
At the ALA, we manage a website with how-to articles—made in Quarto—to show how to download ecological data and create some sort of output (usually a nice visualisation). Over time, we unexpectedly found ourselves referring to these online rendered articles all the time rather than the original code used to make them. Articles were especially useful because they showed the input and output of middle data wrangling steps, too, meaning we could quickly find and copy these steps into new analyses.

Example of a rendered Quarto document from https://quarto.org/
The suggestion here isn’t to make your own website, but to render final analyses into a document and save these documents in one place—even in a private folder for your lab group or just for yourself. Doing so will improve the reproducibility of analyses because:
- You don’t have to rerun your code each time you want to refer to it
- It will help you fix your code if it breaks in the future because you know what the input and output of each step should look like
- You can reference these documents quickly and share them with others
Many of these ideas are not original—most are benefits of good coding practices like code review. We hope that by trying a few of these small steps, you will feel encouraged to improve the reproducibility of your own analyses. Not only will this help others verify the results of your research, but hopefully make you a more efficient scientist, too!
This article is a write-up of a talk presented at the Ecological Society of Australia (ESA) Annual Conference, held in Darwin, Australia July 3-7, 2023


Please sign in or register for FREE
If you are a registered user on Research Communities by Springer Nature, please sign in