Lasers shine new light on the 70-year-old puzzle of Antarctica’s ice core thermometer
Published in Earth & Environment and Mathematics
When we set off across East Antarctica with an infrared spectrometer literally strapped to our traverse vehicle, we weren't just collecting data — we were chasing a puzzle that had frustrated generations of climate scientists since the 1950s: why does the relationship between water isotopes in Antarctic ice cores and temperature vary so dramatically across space and time?
Since water isotopes are such a key tool to reconstruct past temperatures in Polar Regions, we delved into the potential reasons for this discrepancy, and offer new evidence as well as a theoretical framework in our newly published manuscript in Nature Geoscience https://www.nature.com/articles/s41561-026-01961-y .
The 70-Year-Old Problem
Since the pioneering work of Willi Dansgaard and Claude Lorius in the 1950s, scientists have used the isotopic composition of water in ice cores (specifically, the ratio of heavy to light isotopes) as a “paleothermometer” to reconstruct past temperatures. However, this method has faced a persistent challenge: the relationship between isotopes and temperature is not consistent across space or time. The spatial relationship is consistently steeper. Always. Everywhere. And nobody knew exactly why.
That discrepancy matters enormously. If we can't confidently explain why the relationship changes, we can't fully trust the temperature readings we extract from ice cores — and those readings underpin much of what we think we know about past ice ages and warm periods.
The Breakthrough
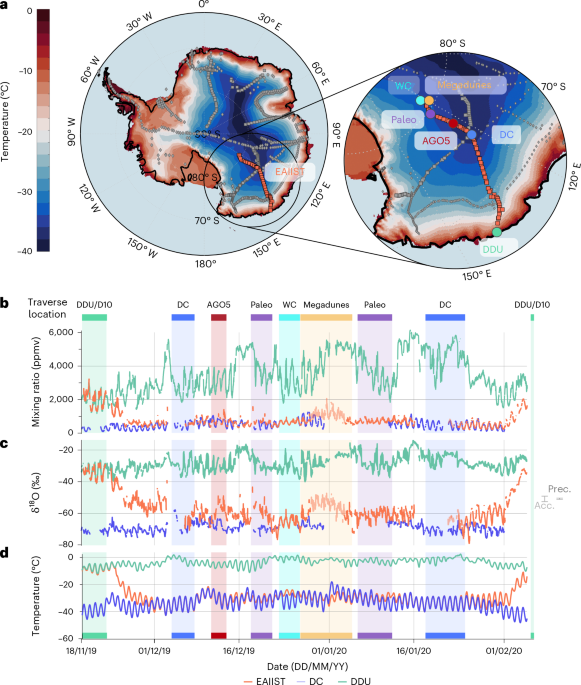
Complicating the situation, spatial and temporal slopes are derived using very different observational methods. The spatial relationship is typically calculated from samples of firn (or ice), which may represent long chunks of time each, say more than 10 years. In contrast, temporal relationships are typically derived using individual daily snowfall data. This leads to uncertainty in determining whether the difference between spatial and temporal relationships is due to the sampling inconsistencies or is an inherent property of the hydroclimate system. Using cutting-edge infrared spectroscopy, our team measured water vapour isotopic composition in real time during a 3 500 km traverse across East Antarctica. By combining these new measurements with data from fixed stations of vapour, precipitation, and surface isotopic composition, and climate model simulations, we were able to uncover the physical mechanisms underlying the differences in isotope-temperature relationships.

The picture that emerged was striking.
Different pathways, different stories
The key turned out to be large-scale atmospheric circulation. As moist air masses travel from the Antarctic coast inward toward the polar plateau, the moisture they carry undergoes progressive distillation, heavier isotopes rain or snow out first, leaving the remaining vapour isotopically lighter. This distillation process is governed by the pathway the air takes.

And here's the crucial insight: the pathways that connect different locations across Antarctica are fundamentally different from the pathways that bring moisture to any single location at different times of year. Higher elevations on the plateau are supplied by air masses that have travelled farther, from more distant source regions, and at different altitudes, meaning they have experienced more of this distillation process.
As our co-author Adriana Bailey from the University of Michigan put it: "Higher elevations on the Antarctic plateau are connected to more distant moisture source regions. The moisture at higher elevations experiences a longer 'water-cycle journey', which is why we see a stronger sensitivity between the isotope ratio and temperature at those sites. That stronger sensitivity at elevation – relative to coastal regions – is what drives the steeper spatial relationship."
Finally fixing the thermometer
For us, the most satisfying moment was realising that the discrepancy – long treated as an inconvenient feature of an imperfect proxy – is actually physically meaningful and predictable. It is not noise; it is signal.
As lead author Dr Mathieu Casado (CNRS/LSCE) reflected: "For 70 years, the isotopic paleothermometer was always only known empirically. With this study, we've finally fixed the thermometer. Our framework allows us to interpret ice core records with greater confidence, opening new doors for understanding Antarctica's role in global climate change."
This matters well beyond Antarctica. More accurate temperature reconstructions from ice cores will sharpen our understanding of glacial-interglacial cycles, climate sensitivity, and the long-term behaviour of the ice sheets; all of which feed directly into projections of future sea level and climate.
A team effort on ice
None of this would have been possible without the remarkable international collaboration that EAIIST enabled – bringing together researchers from France, Italy, Australia, the USA, Japan, Germany, Belgium, and Ireland, working across thousands of kilometres of some of the most remote terrain on Earth. Logistics alone were a feat. Keeping the laser system running in sub-zero conditions, navigating whiteout storms, and maintaining a continuous measurement record across crevasse fields required as much engineering ingenuity as scientific insight.
But the traverse gave us something no fixed station network could: a continuous, high-resolution transect that let us observe the isotope signal evolving in real time, across a full gradient from coast to interior.
The full study is published in Nature Geoscience: https://www.nature.com/articles/s41561-026-01961-y
Follow the Topic
-
Nature Geoscience
A monthly multi-disciplinary journal aimed at bringing together top-quality research across the entire spectrum of the Earth Sciences along with relevant work in related areas.


Please sign in or register for FREE
If you are a registered user on Research Communities by Springer Nature, please sign in