Multifractal Geochronologies
Published in Earth & Environment, Ecology & Evolution, and Physics
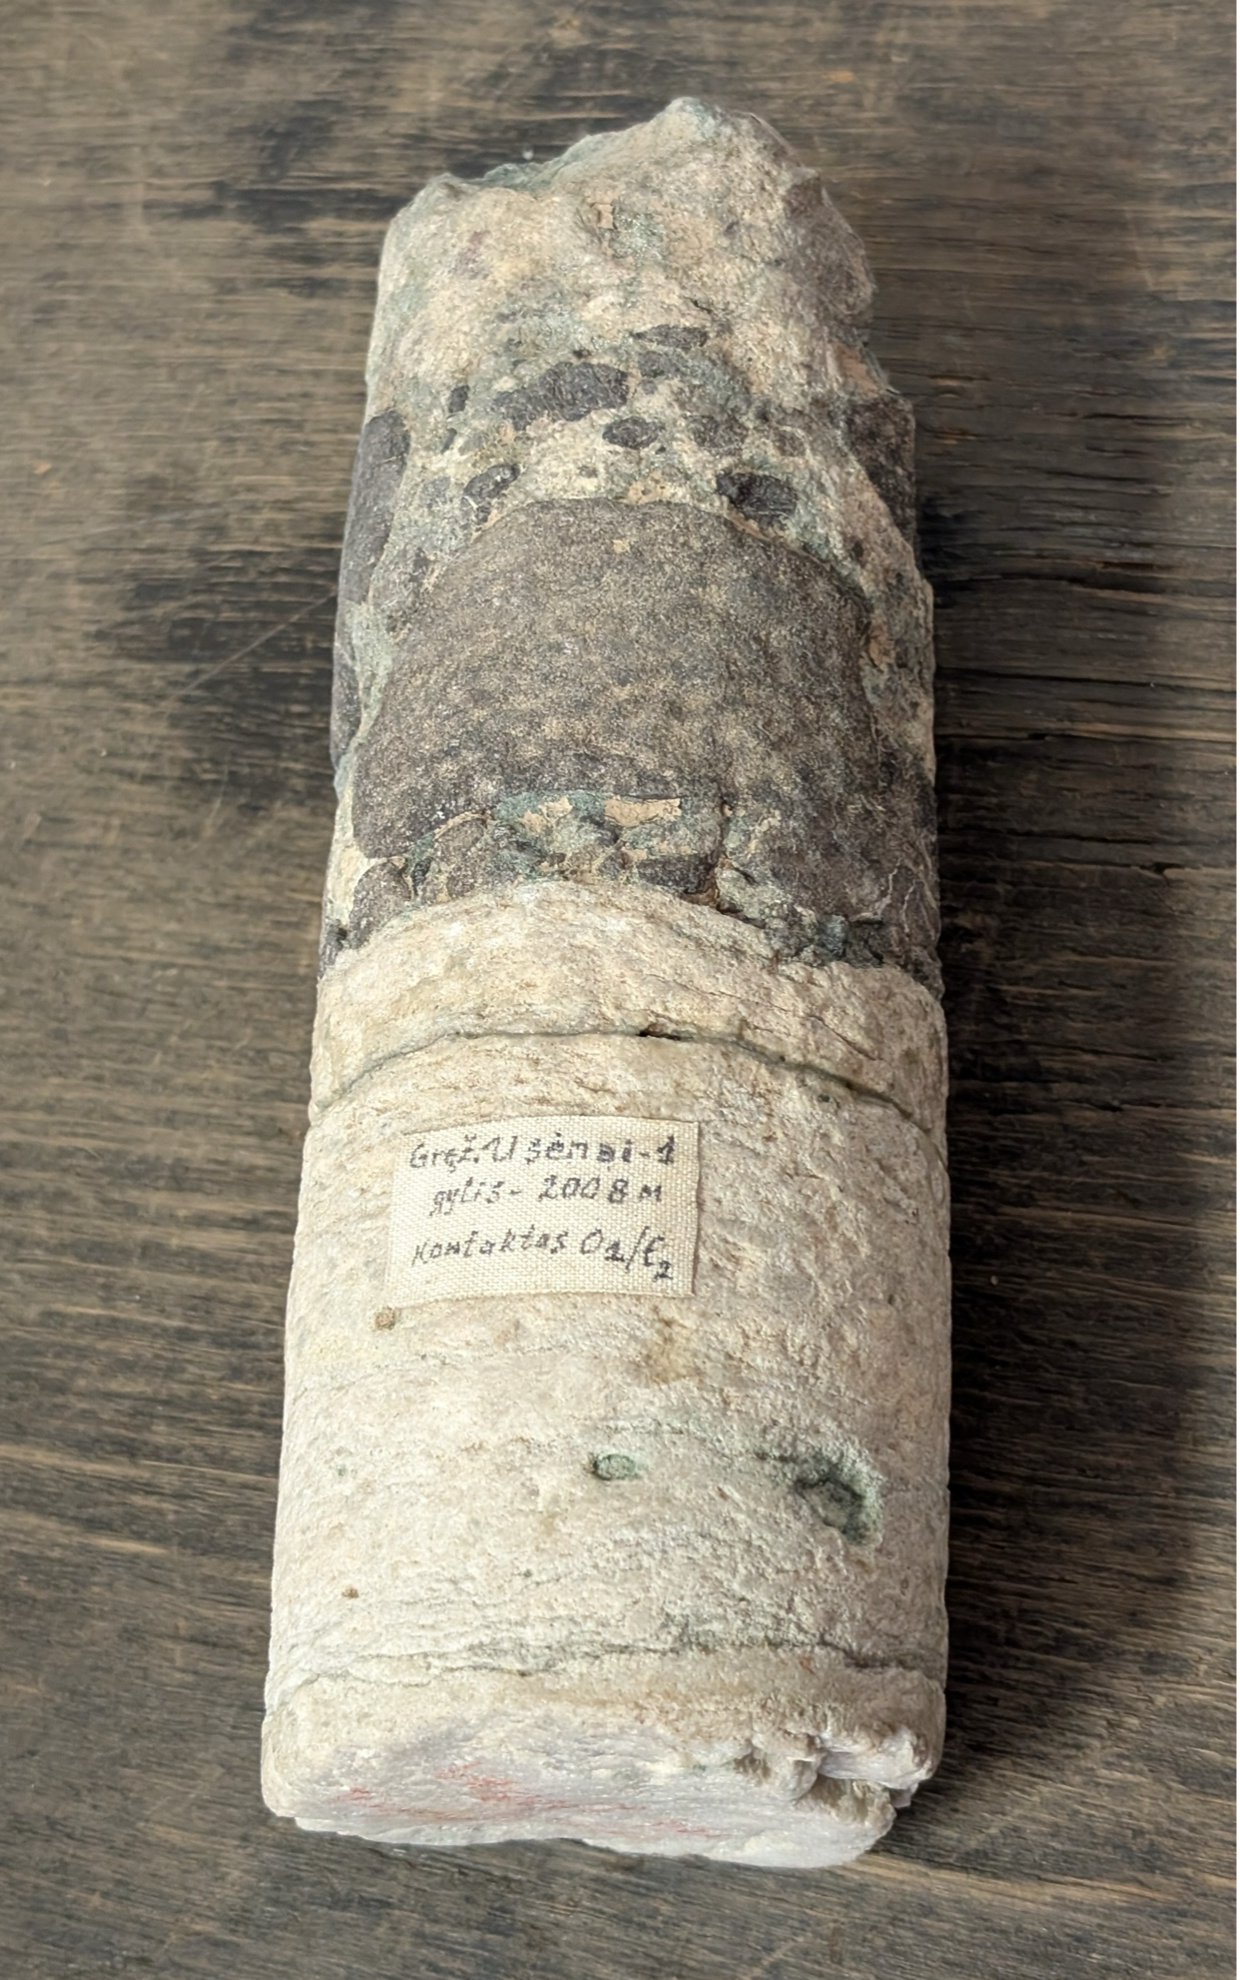
Much of our knowledge of the Earth is from strata exposed in outcrops or from cores drilled through sequences of strata. The inter-strata boundaries are commonly discernable to the naked eye, they highlight discontinuities in rock properties (fig. 1). Cores taken through the ocean floor reveal strata spanning deep geological time (millions to billions of years). Each stratum varies by rock type and fossil content and it corresponds to a specific epoch in the Earth’s history. Similarly, cores taken through the polar ice caps give precious information about the climate over the last million years, whereas information on the conditions that permitted the rise of civilization 10,000 years ago can be inferred from cores from lake bottoms (e.g. varves) or from stalagmites in caves (speleothems).

Figure 1: An example of the stratigraphical unconformity in a geological section (Usėnai core, western Lithuania; depth 2008 m from the surface, image thanks to Andrej Spriridonov). Middle Cambrian sandstones overlain by the lower Ordovician conglomerates. Between these lithologies there is erosional surfaces and the time gap of approximately 20 million years.
For quantitative analysis, core samples are typically taken at regular depth intervals and various properties such as rock densities or isotopic composition are determined. However, to be fully exploited, it is essential that the samples be assigned dates, creating a geochronology. This is a complex process: the strata are of variable thicknesses and were formed under highly variable conditions including strongly variable sedimentation rates. To further complicate things, the records typically include gaps where entire strata have been wiped out by erosion. Although each data type has its own challenges, the basic approach is to first identify key boundaries or known “events” with established ages. This creates a scaffolding that allows the ages of individual samples to be determined by their relative depths between the reference points.
Described in this way, the establishment of geochronologies seems straightforward, yet the variability and the gaps that occur over wide ranges of time scale gives pause for thought. To get an idea, fig. 2 from our recent paper ([Lovejoy et al., 2026]) shows a paleotemperature series over the last 470 million years (blue points) produced from a “benthic stack” ([Grossman and Joachimski, 2022]). The stack combines information from multiple ocean cores; here there are 11,874 measurements, each at a resolution of 10,000 years. At this resolution there are 47,000 intervals, yet only 3950 (≈ 8%) have one or more measurement. The blue points already show that the values of the paleotemperatures themselves are quite irregularly distributed but the variability is more strikingly demonstrated by the spiky red curve that represents the number of measurements per million years: the stack’s measurement density. The tallest spike has nearly 300 measurements in a single one million year interval yet there are numerous gaps where there are no measurements at all, including an extreme gap of over 20 million years.
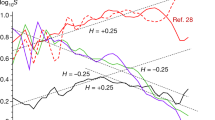
Using Haar fluctuation analysis, [Lovejoy et al., 2026] shows that the red measurement density has two scaling ranges. In the first - up to roughly a million years - the measurement density fluctuations are close to the classical “bell curve”, but beyond this, up to hundreds of millions of years, the fluctuations are so large that they are outside the scope of conventional statistical analysis: the density is a multifractal whose properties vary over a wide range of time scales in a scale invariant manner. By determining the transition scale from classical to multifractal behaviour, and by quantifying the latter, [Lovejoy et al., 2026] extracts important information, it shows that the density is in fact a new paleoindicator.
![Figure 2: Temperature data recorded in a paleotemperature reconstruction [Grossman and Joachimski, 2022] (blue) and the corresponding measurement density as a function of time (red). Large gaps in the data correspond to small measurement densities and vice versa. This dataset was a benthic stack at 10kyr nominal resolution, such that data from well-defined layers were used with many data points assigned to each 10kyr interval.](https://images.zapnito.com/cdn-cgi/image/metadata=copyright,fit=scale-down,format=auto,quality=95/https://images.zapnito.com/uploads/1n0eQtTTeO4hrOgaa1ws_fig.2blog.png "Measurement densities and paleotemperatures from a benthic stack")
Figure 2: Temperature data recorded in a paleotemperature reconstruction [Grossman and Joachimski, 2022] (blue) and the corresponding measurement density as a function of time (red). Large gaps in the data correspond to small measurement densities and vice versa. This dataset was a benthic stack at 10,000 year nominal resolution, such that data from well-defined layers were used with many data points assigned to each 10,000 year interval.
Our discussion around fig.1 has focused on geological time scales, but [Lovejoy et al., 2026] also analyzed geochronology measurement densities from over 20 other series including records of pollen, lake sediments, ice cores, loess, speleothems, marine sediments and stacks, collectively spanning a range of time scales from one to several billion years. The surprising finding was that the basic pattern of variability was the same as the one just described: each displayed a high and low frequency regime, the former displaying classical behaviour followed by a transition to a low frequency multifractal regime. Significantly, the transition time scales lined up closely with the transition time scales separating the fundamental dynamical regimes that had been identified over ten years ago in temperature and paleotemperature data: a macroweather to climate transition at a time scale of about 500-1000 years (due to anthropogenic warming, this transition scale is currently only about 15 years), a climate to macroclimate transition at about 100,000 years and a macroclimate to megaclimate transition at about a million years. Note that there exists another transition scale: from weather to macroweather at about 10 days, but it was outside the scope of this study.
The measurement density is indeed a new paleoindicator, and it is needed to statistically unbias our measurements. For example, the density fluctuations were often found to be positively correlated with the paleotemperature fluctuations. This means that over the corresponding time scales, there is a tendency for high paleotemperature fluctuations to be measured very frequently whereas small fluctuations are poorly sampled. This measurement density information is therefore needed for unbiasing the paleotemperatures themselves. In this way, by encoding information about gaps and missing data, the measurement density turns the absence of evidence into positive knowledge about the nontrivial statistics of the absence.
References
Grossman, E. L., and Joachimski, M. M., Ocean temperatures through the Phanerozoic reassessed, Scientific Reports, 12, 8938 doi: https://doi.org/10.1038/s41598-022-11493-1, 2022.
Lovejoy, S., Davies, R., Spiridonov, A., Hebert, R., and Lambert, F., Time scales and gaps, Haar fluctuations and multifractal geochronologies, Commun Earth Environ, https://doi.org/10.1038/s43247-026-03226-3, 2026.
Follow the Topic
-
Communications Earth & Environment
An open access journal from Nature Portfolio that publishes high-quality research, reviews and commentary in the Earth, environmental and planetary sciences.

Related Collections
With Collections, you can get published faster and increase your visibility.
Hazards in Mountain Regions
Publishing Model: Open Access
Deadline: Nov 02, 2026
Sustainable agricultural practices
Publishing Model: Open Access
Deadline: Oct 31, 2026


Please sign in or register for FREE
If you are a registered user on Research Communities by Springer Nature, please sign in