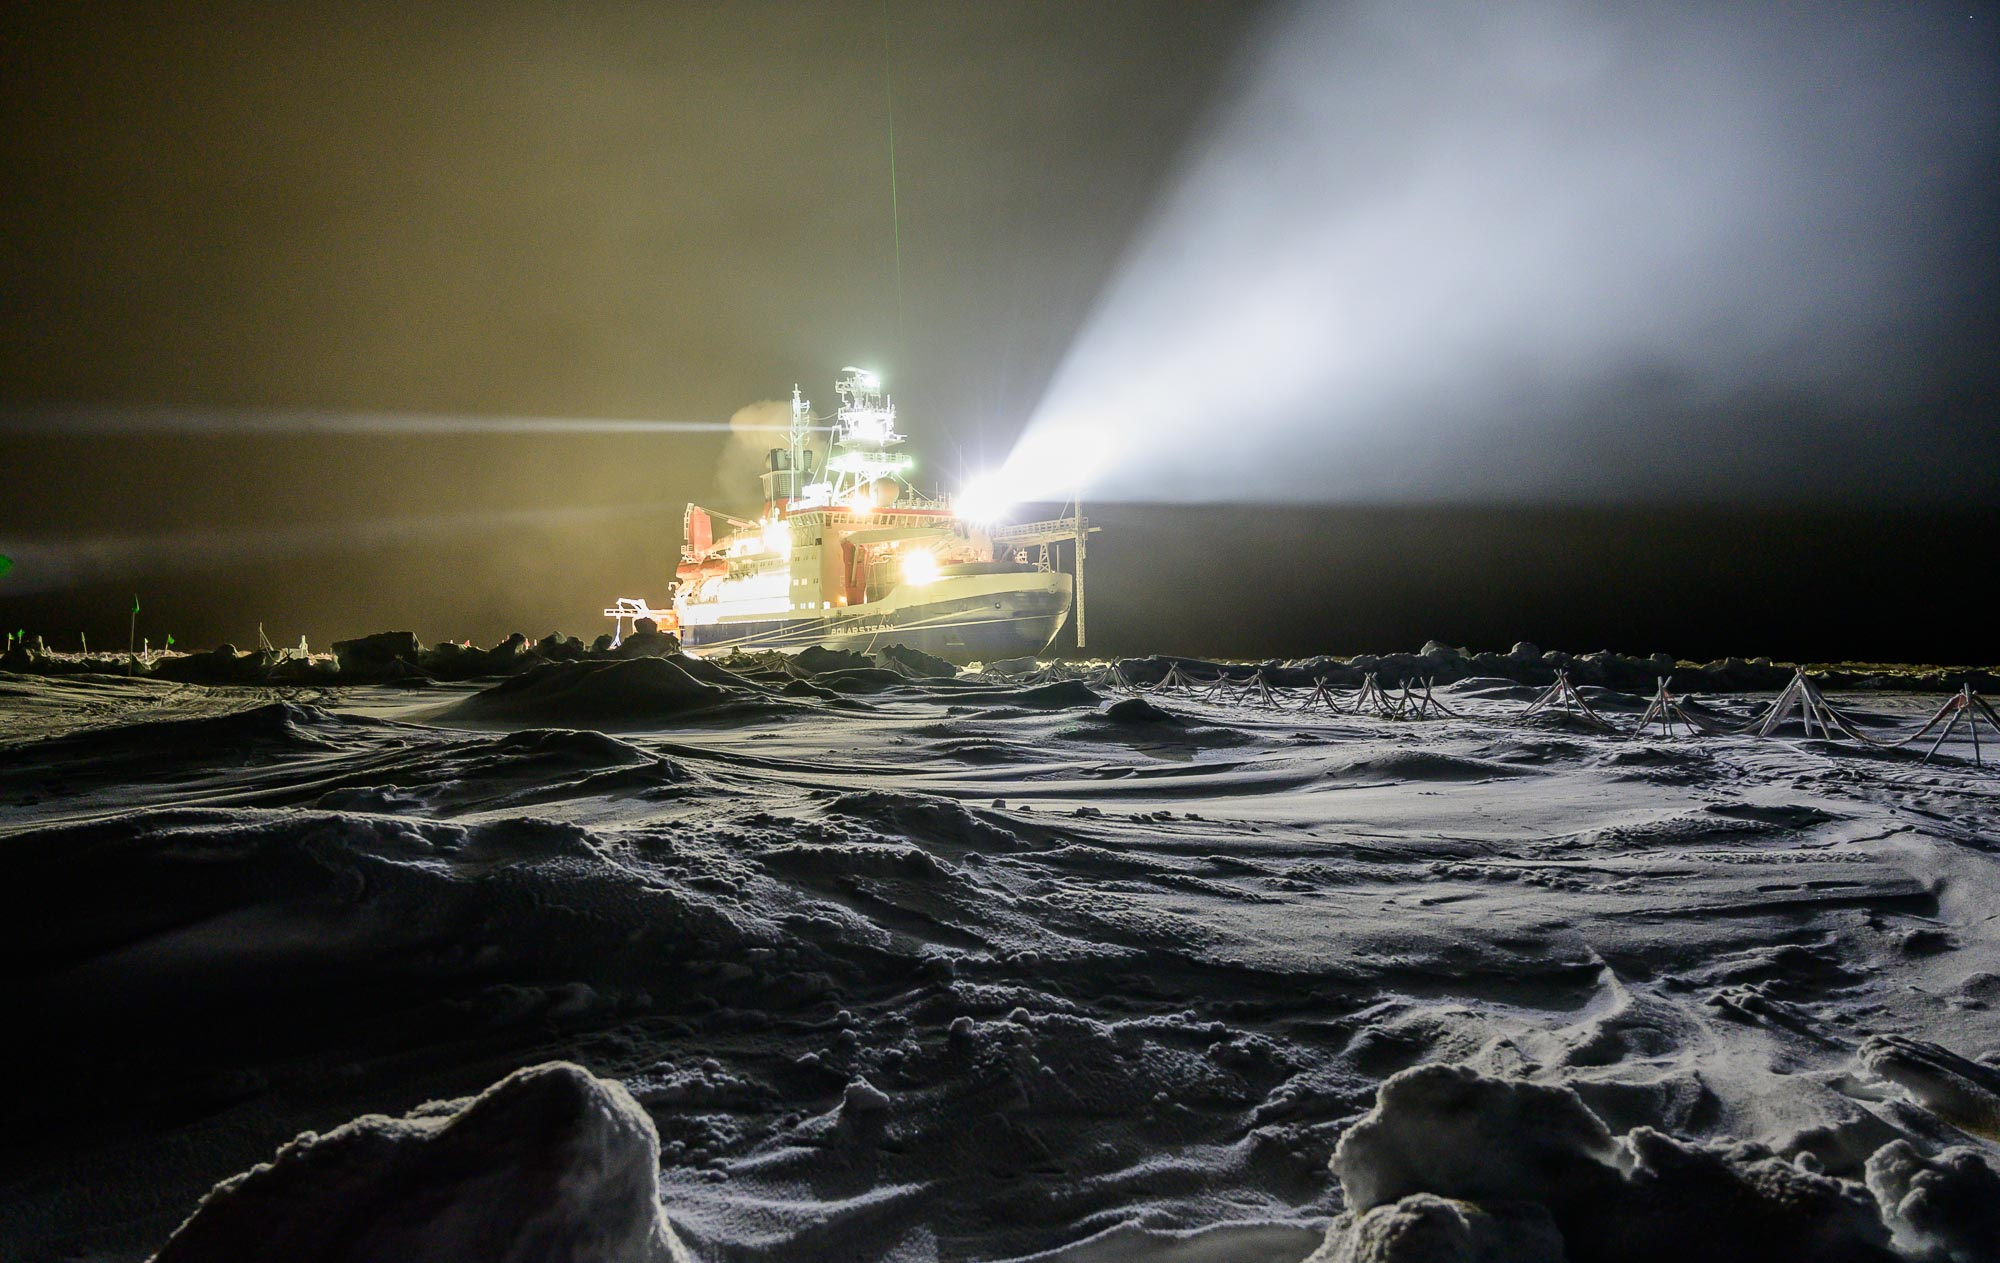

7 o’clock in the morning, doctoral student Ivo Beck wakes up to the sound of cracking ice. A new day begins in the dark winter of the central Arctic Ocean, and Ivo heads to the Swiss container on the front deck of Research Vessel Polarstern. The daily routine: checking the instruments’ proper functioning, troubleshooting, calibrations, flow checks, zero checks, and data quality control, for a full state-of-the-art suite of in situ aerosol and trace gas instrumentation. For an entire year, scientists from the Extreme Environments Research Laboratory (EPFL, Switzerland), the Paul Scherrer Institute (PSI, Switzerland) and the Institute for Atmospheric and Earth System Research (University of Helsinki, Finland) have taken turns to cover five expedition legs to run this complex ensemble of instrumentation. This is not an easy job, and those who conduct research in the central Arctic winter must be prepared for extreme conditions. It is pitch dark for months on end, and temperatures drop to minus 42 degrees Celsius. Such conditions demand the highest standards for both humans and equipment. Ivo will never forget the day when he had to unscrew the inlet on the roof of the container at -30°C to replace defective heating wires. Seemingly simple tasks like these become intricate manual work when your fingers become so cold in a very short time that you can't move them anymore. Although fascinating, the story I want to tell here is not only that of the “Multidisciplinary drifting Observatory for the Study of Arctic Climate” (MOSAiC) expedition in the central Arctic Ocean, but also that of the behind-the-scene office work that followed.
In fact, acquiring “real-time” in situ data does not necessarily mean “real-time” ready-to-use results. One has to go through the hurdles of data processing and cleaning, so that the scientific community can in the end benefit from trust-worthy open-source datasets. So here I am, thousands of kilometers away from the Arctic, sitting in an office of EPFL in Sion (Switzerland), hot coffee in one hand and several hundreds of giga bytes worth of data in the other, waiting to be processed and prepared for publication. A whole series of steps are necessary: losses of aerosol particles in the inlet lines have to be quantified (aerosol measurements need a flow as laminar as possible), noisy data must be tested for limits of detection, artifacts corrected, and outliers, as well as periods during which measurements are not reliable, need to be identified and removed. The expedition logbook, compiling detailed notes taken during field work, becomes your bedside book. Teamwork is a critical aspect here, with some of the scientist holding knowledge and experience from the field and others, like myself, who joined the project at a later stage for the processing and analysis of the data.
One important challenge that quickly arises for our atmospheric measurements of aerosols is the contamination of the data by pollution from the ship’s stack (Fig. 1). Several methods were applied to flag these contaminated periods, for example a multi-step pollution detection algorithm (Beck et al., 2022). In general, cleaning of the data is very much instrument-specific, as every instrument reacts differently to pollution. This requires a deep understanding of the instruments’ working principles.
")
Eventually, a year passes by and the team gathers one last time to plot and validate the data. The result of this meticulous, collaborative work is a unique, Open Access, year-long aerosol physicochemical properties dataset from the central Arctic. “Unique” also, because it is but certain that similar observations will be repeated in the central Arctic with comparable sea ice coverage throughout the entire year. The sampling and processing methods, along with technical validations of the data products were reported in our data descriptor (Heutte et al., 2023). These high time-resolution and year-round continuous measurements will greatly serve the scientific community, in their common efforts to unravel aerosol processes and their contribution to Arctic amplification, and improve large-scale climate models in one of the most climate-sensitive region of the globe.
(This blog post was edited by doctoral students Benjamin Heutte and Ivo Beck, members of the Extreme Environments Research Laboratory at EPFL, Switzerland.)
Follow the Topic
-
Scientific Data
A peer-reviewed, open-access journal for descriptions of datasets, and research that advances the sharing and reuse of scientific data.

Related Collections
With Collections, you can get published faster and increase your visibility.
Genomics in freshwater and marine science
Publishing Model: Open Access
Deadline: Jul 23, 2026
Computer vision in plant science and agriculture
Publishing Model: Open Access
Deadline: Jul 10, 2026
Please sign in or register for FREE
If you are a registered user on Research Communities by Springer Nature, please sign in