Quantifying the Dunkelflaute: An analysis of variable renewable energy droughts in Europe
Published in Earth & Environment, Mechanical Engineering, and Law, Politics & International Studies
Introduction
Variable renewable energy droughts, often referred to by lulls or the German term “Dunkelflaute”, are frequently portrayed as potential showstoppers of the energy transition. The compromising narrative is simple: prolonged periods with little wind and solar generation could jeopardize the reliability of a highly renewable power system.
In our paper published in Communications Earth & Environment, we take a systematic look at these events across Europe analyzing historical wind and solar resource time series. We investigate drought patterns for solar photovoltaics, onshore wind, and offshore wind individually as well as for policy-relevant renewable technology portfolios. Beyond identifying drought events, we quantify their frequency, return periods, maximum duration. We assess drought-mitigating portfolio and geographical balancing effects, and identify the most extreme portfolio droughts across years and regions.
Why is this research valuable?
This research contributes to the energy debate in three important ways.
First, it substantiates a politically charged discourse. Renewable droughts are often invoked as evidence that a power system dominated by wind and solar energy cannot function reliably. I have encountered claims, even in academic settings such as conferences, that there are hours with “no wind anywhere in Europe,” implying that the transition is technically infeasible. More recently, renewable droughts have also been instrumentalized in polarized political debates about climate and energy policy. Yet many of these arguments rely on vague statements rather than quantified evidence. Our study provides a systematic and transparent quantification of drought duration, return periods, and extreme events. It shows what these events actually look like.
Second, we revisit assumptions about extreme event duration. Earlier studies, particularly in Germany, often concluded that extreme renewable droughts last about two weeks and primarily occur in winter. However, these studies often had limited spatial scope. We find that the most severe events can last substantially longer and affect multiple countries simultaneously.
Third, we address methodological shortcomings. Many previous studies rely on a single or only a few drought thresholds — a predefined level below which low renewable resource availability is considered a drought. However, our analysis shows that obtained results are highly sensitive to threshold choice. Single-threshold analyses are limited in the sense that they only capture a reduced perspective on renewable drought patterns and miss important aspects of drought dynamics, especially the sequential nature of extreme events. Furthermore, some search algorithms produce overlapping or ambiguously defined events, complicating comparability across studies. Addressing these issues became a research project in its own right and even led to a complementary methodological publication providing an overview of how to define and identify renewable droughts in a robust way.
What did we do?
We developed and applied an advanced drought identification framework that overcomes several limitations of earlier approaches. Our algorithm identifies unique, non-overlapping sets of drought events, pools mutually dependent events with intermediate renewable resource availability above drought threshold, and avoids double counting. This ensures that each drought is consistently defined and identified.
Rather than selecting one arbitrary threshold, we deploy a multi-threshold framework. We systematically vary drought thresholds to examine how results change depending on how low renewable resource availability must be to be considered a drought. We scale these thresholds relative to fractions of the multi-annual renewable resource availability ("relative thresholds"), which enables comparability across all regional and technological settings. This allows us to characterize drought dynamics more comprehensively and reveal sequential structures that single-threshold analyses obscure.
We apply this framework to:
- 34 European countries modeled as isolated systems
- A pan-European copperplate region assuming unconstrained geographical balancing of electricity via the well-meshed European transmission grid
For each case, we analyze renewable drought patterns for:
- Solar photovoltaics
- Onshore wind
- Offshore wind
- Renewable technology portfolios combining these three technologies with policy-relevant capacity mixes
The analysis covers 38 historical weather years (1982–2019), enabling us to estimate return periods and identify rare extreme events.
We also quantify two drought-mitigation mechanisms from complementary wind and solar resource profiles:
- Portfolio effects from technology diversification within a country
- Balancing effects from geographical diversification across countries
This allows us to disentangle how technology mix and spatial integration influence drought characteristics.
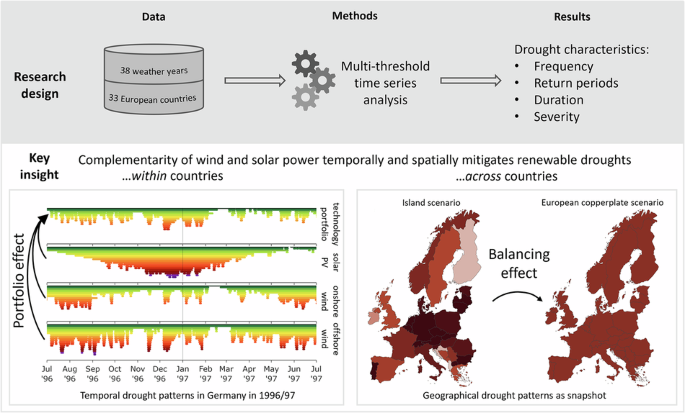
How do extreme renewable droughts look like?
Figure 1 illustrates the most extreme renewable portfolio drought identified in our dataset. The purple boxes mark the event that occurred in the winter of 1996/97 under two system configurations: a pan-European copperplate scenario (CP) with unconstrained cross-border electricity exchange, and Germany modeled as an island system (DE).

Several insights emerge. First, extreme droughts exhibit complex and heterogeneous internal structure, which becomes visible only when applying a multi-threshold framework. Single-threshold analysis would collapse these dynamics into a much simpler, and potentially misleading, representation.
Second, extreme portfolio droughts can last many weeks. They typically arise as a sequence of severe sub-events, each lasting roughly one to three weeks, embedded within a prolonged period of below-average renewable availability.
Third, they are not uniform blocks of zero generation. Even during the most extreme event in the 38-year record, renewable portfolio availability during the 1996/97 event remained at 47% of the long-run mean (under the idealized European copperplate assumption). In other words, there is always some wind or solar generation — but substantially below average for extended periods.
Crucially, these extremes are not uniform blocks of zero electricity generation. Rather, they consist of sequences of severe droughts with very low generation potential lasting around two weeks embedded in prolonged periods of below-average renewable resource availability.
What are the implications of this study?
Methodological implications: Drought characteristics depend strongly on threshold selection. Single-threshold analyses fail to capture complex drought dynamics, especially the sequential structure of extreme events. Our findings suggest that future studies should:
- Use multi-threshold frameworks instead of deploying single or only a few drought thresholds
- Carefully interpret drought characteristics, such as maximum duration or return periods and always contextualize their claims with the deployed identification method and threshold
These steps increase robustness and improve comparability across studies.
System and policy implications: Wind and solar generation profiles in Europe are complementary. Combining technologies reduces maximum drought duration, which we label as portfolio effect. This mitigation becomes even more pronounced when leveraging geographical balancing across countries, denoted as balancing effect.
At the same time, extreme events can last much longer than the two-week duration as often cited in energy policy debates. These events consist of sequential droughts embedded in prolonged below-average availability periods. Future power systems with high shares of wind and solar must therefore be designed to withstand such compound and persistent stress events, rather than hypothetical scenarios of complete continent-wide generation collapse.
Overall, discussions around renewable droughts require a nuanced perspective. They neither justify alarmist claims that the energy transition is infeasible, nor do they permit simplification. Instead, they call for differentiated analysis with deliberate methodological approaches, and system designs that account for rare but consequential events.
In short, Dunkelflaute events are real — but their risk is quantifiable, structurally characterizable, and manageable through robust system design: diversified renewable portfolios, strengthened cross-border integration, and sufficient flexibility options.
Follow the Topic
-
Communications Earth & Environment
An open access journal from Nature Portfolio that publishes high-quality research, reviews and commentary in the Earth, environmental and planetary sciences.

Related Collections
With Collections, you can get published faster and increase your visibility.
Remote sensing and forests
Publishing Model: Hybrid
Deadline: Jul 31, 2026
Sustainable agricultural practices
Publishing Model: Open Access
Deadline: Jul 24, 2026


Please sign in or register for FREE
If you are a registered user on Research Communities by Springer Nature, please sign in