Reduced microbial diversity in soil increases Volatile Organic Compound (VOC) emissions from soil
Published in Microbiology


In the last decades, cultivable lands have been exploited by the increase of intensive agricultural practices. These practices led to the loss of microbial diversity in soil. More generally, high-input agricultural practices decrease microbial diversity while the low-input practices enhance microbial diversity in soil.
Microorganisms are also known for being a source and a sink of volatile organic compounds (VOCs), precursor of the particulate matter and of the ozone concentration in the atmosphere. For those reasons we wanted to study the possible effect of reduced microbial diversity in soil on the VOC emissions. Our experiment consisted of the manipulation, under laboratory conditions, of small microcosms: each microcosm contained 30 g of soil + one of the 3 solution with different level of microbial diversity (high-D0, medium-D1, low-D2) (Figure 1). After that, the microcosms where incubated during 6 weeks in order to reach the same microbial biomass in every sample. Figure 1 shows the calculated Shannon index, which indicate the level of microbial diversity for the different microcosms. From this figure we can narrow that our samples have a significant decreasing microbial diversity level.

For each of our microcosms we detected the VOC emissions with a high-resolution technique: the proton transfer reaction - time of flight- mass spectrometer (PTR-TOF-MS). This instrument allowed the detection of more than 700 different VOCs from every small microcosm analysed. After the detection of the VOC emissions we analysed the DNA within the microcosms to quantify and specify which microbial phyla survived after the dilution and the incubation period. Results from Figure 2 shows that the summed VOC emissions from the three different microbial diversity levels are significantly different.

With this result we raise awareness about the increase of VOCs from the soil when microbial diversity in soil decreased.
Going further on the analysis, we correlated different microbial phyla abundance with the different VOCs emitted (Figure 3). The results of this correlation highlighted that most of the phyla are negatively correlated with the VOC emissions (yellow square - Figure 3). This made us suppose that those could be VOCs absorbing phyla. The black square in Figure 3 represented a positive correlation between microbial phyla and the VOC. We hypothesised that phyla with an high presence of positive correlation with the emission could be VOC emitters phyla. Positive correlation with VOC emission were in Proteobacteria, Bacteroidetes phyla and in fungi phyla.

Looking at Figure 3 we could suppose that microbial phyla are mostly absorbing VOCs. Unfortunately, this is not the case. Results concerning relative abundance (Figure 4) of the phyla showed that while the diversity is lower VOC emitters phyla such as Proteobacteria and Bacteroidetes phyla, increased their abundance. Since they are emitters of VOCs they are responsible of the increasing VOC emissions in the low diversity level.
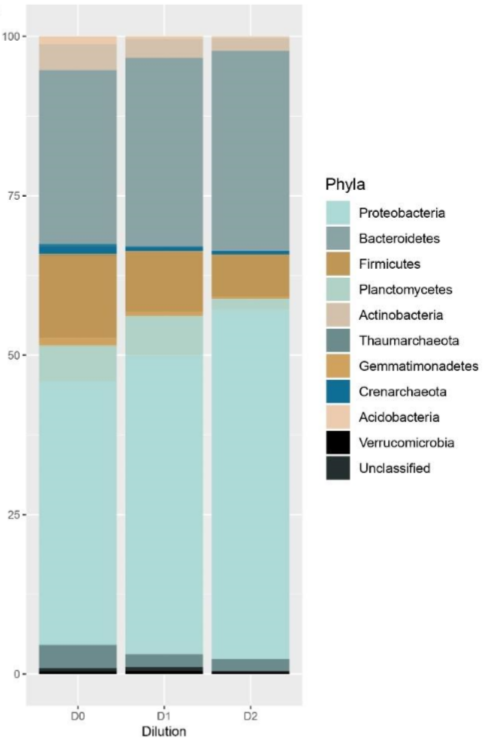
In conclusion, this study showed that reduced levels of microbial diversity in soil increased VOC emissions from soils. Furthermore we found that Proteobacteria and Bacteroidetes phyla were positively correlated to VOC emissions, while other prokaryotic phyla were either negatively correlated or very slightly positively correlated to VOC emissions. Our interpretation is that Proteobacteria and Bacteroidetes were the cause of the increased emissions in the low diversity level.
Follow the Topic
-
Scientific Reports

An open access journal publishing original research from across all areas of the natural sciences, psychology, medicine and engineering.
Related Collections
With Collections, you can get published faster and increase your visibility.
Reproductive Health
Publishing Model: Hybrid
Deadline: Mar 30, 2026
Women’s Health
Publishing Model: Open Access
Deadline: Feb 28, 2026


Please sign in or register for FREE
If you are a registered user on Research Communities by Springer Nature, please sign in