Seasonal AOD analysis based on AERONET observations in North and West Africa over 2010–2019
Published in Earth & Environment
This study presents a comprehensive characterization of aerosols across selected Eurafrican stations over a decade (2010–2019), utilizing Aerosol Optical Depth (AOD) and Angstrom Exponent (AE) data from the surface-based AERONET Version 3, Level 2 dataset. The main objective is to understand the spatial and seasonal variability of aerosols and their relationship with regional meteorological patterns, with particular focus on how different aerosol types dominate across varied geographic and climatic regions.
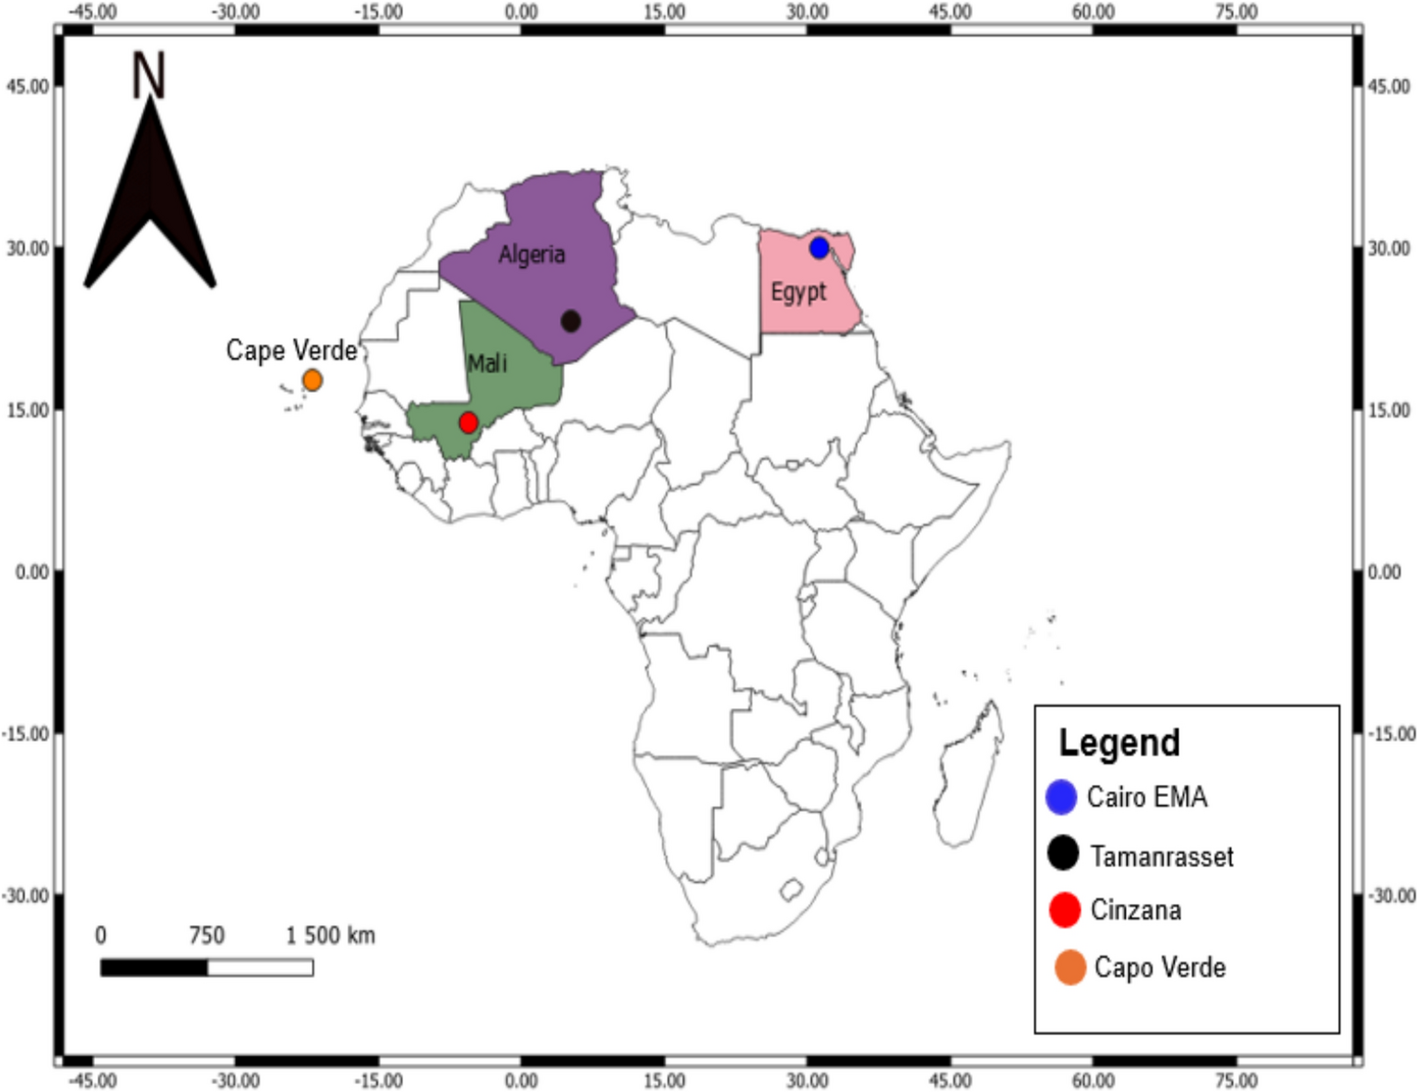
Four stations were selected for analysis, representing both eastern and western parts of the Eurafrican domain: Cairo_EMA_2 (Egypt) and Tamanrasset_INM (Algeria) in the east, and IER Cinzana (Mali) and Cape Verde in the west. To ensure accurate and reliable comparisons across sites, the AOD data were first detrended to remove inherent seasonal trends. Validated AOD and AE values were then employed to classify aerosol types and assess their seasonal behavior, providing insight into the dominant aerosol sources and their temporal dynamics.
Aerosol Type Classification and Key Findings
The results confirm that Saharan dust is the dominant aerosol type at the eastern stations of Cairo and Tamanrasset. This is evidenced by AOD values less than 1 and AE values less than 1, which indicate the prevalence of large, coarse particles typical of desert dust. In contrast, the western stations of IER Cinzana and Cape Verde display both AOD and AE values greater than 1, signifying finer aerosol particles. These finer particles are likely influenced by sources such as biomass burning and anthropogenic pollution, which are common in these regions.
Seasonal analysis further revealed that the monsoon season is the period of highest dust activity. Conversely, the winter season exhibited lower AOD values at the eastern stations, highlighting the strong seasonal influence of regional meteorological cycles on aerosol loading and type. The seasonal cycles show that the monsoon not only drives dust transport but also affects aerosol optical properties through changes in humidity, wind patterns, and atmospheric mixing.
Linear regression analysis between AOD and AE was conducted for the various sites. At Tamanrasset_INM, an inverse relationship was observed, with AE mean and standard deviation of approximately 0.01 ± 0.28, supporting the dominance of dust aerosols driven by strong surface winds. This inverse coupling between AE and AOD is significant because fine-mode aerosols generally have AE > 1, while coarse-mode aerosols show AE < 1. The root mean square error (RMSE) and mean absolute error (MAE) for regression fits were low, indicating good agreement and reliable characterization of aerosol optical properties.
Detrending of AOD time series was necessary to separate seasonal variations from longer-term trends. Seasonal patterns can otherwise mask relative changes in aerosol loading. This approach enables a more precise understanding of aerosol behavior over time and across regions.
Seasonal cycles were examined in detail, classifying data into winter, premonsoon, monsoon, and postmonsoon periods, which collectively represent about 25% of the dataset. The study found that AOD spectral dominance begins in the premonsoon and extends through the monsoon season, with characteristic dust loading. AE values during this period ranged from 0.22 to 0.33, all below 1, further confirming the coarse dust particle presence.
Winter was characterized by drier local conditions, with AE values peaking at 0.33 and showing typical dust aerosol peaks in AOD. These results emphasize the key role that local meteorology and atmospheric chemistry play in influencing aerosol concentrations. For instance, low-pressure regions tend to have higher AOD loading due to enhanced aerosol uplift and transport.
The inverse correlation between AE and AOD was again confirmed for Cairo_EMA_2, with seasonal variations clearly indicating that different aerosol types dominate at different times of the year. Winter spectral means showed negative deviations in AOD and AE, consistent with dust dominance, whereas premonsoon periods exhibited more varied aerosol properties.
The spatial trends highlight the asymmetric AOD variations, particularly pronounced in the eastern region after detrending. This asymmetry may result from additional aerosol types such as black carbon or other absorbing aerosols contributing to the optical depth.
The comprehensive decadal analysis across the Eurafrican stations revealed distinct regimes of aerosol sources and types, including dust, biomass burning, and urban pollution, each with unique optical and physical-chemical properties. These sources are affected by long-range transport and seasonality, demonstrating the complex nature of aerosol dynamics in the region.
The findings provide a clearer understanding of the spatial heterogeneity and seasonal shifts in aerosol properties across Eurafrican regions. Saharan dust remains the principal aerosol type in eastern stations, while western stations show more influence from finer aerosols related to biomass burning and human activities. The study confirms the monsoon season as a major driver for dust transport and highlights how meteorological cycles shape aerosol characteristics.
The study link is here: Recent study in aerosol distribution
I study fascinating phenomena in the physics of the upper atmosphere, with a focus on GNSS-based investigations. My research involves analyzing GNSS data to explore magnetosphere-ionosphere-thermosphere (MIT) coupling, phase delay irregularities in trans-ionospheric propagation, and traveling ionospheric disturbances (TIDs). I examine global total electron content (TEC) variations during ionospheric substorms and storms, as well as the coupling of TIDs with stratospheric warming events through the propagation of atmospheric gravity waves (AGWs). Additionally, I utilize the rate of TEC index (ROTI) complemented with amplitude and phase (S4 & sigma-phi) datasets to assess scintillation effects during ionospheric disturbances mostly quantifying ambient electric field and neutral winds.
My academic background includes a master’s thesis in aerosol science, which later transitioned into ionospheric studies. I have included links to selected publications in both space physics and lower atmosphere research, highlighting results on ionospheric disturbances during geomagnetic storms and aerosol modeling.
https://www.frontiersin.org/articles/10.3389/fspas.2022.947473/full
https://link.springer.com/article/10.1007/s00704-023-04384-6
Please feel free to contact me through email:
Follow the Topic
-
Discover Environment
This is a transdisciplinary, open-access journal that provides a leading platform for the rapid dissemination of knowledge and advances covering the research and innovation that is taking place across the environmental sector.

Related Collections
With Collections, you can get published faster and increase your visibility.
Water Environment: Addressing Global Water Challenges
Water is an indispensable natural resource, yet it faces escalating threats from pollution, climate change, and human activity. The Water Environment: Addressing Global Water Challenges section of Discover Environment Journal is dedicated to publishing innovative research on the dynamics of water systems—tracing their journey from source to fate while examining the interplay between natural processes and anthropogenic influences. This section delves into critical domains, including chemical hydrology, watershed and basin science, glacier environments, and land-use impacts. We welcome contributions that address pressing issues such as water pollution, the transport and transformation of contaminants, hydrological modeling, and sustainable water management strategies. We place particular emphasis on the consequences of land-use changes on hydrological cycles, the stability of glacier-fed water systems, and effective approaches to safeguarding freshwater and marine ecosystems.
Key topics include:
Chemical Hydrology: Analysis of water composition, pollutant behavior, and geochemical interactions shaping water quality.
Basin and Catchment Science: Investigations into watershed hydrology, sediment transport, and hydrogeomorphological processes.
Glacier Environments: Research on cryospheric hydrology, glacier-fed rivers, and the influence of climate change on water availability.
Land-Use Systems: Examining the effects of agriculture, urbanization, deforestation, and industry on water resources.
Water Pollution & Remediation: Addressing emerging contaminants (e.g., microplastics, pharmaceuticals, PFAS), nature-based solutions, and policy frameworks for water protection.
Sustainable Water Management: Innovations in water conservation, resilience-building strategies, and alignment with Sustainable Development Goals (SDGs), particularly SDG 6 (Clean Water and Sanitation).
Methodological advancement in water research
Furthermore, to enhance the scope and impact of the section, we strongly encourage submissions that:
• Include case studies from underrepresented regions, particularly Sub-Saharan Africa and small island states, to showcase diverse hydrological challenges and locally relevant water management solutions.
• Promote the integration of traditional ecological knowledge and community-based water governance practices to enhance the cultural relevance and sustainability of proposed water stewardship strategies.
• Explore transboundary water issues, including shared aquifers and river basins, to highlight the importance of cooperation and policy in sustainable resource management.
• Emphasize the value of coupling remote sensing and GIS technologies with in-situ hydrological data for improved water quality monitoring and modeling accuracy across scales.
• Focus on emerging contaminants such as microplastics, pharmaceuticals, and PFAS in both freshwater and marine environments, reflecting current global research priorities.
• Give greater attention to groundwater-surface water interactions and their implications for long-term water availability, especially under changing climate and land-use patterns.
• Highlight the role of climate change scenarios and projections in shaping adaptive water management frameworks, particularly in glacier-fed and drought-prone regions.
• Feature interdisciplinary collaborations between hydrologists, ecologists, social scientists, and engineers to propose holistic and inclusive water resource solutions.
• Promote alignment of all submissions with SDG targets, especially SDG 6 (Clean Water and Sanitation) and SDG 13 (Climate Action), to strengthen policy relevance.
• Include policy briefs or synthesis articles that translate technical findings into actionable guidance for water managers and decision-makers.
By fostering interdisciplinary collaboration and highlighting diverse perspectives, the Water Environment: Addressing Global Water Challenges section serves as a vital platform for advancing knowledge on global water challenges and informing policy for sustainable water stewardship.
This Collection supports and amplifies research related to: SDG 6 & SDG 13
Keywords: Water Systems, Water Pollution, Climate Change, Land-Use Impacts, Sustainable Water Management, Emerging Contaminants, Hydrological Modeling, Interdisciplinary Collaboration, SDG 6 (Clean Water and Sanitation), Chemical Hydrology, Watershed Science, and Glacier Environments.
Publishing Model: Open Access
Deadline: Dec 30, 2026
Advancing Environmental Sustainability via Green Finance, Energy Efficiency, and Clean Technologies
Background:
Ecological deterioration and climate change are on the rise, posing significant shifts in production, investment and consumption of societies. The attainment of economic development through the use of fossil fuels and polluting technologies causes the emission of greenhouse gases that deteriorate the environment (Deka et al., 2023; Kadir et al., 2023). Pollution is an inevitable by-product of economic activities; thus, it is important to develop contemporary economic models that address environmental costs and the problem of resource depletion (Hussen, 2000; Deka, 2024; Jarijari et al., 2025). This collection realizes the importance of adopting a multi-faceted approach that integrates strategic financial mechanisms with technological innovation and optimized resource use in order to foster ecological sustainability. The collection seeks to address the ‘Sustainable Development Goals’ (SDG) 13 of climate action through the use of less polluting energy sources and technologies, and SDG 7 (Affordable and Clean Energy) to ensure access to affordable, reliable, sustainable, and modern energy for all.
Aims:
This collection aims to synthesize and explore knowledge on how green finance, energy efficiency and clean technologies can be employed in advancing a smooth transition to sustainable futures. Policy frameworks, emerging solutions and effective strategies that that are useful in facilitating a shift to clean energy and technologies, foster sustainable economic development and environmental protection are explored on.
Objectives:
* To display clean technological advancements that lessen environmental impact in different economic sectors.
* To demonstrate how energy efficiency is fundamental in reducing emissions.
* To investigate key mechanisms that can be adopted to ensure the efficient channeling of green finance into practices and projects that support environmental sustainability.
* To identify interconnections as well as synergies between these three pillars; hence, facilitate the development of integrated sustainable solutions
Scope:
This Collection explores interdisciplinary strategies integrating finance, energy, and technology to tackle global environmental challenges.
* Green Finance: Sustainable investment funds, green bonds, impact investing, carbon finance, sustainable banking practices, lending that considers an assessment of environmental risk, green finance policy frameworks, and the promotion of sustainability by financial institutions.
* Clean Technologies: that is, (i) technologies on carbon capture and pollution control; (ii) renewable energy sources, such as hydro, geothermal, wind and solar; (iii) innovations on the circular economy and waste management; (iv) sustainable solutions to transportation, such as electric vehicles and alternative fuels; (v) green building materials and technological innovation toward sustainable agriculture.
* Energy Efficiency: Smart grids, smart metering incentives or nudging strategies for consumer energy reduction, retrofitting energy-efficient technologies in buildings and in new designs, efficient standards on appliances, optimizing industrial energy, and energy management systems.
* Governance and Policy: International agreements, regulatory frameworks, incentive measures and regulatory standards for energy efficiency and public-private partnerships in supporting the scaling and adoption of clean technologies.
* Best Practices and Case Studies: Successfully implemented real-world examples from different industrial sectors and geographical contexts.
This Collection supports and amplifies research related to SDG 7 & SDG 13
Keywords: Environmental Sustainability; Green Finance; Green Technological Innovations; Energy Efficiency; Climate Change; Sustainable Development
Publishing Model: Open Access
Deadline: Aug 31, 2026

Please sign in or register for FREE
If you are a registered user on Research Communities by Springer Nature, please sign in