Shockwaves Link (Anti)Social Behavior Across the Internet
Published in Physics, Statistics, and Arts & Humanities
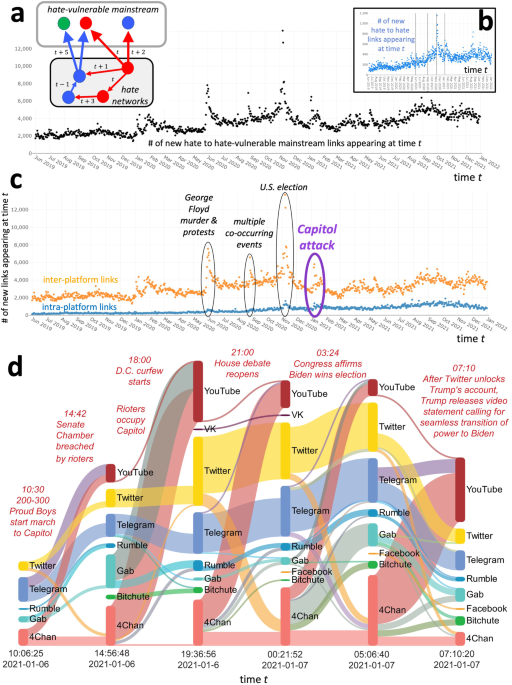
One of our paper’s key findings is shown in Figure 1d, which examines what happened online during the January 6, 2021 Capitol attack on a minute-by-minute scale. It is particularly relevant this year, not just because the U.S. Presidential election will likely feature the same candidates as in 2020, but also because around 3 billion people are due to vote globally. Coupled with the meteoric rise in the accessibility of generative AI, this makes 2024 a crucial time to have an accurate understanding of the online landscape, particularly around hate and extremism and the mis/disinformation that its supporters promote.

Figure 1d shows “waves” of links forming during the day within and between social media platforms – not just the ones that are frequently in the news (e.g. Facebook, Twitter) but also lesser-known ones that are often dismissed as unimportant. In legislation such as the recent EU Digital Services Act, these platforms aren't subject to as much scrutiny as the large ones, but still play a major role in the online hate ecosystem.
Most importantly, the waves shown in the figure are not the result of some top-down control or a single person/politician issuing orders, but rather the result of a global “sea” of individuals. These individuals participate in online hate groups in a decentralized way.
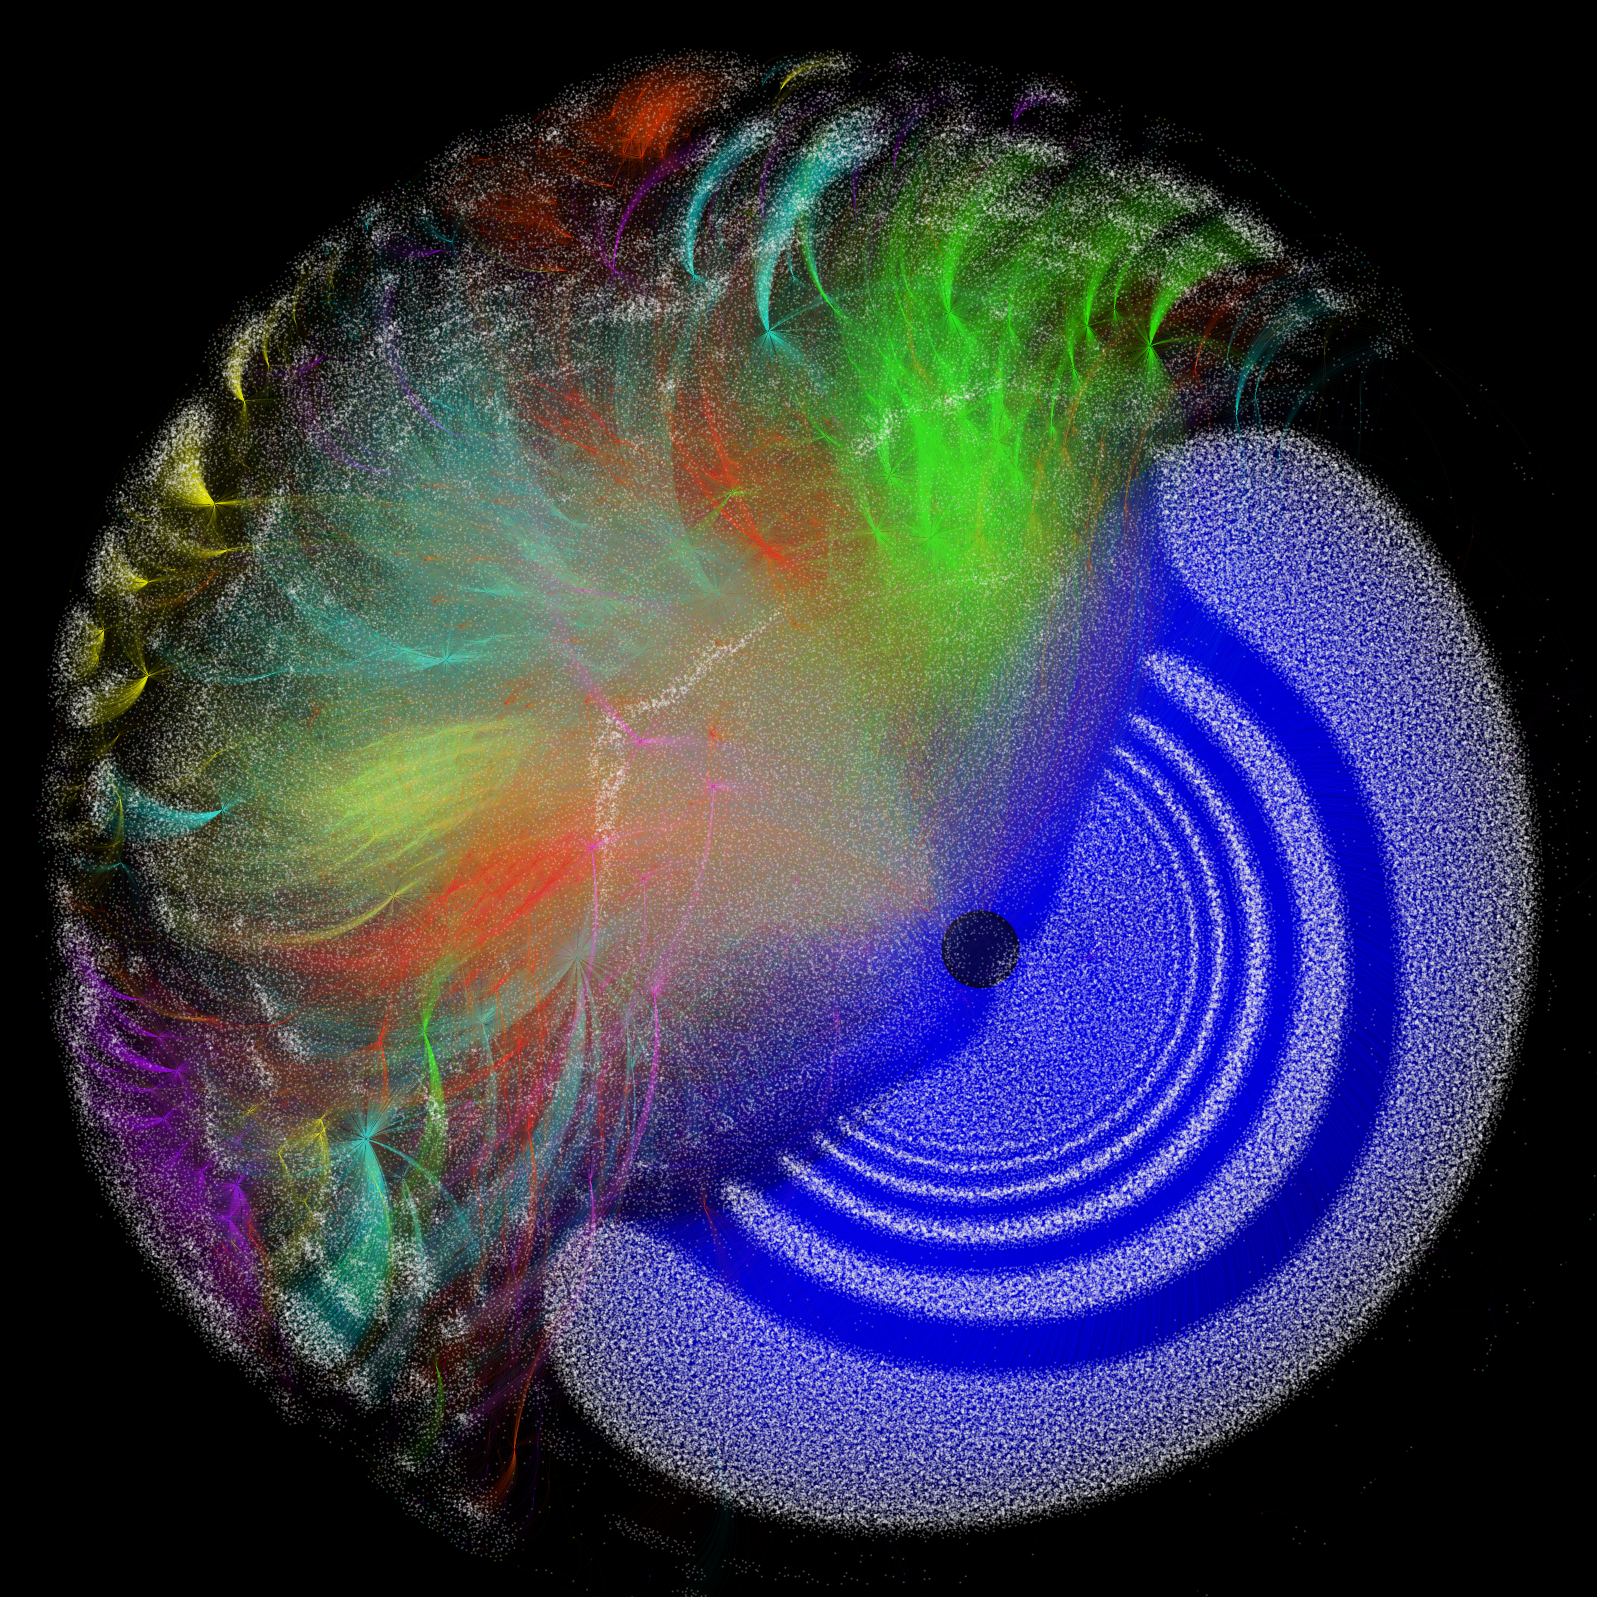
We were able to uncover these shockwave mechanisms thanks to our first-of-its-kind network map of the online hate ecosystem: a dynamical network of URLs (“links”) that connect hateful online communities. We decided to focus on links since they are what drive people around the Internet; they are the wind filling the sails. Metrics such as reactions or shares may also be interesting to users within their own feeds or platforms, but for the average person, these pale in comparison to the power of something like “Check out this video!” with an accompanying link.
A network map like this is crucial for answering basic questions about the online hate ecosystem. It is informative to see how many times, for example, the platform 4Chan linked to YouTube or Twitter linked to itself on a minute-by-minute scale. But what if we want to know how many of these links went to the same account? Or, are there a few particular Telegram channels that receive an unusually high number of links at a given time? To answer questions like these, we followed millions of links to their destinations on 13 (and counting!) different social media platforms and collected the basic, publicly visible information we found there.
After plotting all this data using a method that locates nodes according to their importance in the network (the ForceAtlas layout shown in Figure 3a), our map can now provide answers to “Where?”, “When?”, “What?”, and “Who?”

Our research found that rather than large social media platforms being key drivers, waves of adaptive links across many platforms (including small ones) connect the hate user base over time. This behavior fortifies hate networks, bypasses mitigations, and extends their influence across the Internet. The governing equations we present can predict the effectiveness of new mitigation strategies that attempt to curtail this.
Follow the Topic
-
npj Complexity
This is an open access, international, peer-reviewed journal dedicated to publishing the highest quality research on complex systems and their emergent behaviour at multiple scales.

Related Collections
With Collections, you can get published faster and increase your visibility.
Unnatural Histories: Investigating the Improbable with Experimental Evolution and Artificial Life
Publishing Model: Open Access
Deadline: Sep 12, 2026
Pedagogy and Complexity
Publishing Model: Open Access
Deadline: Dec 31, 2026


Please sign in or register for FREE
If you are a registered user on Research Communities by Springer Nature, please sign in