What's trending in your electronic health record feed?
Published in Healthcare & Nursing

Explore the Research

Real-time clinician text feeds from electronic health records - npj Digital Medicine
npj Digital Medicine - Real-time clinician text feeds from electronic health records
Text-based analyses of social media and the wider internet is widely used for analysing social and news trends. A recent article in this journal Lu & Reis 2021 shows the value of these analyses in internet search terms (Blog discussion, #1 and #2 ). Open data streams are rich streams of data on whole population trends as evidenced by work by Google Flu a decade earlier.
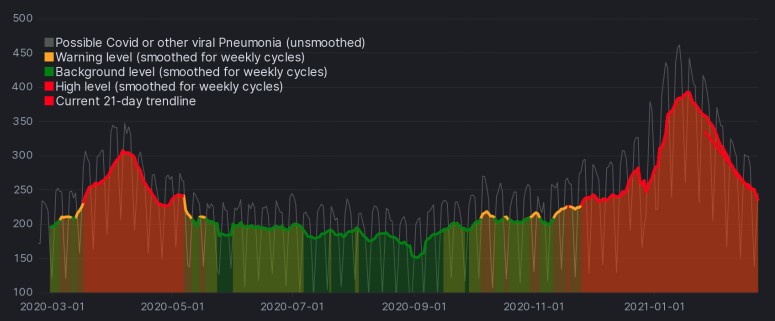
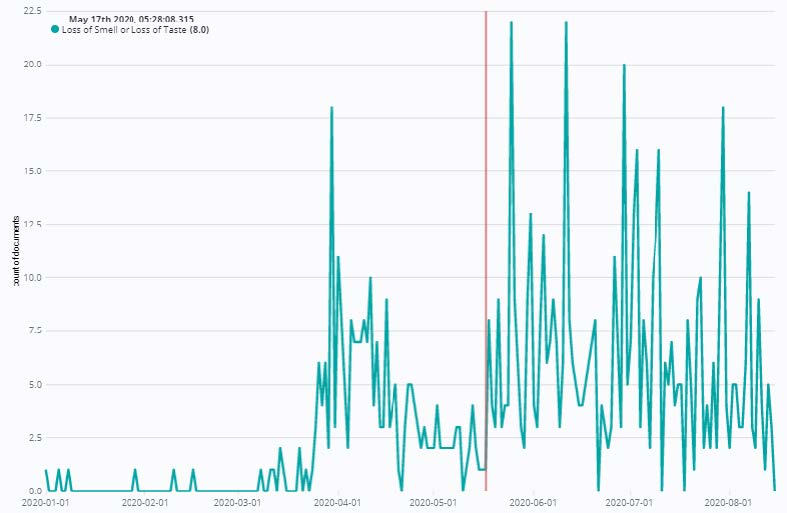
In our work, we have taken a different approach by performing a similar textual trend analysis, but this time within private health data lakes - the unstructured data within electronic health records (EHR). In two large hospitals, unstructured clinical text data was pooled internally to each hospital in two separate health data lakes using our EHR-vendor-neutral open-source Cogstack platform. From there, it is trivial to build trends from these massive 'Bags of Words' based on symptom words suggestive of Covid-19 pneumonia. These data trends track 'Gold Standard' tests of Covid-19 positivity (nasal swab PCR), with up to 3 days head-start. This approach works at two independent hospital groups (King's College Hospital and Guys & St Thomas Hospitals) using two different EHR's (Figure 1 and Figure 2), with locally tailored terms and document types searched.


We also show that these word trends are vulnerable to artefact generated by scientific dissemination (e.g. anosmia symptom) in the general media, indicating that caution should be exercised due to media-sensitivity of such signals, and may be susceptible to 'hashtag' meme-like phenomenon seen in social media.

While we show this works on closed health data lakes (private on the basis of protected health data) and have it implemented in day-to-day use, we would like to emphasise that this technology and approach is available to any healthcare organisation with an electronic health record. The source code for the platform is open-source on Github with online documentation and various recipe for implementations. Running this is also extremely low-cost and minimally intrusive to busy frontline healthcare staff who are already using the existing EHR as there is no standardised case report forms as is used for traditional registry-based studies (with the caveat around artefacts). Beyond single organisations, this would also work with any multi-organisational health data lakes for situational reporting and near-term forecasting.
The development and open availability of this open-source code and platform is made possible from many public UK funding agencies including including NHS England, Medical Research Council, Genomics England, NIHR Biomedical Research Centres (particularly SLaM and UCLH), London AI Centre for Medical Imaging for Value-based Healthcare (AI4VBH), NIHR Applied Research Centre South London, InnovateUK, EU H2020, Health Data Research UK.


Please sign in or register for FREE
If you are a registered user on Research Communities by Springer Nature, please sign in