A fine-scale global insight into human activity changes due to the COVID-19 anthropause
Published in Earth & Environment
This winter marks five years since the COVID-19 pandemic first shook the world, changing how people lived in remarkable ways. Remember back to that time. How was your day to day routine different? Perhaps your kids’ schools closed
, and you stopped working from an office. Perhaps you started ordering your groceries to be delivered. Maybe in your town communal places—like movie theaters, sports arenas, churches, and business districts were closed. But also recall how these changes often happened in waves, often in response to infection levels, community norms, and policies. Your town might have been operating like business as usual while your in-laws in another state or another country might have been in a total lockdown.
These changes in activity patterns are interesting from a scientific point of view, because they offer a natural experiment. What happens to the natural systems in and around our towns and cities when we change our behavior? How would a change in our activity patterns affect wildlife, air quality, emissions, etc.? A key obstacle in answering this question is the lack of human activity data that is locally-resolved, but collected globally, and comparable across space and time.
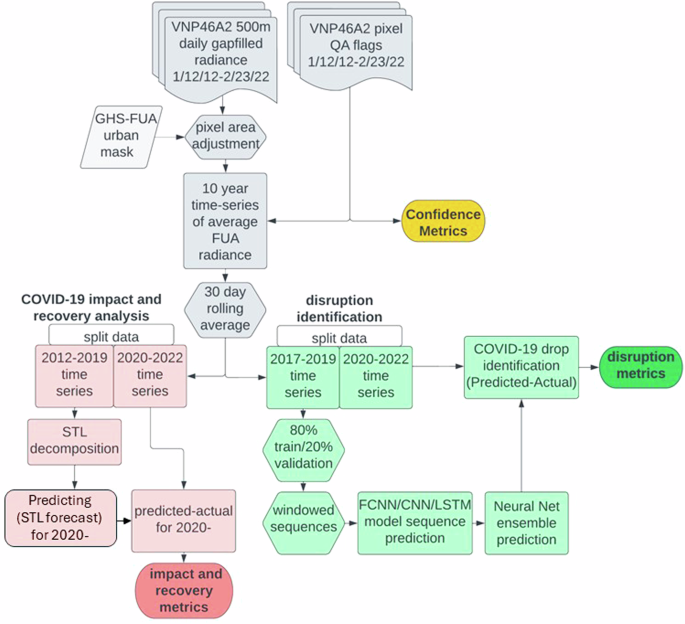
Our study looks to the satellite record to try to fill this gap. We used daily Earth observations of nighttime lights (NTL) that indicate human presence and machine learning models to approximate changes in human activity at a daily, city-level granularity, globally. Our resulting dataset “TRacking Anomalous COVID-19 induced changEs in NTL” (TRACE-NTL) identifies atypical changes observed over 9031 metropolitan areas, during the first two years of the pandemic.
To derive this dataset, we used the aggregated high scientific quality daily NTL signal over cities from 2017-2022 from NASA’s Black Marble NTL product as inputs or indicators of human activity signals. We wanted to see if and how human activity changed as a response to COVID-19, so we used neural network time-series anomaly detectors to examine if noteworthy decreases in lights were observed in cities with the onset of COVID-19. These detectors were trained on the typical NTL record from 2017-2019, before the pandemic. When applied to data from 2020-2022, we tracked any atypical deviation due to reduced human activities with the onset of COVID-19. We quantified the detected change or ‘disruptions’ in each city using a range of metrics on the daily scale, including severity of the change, direction (whether we see an increase or decrease), change duration, and the rate of these changes. All of these metrics are included in the TRACE-NTL dataset.
This approach adjusted to long-term COVID-induced shifts in activity and monitored ongoing responses to waves of new physical distancing policies introduced after the initial onset in March 2020. To also understand human activity changes compared to a fixed pre-COVID baseline, we used traditional time-series decomposition methods that forecasted NTL levels in 2020-2022 based on trends from 2012-2019. We used these daily forecasts for each city to determine if the human activity levels were ‘recovering’ to the pre-COVID-19 patterns.
We found that changes in activity patterns were very different depending on where you live. Cities—even in the same country or state—varied considerably in the timing and severity of changes. This highlights the need for spatially-disaggregated information and analysis in human activity patterns, as previous national or regional scale information is insufficient to capture these finer-scale differences. This is particularly important when looking at the impact of human activity on environmental phenomena that are local in scale—e.g. wildlife movement, water quality, pollution, and air quality.
At country and continental scales, we noted marked synchronous reductions in NTL that approximated the start of the pandemic, in March 2020, with successive periods of drops. Recovery towards pre-COVID 19 levels, indicating a resumption of normal human activity levels, was observed from late summer 2021, coinciding with the availability of vaccines.
Our dataset TRACE-NTL records the COVID-19 disruption and recovery metrics that describe the observed change for all 9031 cities globally on a daily scale, and includes measures of uncertainty. It is made available in a widely used .csv format so it can be easily accessed by the broader scientific and public policy community. In the early years of the pandemic Apple, Google, and Waze provided mobility metrics for a select number of cities based on cell phone data, which were widely used. These were never available ubiquitously across the world and are no longer supported. In contrast, we expect TRACE-NTL daily data to provide for the first time, measures of localized human activity change across all urban areas globally, with open methods that can be applied to NTL satellite data that continues to be collected if there is enough uptake. While these measures in TRACE-NTL have been calculated for the COVID-19 time frame, the same method and dataset could easily be derived for disruptions in human activity associated with other sudden events, such as economic downturns or booms. Our dataset approximates the human dimension of change during COVID-19 and can be used to derive further insight into the human-environment nexus for natural and social scientists. Additionally, we have also designed a data portal to provide visualizations of the change and metrics for a high-level first-step insight into the trends. Visit the portal https://covid19-anthropause.nrp-nautilus.io/ to check out the data on your city and see if it matches your personal experience of how and when your routines of life changed during the pandemic.
Written by: Srija Chakraborty, Eleanor Stokes, Olivia Alexander
Follow the Topic
-
Scientific Data
A peer-reviewed, open-access journal for descriptions of datasets, and research that advances the sharing and reuse of scientific data.

Related Collections
With Collections, you can get published faster and increase your visibility.
Genomics in freshwater and marine science
Publishing Model: Open Access
Deadline: Jul 23, 2026
Computer vision in plant science and agriculture
Publishing Model: Open Access
Deadline: Jul 10, 2026

Please sign in or register for FREE
If you are a registered user on Research Communities by Springer Nature, please sign in