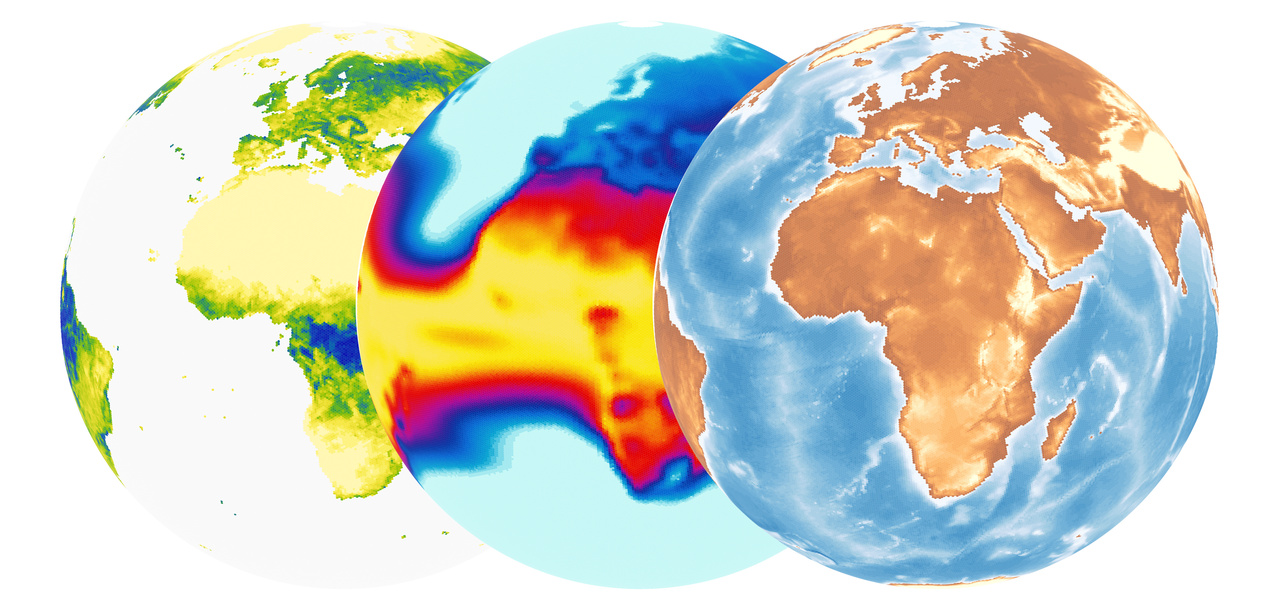
We live in a world of amazing biogeographic diversity: from boreal forest to tropical savanna, the complex interdependencies of flora, fauna, and environment create distinct landscapes and ecological communities. As human activity rapidly alters the Earth system, it's increasingly important to model the relationships among system components, to improve quantitative understanding and anticipate ecosystem response to changing conditions.
In our Data Science & Evolution research group at the University of Helsinki, we use computational modeling to investigate biospheric change - to develop paleoenvironmental proxies, find evolutionary patterns in natural and human systems, and build macroecological models which transfer to new settings. We needed an integrated global dataset for model training, and to this end, we developed the Eco-ISEA3H spatial database, tailored for machine learning (ML)-based species distribution modeling (SDM) and ecometrics research.
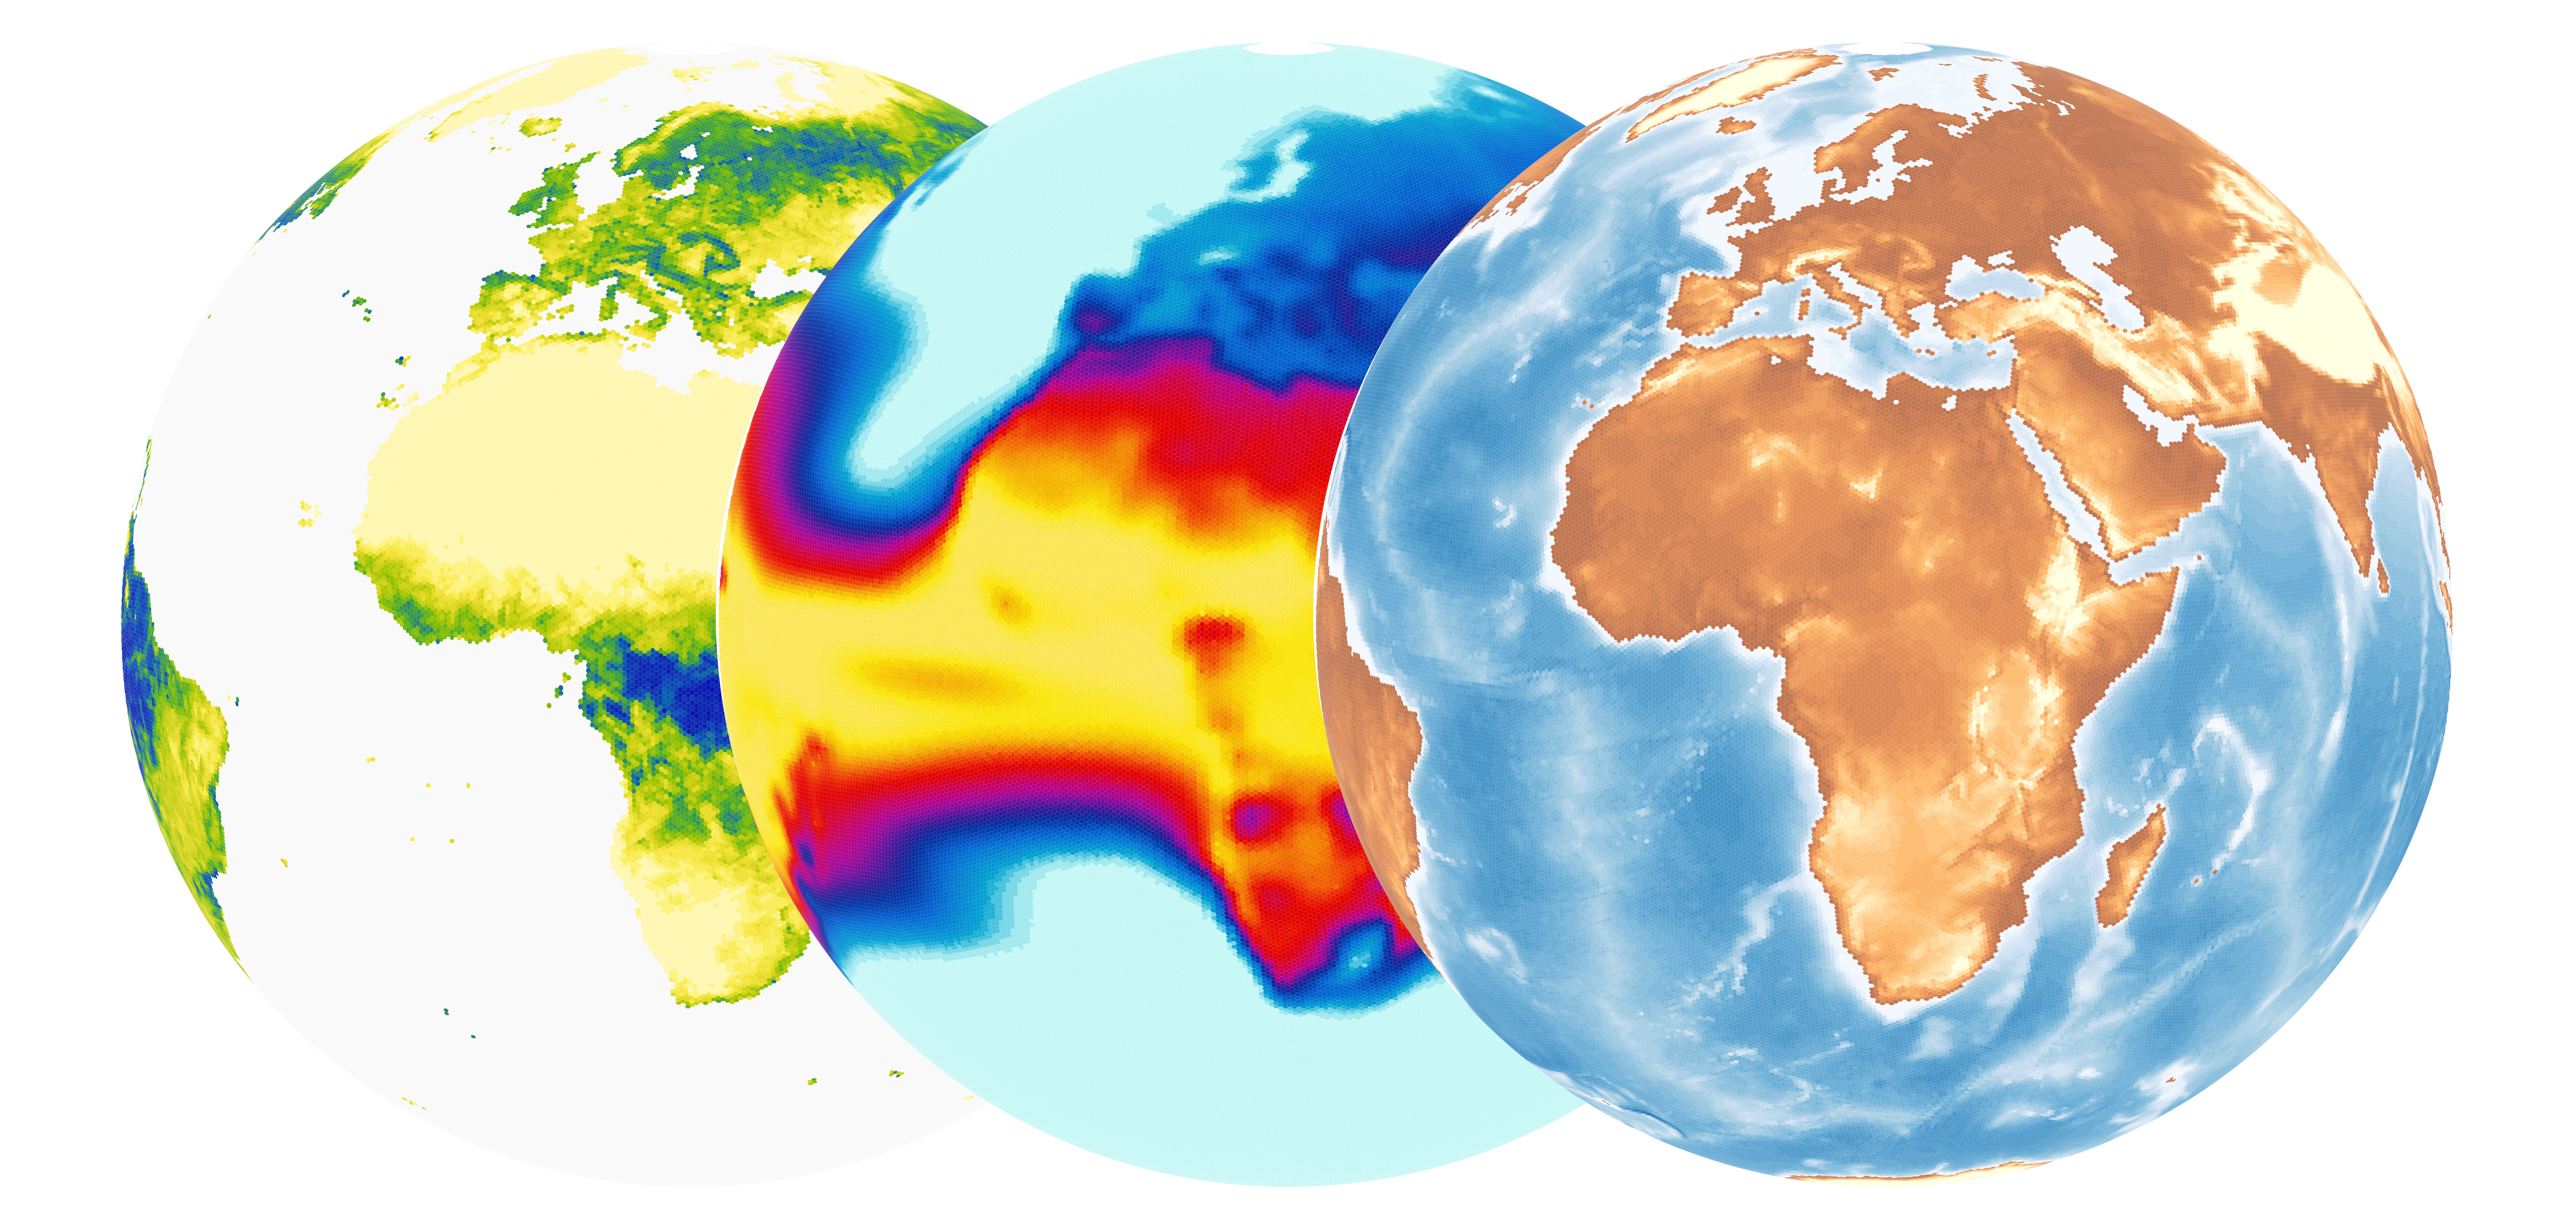
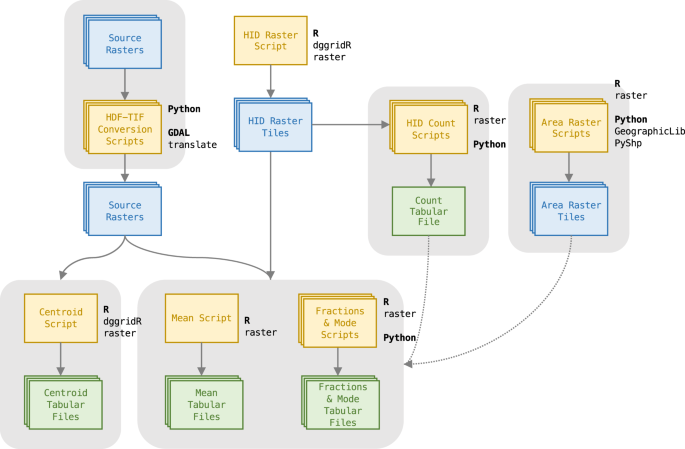
Even a quick search of the scientific literature reveals there's a large and rapidly expanding assortment of Earth observation (EO) data currently available, both remotely sensed and computationally derived. However, when attempting to use these data together, one quickly runs into many different coordinate reference systems, spatial resolutions, geographic data models, and file formats. Ecological models - SDMs, ecometric models, and others - require unified datasets, describing species occurrence and environment via consistent spatial units of observation. To meet this need, we sampled and summarized open EO datasets using the systematic spatial framework provided by a discrete global grid system (DGGS). We started small, and as one research question led to another, we gradually compiled over 3,000 variables, gathered from 17 sources, characterizing climate, land cover, physical and human geography, and the geographic ranges of nearly 900 large mammalian species.
How does the Eco-ISEA3H database differ from other gridded datasets?
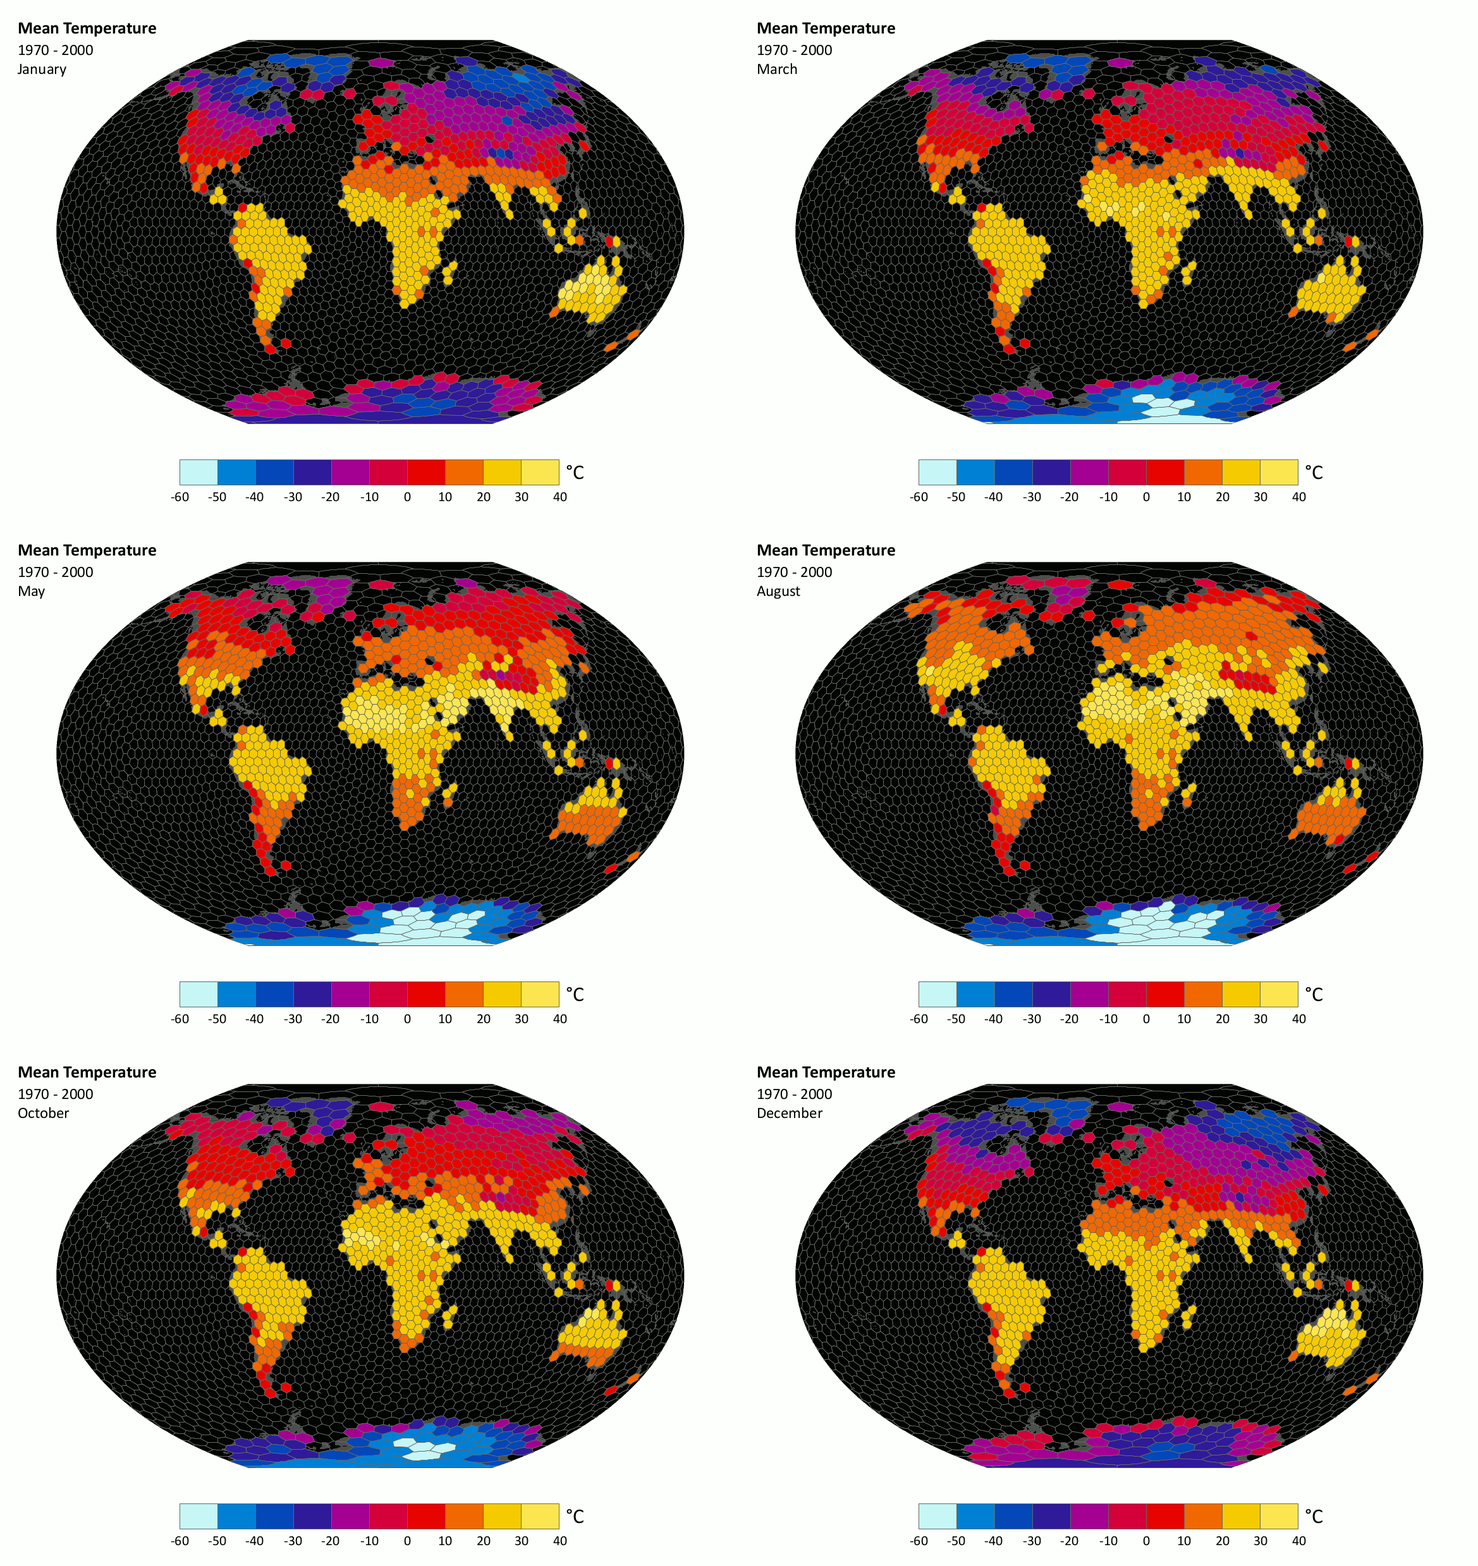
The Eco-ISEA3H database is built on a geodesic DGGS, which divides the Earth's surface into regular grids of equal-area hexagonal cells at several nested resolutions. Specifically, the database utilizes the Icosahedral Snyder Equal Area (ISEA) aperture 3 hexagonal (3H) DGGS. We'll take this name one term at a time, as this will help us look "behind the data," to the database's supporting spatial framework.
The DGGS is defined by first inscribing a polyhedron - in this case, an icosahedron - within a sphere representing the Earth. The icosahedron is oriented such that it's symmetrical about the Equator, and a minimum number of corner points fall on the Earth's terrestrial surface. The triangular faces of the icosahedron are then divided into equal-area hexagonal cells. At each finer resolution, cells have one-third the area of cells at the previous resolution (that is, there's a ratio or aperture of 3:1 between resolutions). Finally, these cells are (inversely) projected to the circumscribed sphere via the ISEA equal-area projection, developed by Snyder.
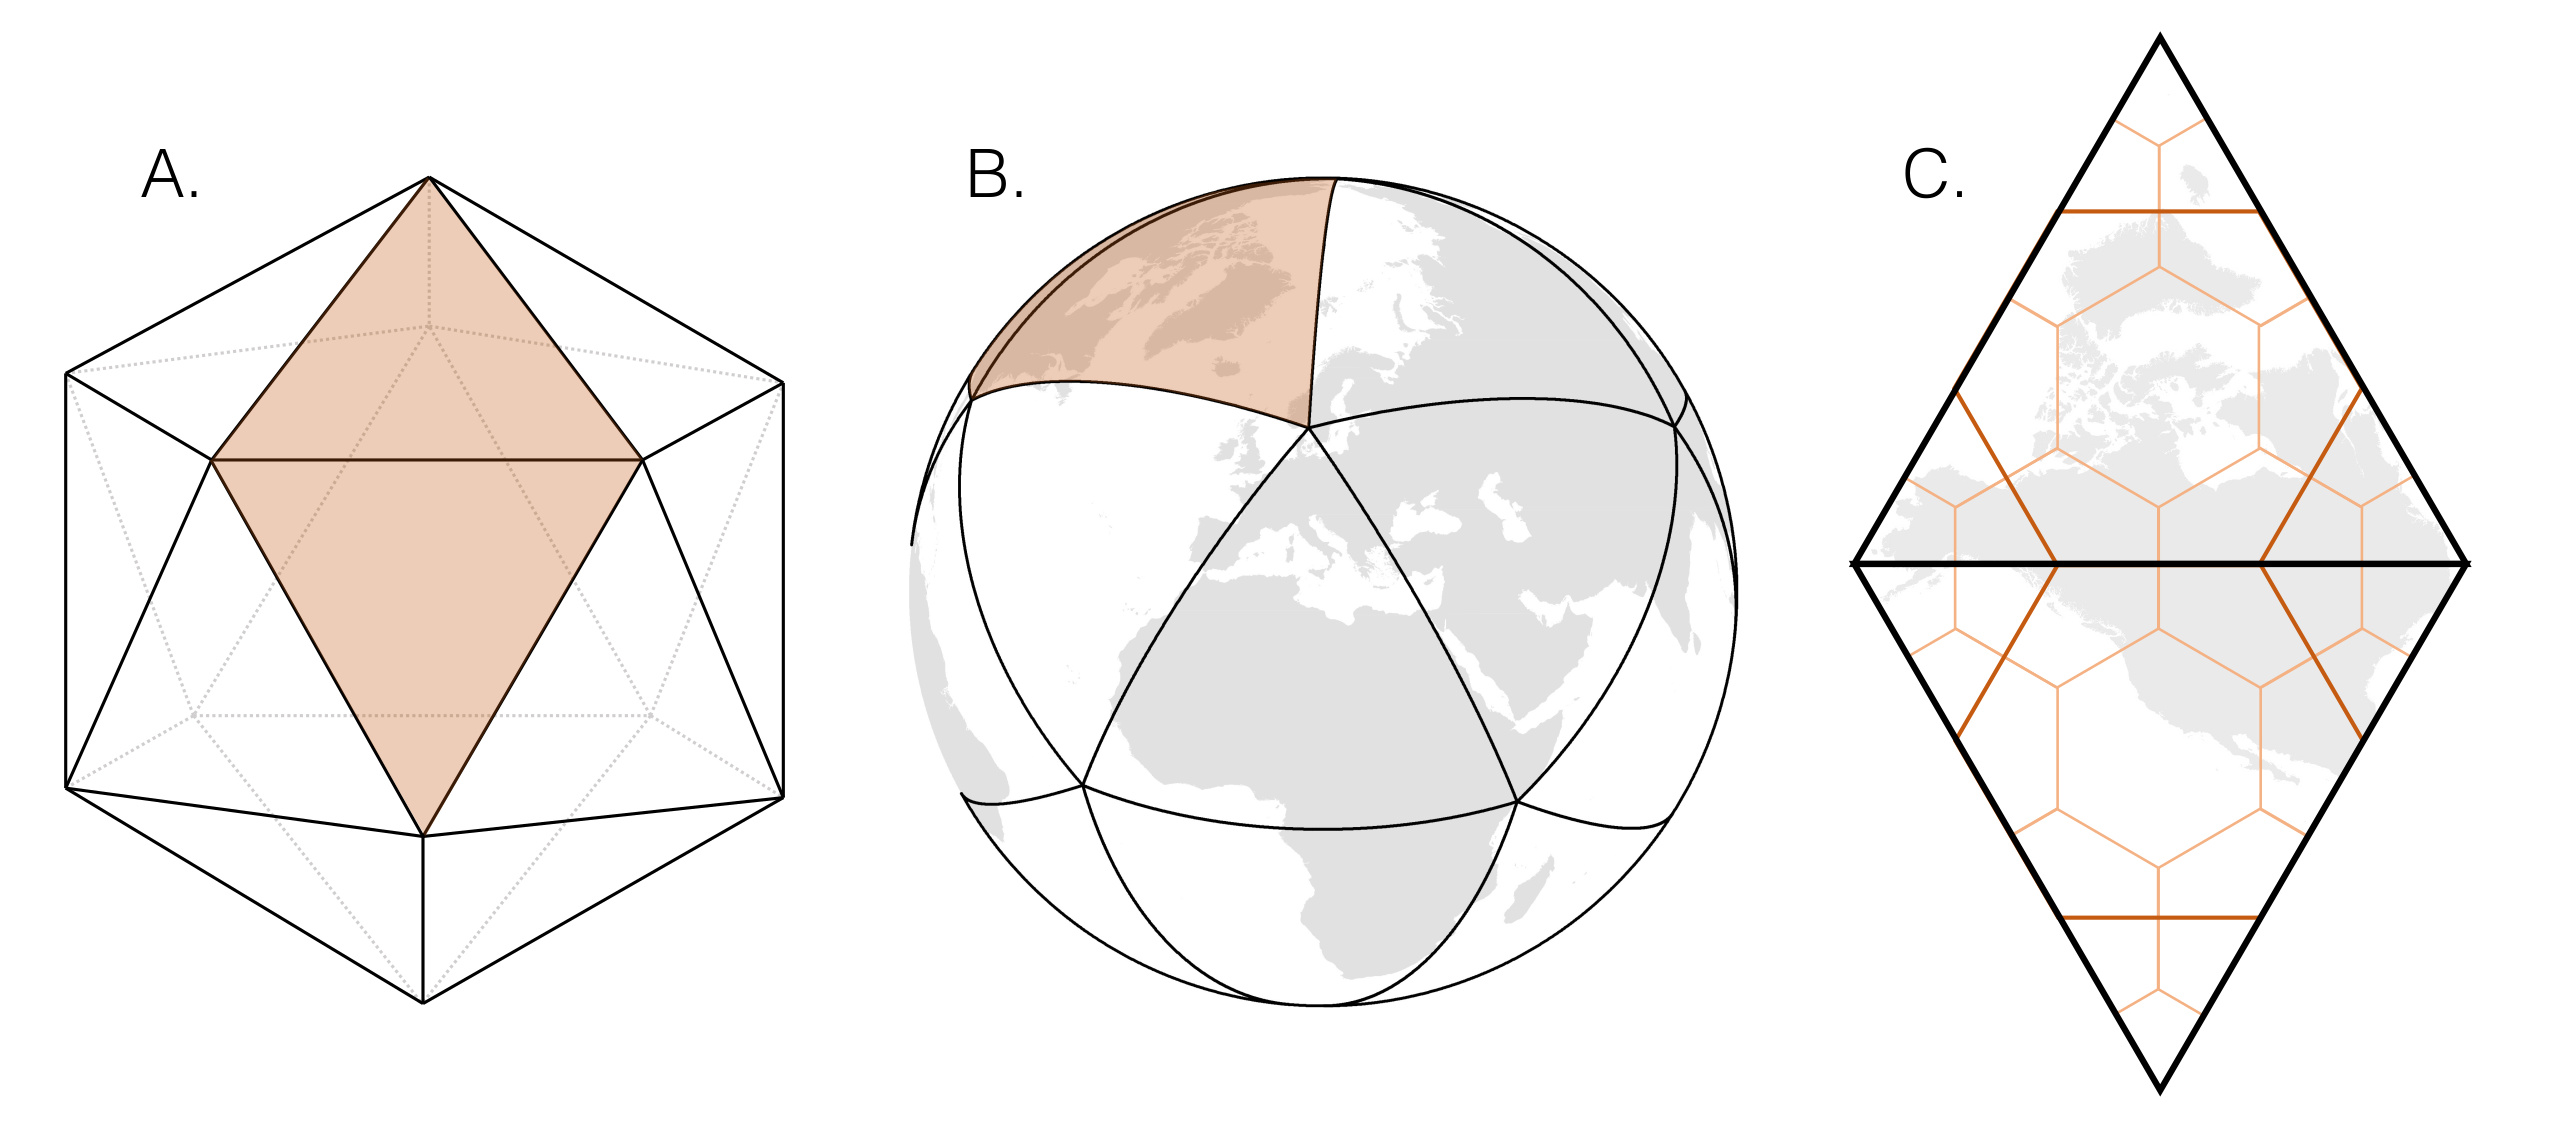
The hexagonal cells of the ISEA3H DGGS have a number of useful properties, which make them highly effective as units of observation, analysis, and visualization. First, hexagons are one of just three polygons (with squares and equilateral triangles) which can be used to create a regular tiling, a highly symmetrical class of tilings made of congruent, regular tiles. Of these three polygons, hexagons are most compact, minimizing expected within-unit variability. Further, hexagons have the simplest relationship with neighbors in a tiling, each sharing an edge with six adjacent hexagons. Finally, hexagons are more visually effective than squares; the strong horizontal and vertical lines of square tilings distract the eye from data-driven patterns of interest. This last point is important, as maps and other visualizations are often essential tools in scientific reasoning.
Let's contrast the DGGS approach with another common approach: using a latitude/longitude grid, or graticule, in which the length of cell edges measure some number of degrees, minutes, and/or seconds of arc. Think, for example, of a raster dataset with 30 arc-second cell resolution. Plotted using default parameters in GIS or other data visualization software (R, for example), such grids appear to form neat arrays of equal-area squares.
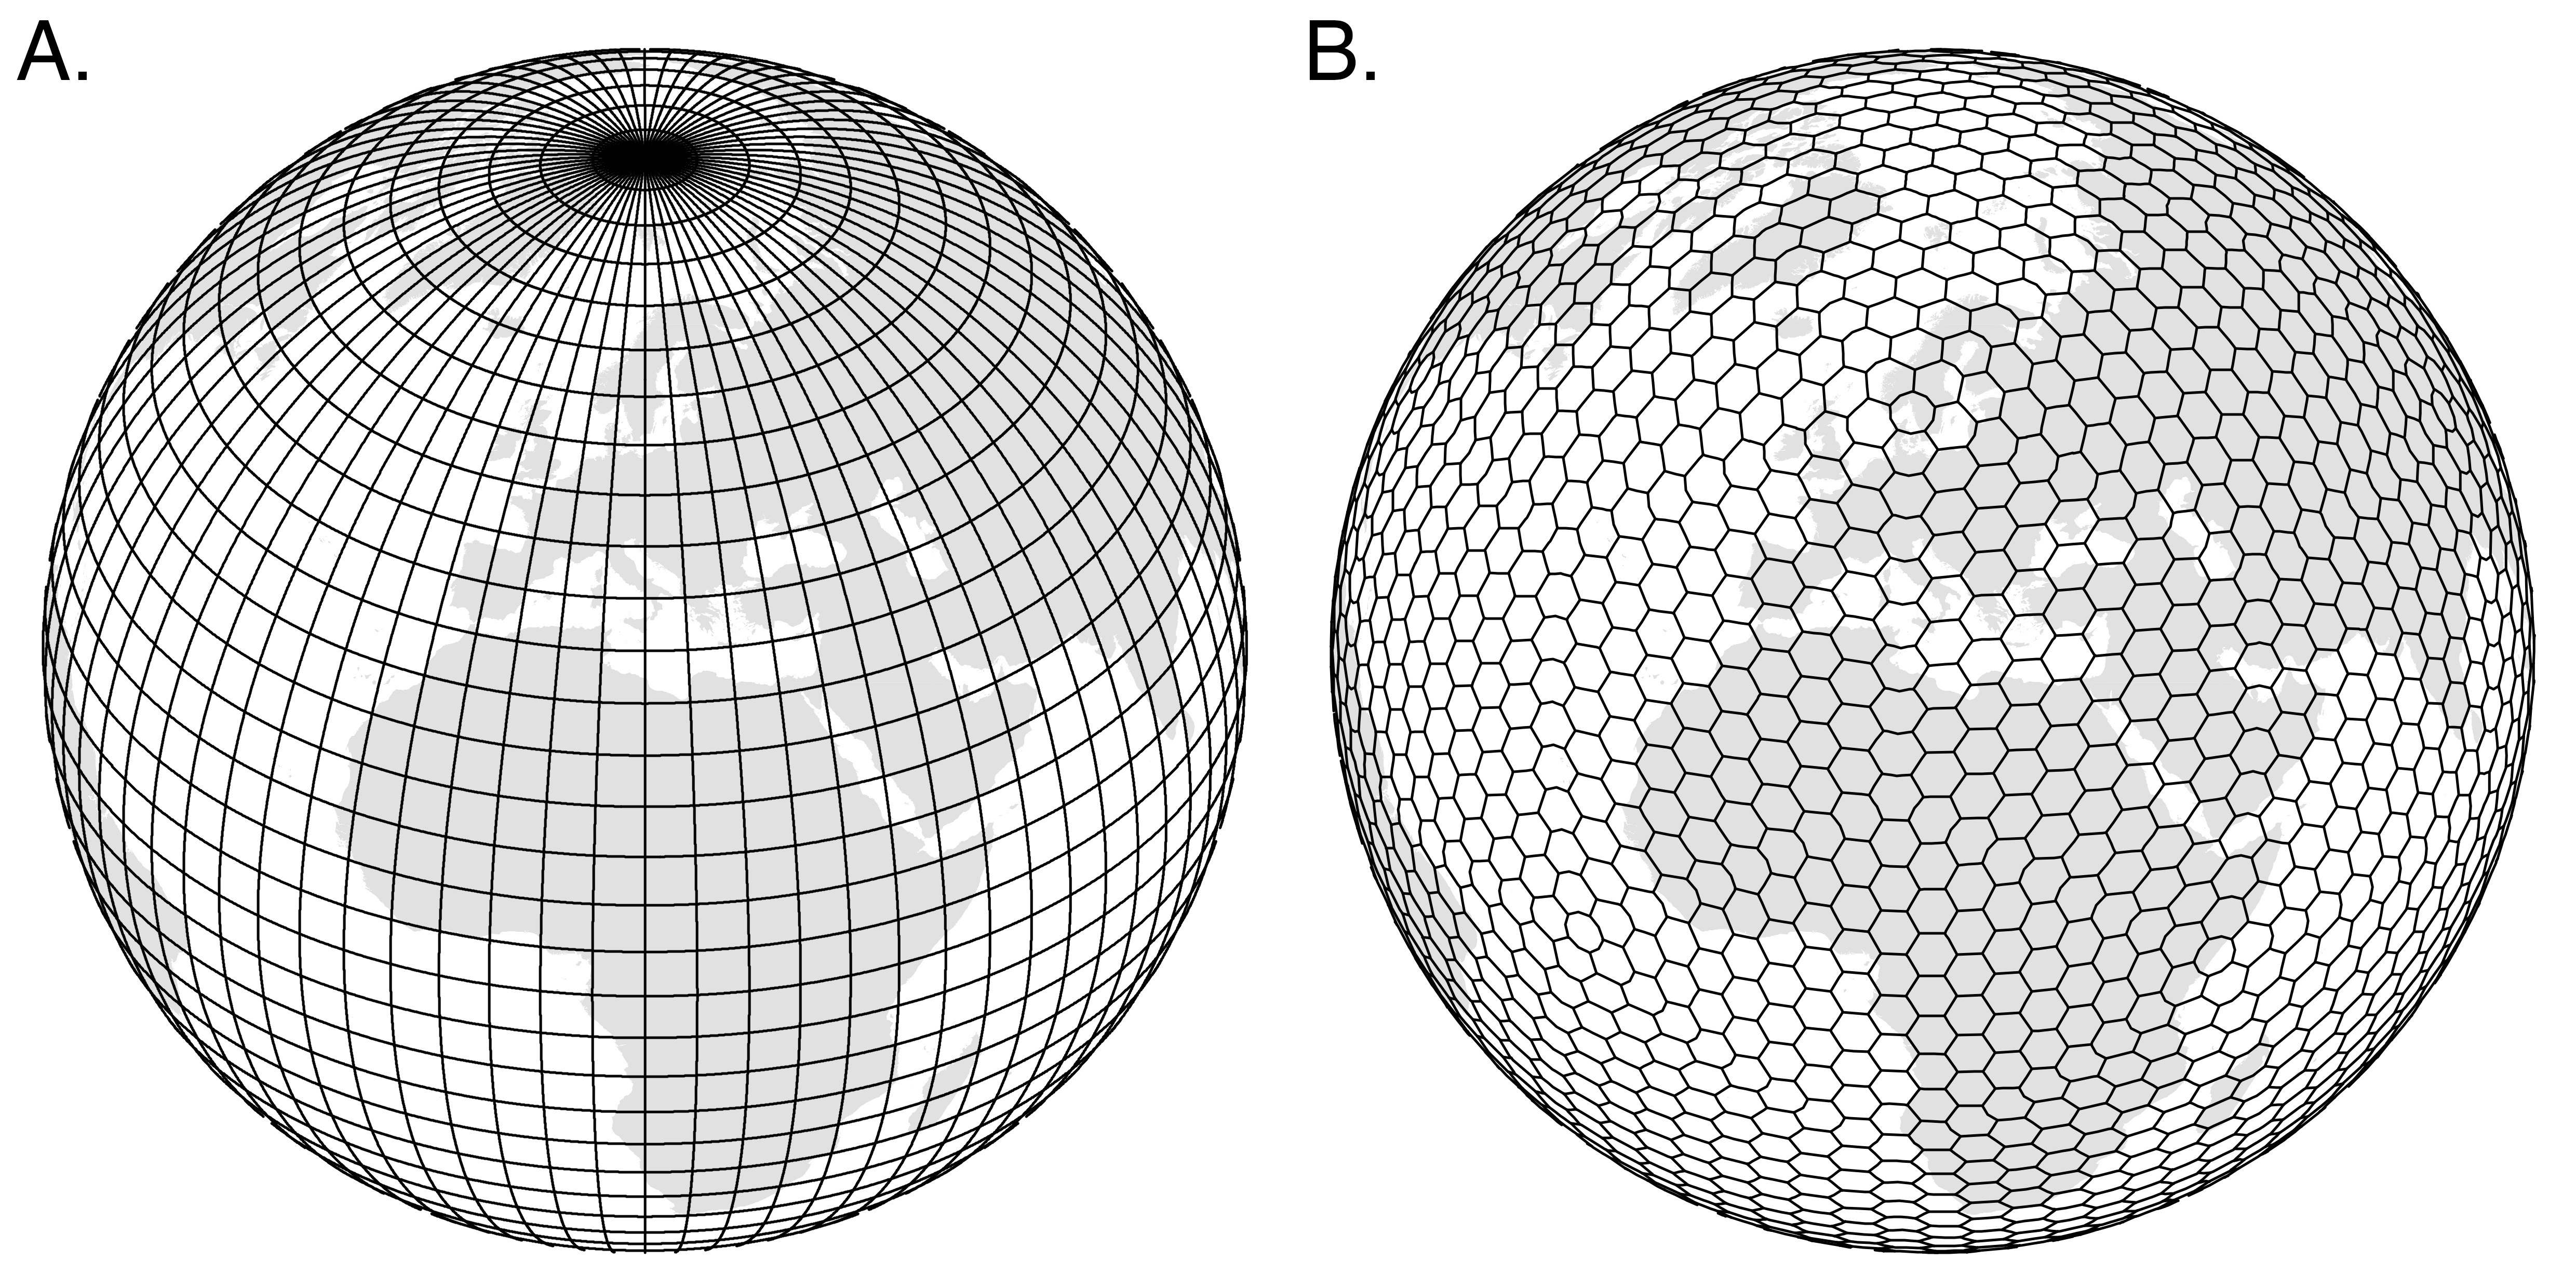
The problem with this approach becomes apparent when the grid is transferred from a flat, on-screen projection to the Earth's spherical surface (panel A in the figure above). North-south lines of longitude converge at the Earth's poles, and 30 seconds of arc, for example, traces a much shorter east-west distance at the Arctic Circle than it does at the Equator. Thus the cells of latitude/longitude grids aren't equal-area, or even consistently square. The ISEA3H DGGS (panel B in the figure above) avoids such singularities at the poles, and maintains equal cell area globally.
Why is this important for ecological modeling?
The observations used in ecological analysis and modeling should be equivalent and directly comparable; thus grid cells used as observational units should maintain equal area (and ideally, consistent shape) throughout the study domain. The equal-area hexagonal cells of the ISEA3H DGGS provide an unbiased summary of the EO datasets we sampled. In contrast, if used as units of observation or analysis without correction, latitude/longitude cells will bias results towards conditions present at higher latitudes. We found that quantifying bioclimatic envelopes using latitude/longitude cells versus ISEA3H DGGS cells shifted the perceived environmental niches of several large, widely distributed mammalian species. Temperature-related measures, which exhibit a latitudinal gradient, suffered more from the biasing effect of unequal latitude/longitude cell area.
DGGSs are an important component of the Digital Earth (DE) vision, in which the Earth system is replicated as a digital model, incorporating data on all aspects of the biotic and abiotic environment. We hope the Eco-ISEA3H database serves as a beginning - that additional EO datasets will be indexed to the spatial framework provided by the ISEA3H DGGS and shared widely. Such a DE resource will facilitate large-scale, integrated analysis and modeling, and help us better understand and anticipate change in the biosphere.
Follow the Topic
-
Scientific Data

A peer-reviewed, open-access journal for descriptions of datasets, and research that advances the sharing and reuse of scientific data.
Related Collections
With Collections, you can get published faster and increase your visibility.
Data for crop management
Publishing Model: Open Access
Deadline: Apr 17, 2026
Data to support drug discovery
Publishing Model: Open Access
Deadline: Apr 22, 2026
Please sign in or register for FREE
If you are a registered user on Research Communities by Springer Nature, please sign in